HAL Id: hal-01433779
https://hal.archives-ouvertes.fr/hal-01433779
Submitted on 10 Jan 2020
HAL is a multi-disciplinary open access
archive for the deposit and dissemination of
sci-entific research documents, whether they are
pub-lished or not. The documents may come from
teaching and research institutions in France or
abroad, or from public or private research centers.
L’archive ouverte pluridisciplinaire HAL, est
destinée au dépôt et à la diffusion de documents
scientifiques de niveau recherche, publiés ou non,
émanant des établissements d’enseignement et de
recherche français ou étrangers, des laboratoires
publics ou privés.
Robust dynamic range computation for high dynamic
range content
Vedad Hulusic, Giuseppe Valenzise, Kurt Debattista, Frederic Dufaux
To cite this version:
Vedad Hulusic, Giuseppe Valenzise, Kurt Debattista, Frederic Dufaux. Robust dynamic range
com-putation for high dynamic range content. Human Vision and Electronic Imaging Conference, IS&T
International Symposium on Electronic Imaging (EI 2017), Jan 2017, Burlingame, United States.
�hal-01433779�
Robust Dynamic Range Computation for High Dynamic Range
Content
Vedad Hulusic, LTCI, CNRS, T ´el ´ecom ParisTech, Universit ´e Paris-Saclay, Paris, France
Giuseppe Valenzise, Laboratoire des Signaux et Syst `emes (L2S, UMR 8506), CNRS - CentraleSup ´elec - Universit ´e Paris-Sud, 91192 Gif-sur-Yvette, France
Kurt Debattista, WMG, University of Warwick, Coventry, UK
Fr ´ed ´eric Dufaux, Laboratoire des Signaux et Syst `emes (L2S, UMR 8506), CNRS - CentraleSup ´elec - Universit ´e Paris-Sud, 91192 Gif-sur-Yvette, France
Abstract
High dynamic range (HDR) imaging has become an impor-tant topic in both academic and industrial domains. Nevertheless, the concept of dynamic range (DR), which underpins HDR, and the way it is measured are still not clearly understood. The cur-rent approach to measure DR results in a poor correlation with perceptual scores (r≈ 0.6). In this paper, we analyze the limi-tations of the existing DR measure, and propose several options to predict more accurately subjective DR judgments. Compared to the traditional DR estimates, the proposed measures show sig-nificant improvements in Spearman’s and Pearson’s correlations with subjective data (up to r≈ 0.9). Despite their straightforward nature, these improvements are particularly evident in specific cases, where the scores obtained by using the classical measure have the highest error compared to the perceptual mean opinion score.
Introduction
High dynamic range (HDR) imaging allows for capture, stor-age, processing and display of real-world content with a high range of luminance, and has potential impact on a wide variety of applications [1, 2]. The correct computation of dynamic range (DR) is important for HDR content selection in the use of algo-rithmic and metric validation [3, 4] as well as for image aesthetic evaluation [5].
In this paper, DR metrics for HDR content selection is the primary concern. While measuring DR of a scene seems trivial, and is usually done by finding a ratio between the highest and lowest luminance value, it is error prone and may not correspond to what humans perceive. This is mainly due to image noise or to the presence of (typically few) extreme luminance values that skew the results while having little or no impact on the observer’s perception of DR. To avoid this, the ratio is usually calculated robustly, discarding a tiny percentage of the darkest and brightest pixels. However, there is no standardized way of performing this, i.e. various percentiles are used along with the clipping of extreme luminance values. While this usually improves the results and is a better predictor of the DR, there are many cases where it fails to provide accurate results. This is due to the complexity of the human visual system, and to the multi-dimensional nature of the perception of the DR attribute [6].
In this work, we consider a number of simple enhancements, of different computational complexity, over the classical DR mea-sure. The considered measures can be broadly classified into two
groups, as shown in Figure 1: i) robust DR computation; and ii) methods that consider the spatial characteristics of DR percep-tion, as well as its intrinsic multiscale nature. In order to vali-date the accuracy of these improved DR measures, we correlate their predictions on 36 HDR images with the corresponding per-ceptual DR scores, gathered through a subjective experiment in which observers had to gauge the perceived overall impression of the difference between the brightest and darkest part(s) of an HDR image [7]. The results show that significant improvements can be achieved at a very low computational overhead with respect to the classical DR measure.
The main contribution of this paper is a systematic inves-tigation and comparison of different approaches for calculating the DR, and a discussion on the possible implications when using them. To the authors’ knowledge, there has not been any pre-vious study comparing computational approaches to measure the perceived dynamic range. Furthermore, we single out and discuss specific cases where the classical DR measure fails, and show how prediction errors for those cases can be substantially reduced us-ing low-cost and more robust DR computation approaches.
Data Set and Procedures
Test images and subjective ground-truth
In this study, a set of 36 luminance-only HDR images was used. All pictures have HD resolution (1920 × 1080 pixels). In the subjective study by Hulusic et al. [7], an associated mean opinion score (MOS), describing its perceived dynamic range, was obtained for each image. 20 participants observed pictures on a SIM2 HDR47 display [8] and were asked to evaluate the overall impression of the difference between the brightest and the darkest part(s) of the observed image. The images in the data set were selected based on the variability in the three objective mea-sures: pixel-based DR, image key (IK) [9] and spatial information (SI)[10]. Details are available in the original paper [7].
Dynamic Range Measures
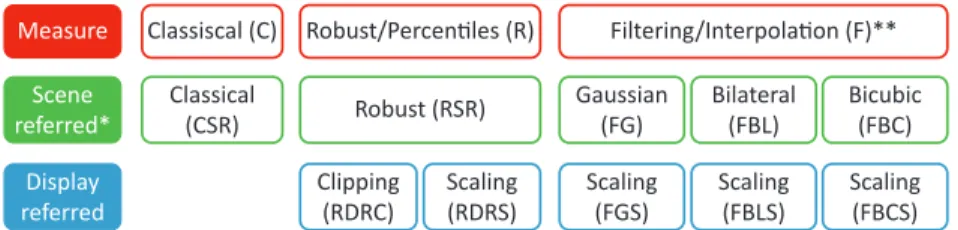
In order to systematically investigate different aspects of DR, we considered three kinds of measurements: classical (C) calculation; robust (R) calculation using percentiles; and filter-ing/interpolation (F). Several DR measures have been formulated by combining principles from these three families, as shown in Figure 1. These approaches are described in detail in the follow-ing paragraphs.
Filtering/Interpolation (F)** Robust/Percentiles (R) Robust (RSR) Scaling (FBCS) Scaling (FBLS) Scaling (FGS) Bicubic (FBC) Bilateral (FBL) Gaussian (FG) Classical (CSR) Display referred Scene referred* Classiscal (C) Measure Scaling (RDRS) Clipping (RDRC)
Figure 1: Measures used in the study. *Due to existence of zero values in many images, even the scene referred images were clipped to 10−5at the low end. **All filtering/interpolation was done on thelog10encoded values.
Classical Approach (C)
The first category uses the ratio between the maximum and minimum luminance value in the image:
DR= log10(Lmax/Lmin). (1)
This method is know to be very sensitive to extreme values. In addition, images with completely black pixels result in infinite DR, which was the case in 19 out of 36 images. Therefore, pixel values in all the images were clipped to 10−5cd/m2during
pre-processing.
Robust Calculation Using Percentiles (R)
The dynamic range of the images in the second category is computed using (1), where Lminand Lmaxwere the minimum and
maximum relative luminance values of the image, respectively, computed after excluding a given percentage of the darkest and brightest pixels. The low and high percentage values used for robust calculations are: 0.1%, 0.5%, 1%, 2%, 3%, 5% and 10%, presented as α and β indices respectively next to the abbreviated name of the measure.
These calculations are performed on both scene-referred (RSRα ,β) and displayed-referred pixel values. The former as-sumes HDR images with real-world luminance values1, while the latter uses luminance values within the range of the display.
Furthermore, display-referred images can be obtained either by clipping (RDRCα ,β) the HDR scene-referred luminance I to the display luminance range [Imin, Imax], using
I0= min(max(I, Imin), Imax); (2)
or scaling (RDRSα ,β) HDR luminance values to the display lu-minance range, such that
I0= I− min(I)
max(I) − min(I)· (Imax− Imin) + Imin, (3) where Imin= 0.03 cd/m2and Imax= 4250 cd/m2in this paper.
Image Filtering and Multiscale Representations (F)
In order to take into account the possible effects of surface in the perception of lightness and dynamic range [6], we compute dynamic range on low-frequency and multiscale representations of the image. This approach is supposed to reduce the impact of small image regions with extreme luminance values in the pre-diction of perceived DR. We consider three low-pass filtering ap-proaches, calculated both on scene-referred images, and display-referred images after scaling. In each approach, DR is calculated
1In order to prevent singularities, pixel values were clipped as in the
classical approach.
for each combination within the predefined range of the clipped percentiles of luminance values, pyramid levels and spatial and range parameters for bilateral filtering. However, only the binations and their corresponding parameters, for which the com-puted DR had the highest correlations with the MOS values, are reported in the paper.
Gaussian Pyramid This is a classical multiscale construc-tion [11] that consists in decimating an image using a Gaussian filter. Specifically, the original N × M pixels image I0 is
con-volved with a 5 × 5 Gaussian filter, and the low-pass filtered result is downsampled by a factor of 2, yielding and N/2 × M/2 image I1. The downsampling here is used to reduce the computational
complexity of the filtering at higher levels of the pyramid, while it does not affect the spectra of filtered images. This procedure can be repeated recursively to produce an image pyramid, where im-age IJat level J has a size N/2J× M/2J. In this paper we consider
1 ≤ J ≤ 7.
Polynomial interpolation We also build an image pyramid rep-resentation using a polynomial interpolation kernel instead of a Gaussian as low-pass filter. We consider polynomial kernels of degree 1, 2 or 3, i.e., bilinear, biquadratic and bicubic interpo-lation. Due to space constraints, we report only the results with bicubic interpolation, which was the one giving the best perfor-mance in our experiments.
Bilateral Filter In this case, the filtered image in the pyramid is obtained as:
If iltered(x) = 1 Wpx
∑
i∈Ω
I(xi) fθ(kI(xi) − I(x)k)gσ(kxi− xk) (4)
where fθ and gσ are two Gaussian kernels of variance θ and σ ,
respectively; Ω is a neighborhood of pixel x and Wpis a
normal-ization constant [12]. As opposed to Gaussian filtering, the bilat-eral filter does not smooth out edges.
Results and Analysis
The scores for all tested measures were calculated in MAT-LAB R2014b. The Spearman’s and Pearson’s correlation along with the `2-error between the obtained results and the MOS for
the dataset were investigated. Spearmans rsand Pearson’s r both
range between 0 (no correlation) and 1 (complete agreement be-tween tested values). The former is automatically calculated on ranks, while the latter uses actual values and thus depicts the lin-ear relationship between variables. The `2-error is the `2 norm
Table 1: Spearman’s rs and Pearson’s r coefficients and `2-error for different measures (Figure 1). Only the configurations with the
best empirically found parameters are reported. In DRα ,β, the indices denote the lowest and highest percentiles of luminance values that have been clipped. In general, β = 1 − α, unless the∗is used, which denotes the optimal combination found over the Cartesian product of β and α. J is the Gaussian or polynomial pyramid level. θ and σ are the range and spatial variances of the bilateral filter.
Irange= max(I) − min(I) is the range of the (possibly scaled/clipped) HDR image.
CSR RSR2, 98 RDRC2, 98 RDRS1, 99 RDRS∗3, 99.5 FG2, 98 (J = 4) FGS0.1, 99.9 (J = 3) FBL2, 98 (σ = 11 θ = Irange/6 J= 1) FBLS1, 99 (σ = 11 θ = Irange/6 J= 1) FBC2, 98 (J = 6) FBCS0.1, 99.9 (J = 3) rs 0.652 0.820 0.823 0.868 0.895 0.827 0.869 0.815 0.859 0.833 0.871 r 0.614 0.661 0.825 0.863 0.887 0.659 0.874 0.658 0.868 0.659 0.869 `2-error 28.790 25.736 16.321 17.529 14.742 23.634 15.492 26.646 15.639 26.487 16.175
serves to give a measure of distance from the prediction to the ground truth data. Before calculating the `2-error, the calculated
DR values were scaled to the MOS range. A summary of the results with the best combination of parameters for different mea-sures and their corresponding rs, r and `2-error values are
pre-sented in Table 1.
Improvement Over Classical DR Measure
From the results in Table 1, it is apparent that the predic-tion accuracy and monotonicity of the CSR measure (rs= .652
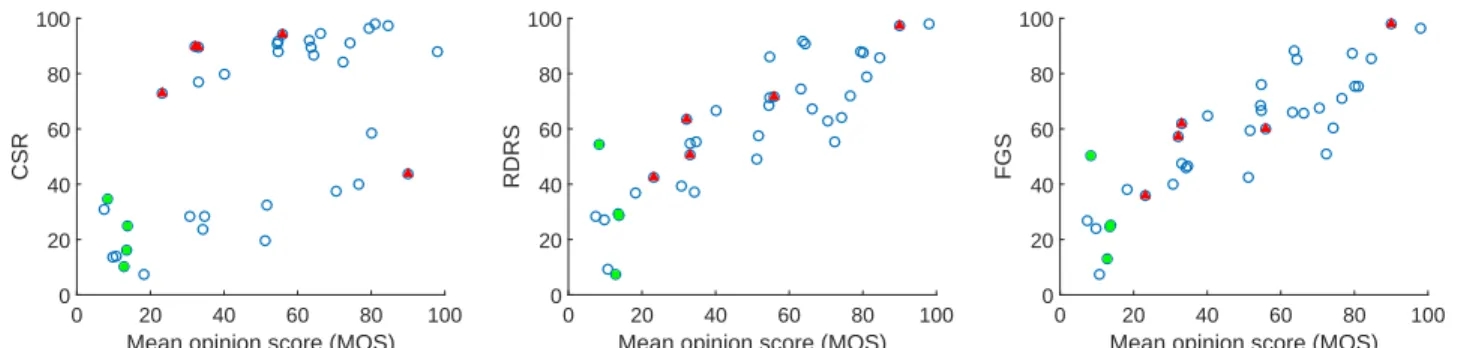
and r = .614) can be substantially improved using both robust ap-proaches based on removal of extreme luminance or multiscale computation. This can be seen graphically by looking at the scat-ter plots in Figure 2, where all metrics have been scaled accord-ingly to MOS range to make meaningful comparisons.
In order to check for the significance of the improvement of the measures, a test for significance of the difference between Spearman’s correlation coefficients of the robust (R) and filtering (F) measures against the CSR was performed, using the Fisher ztransformation [13]. A significant improvement of the RDRS (p = .013), RDRS∗(p = .003), FGS (p = .013), FBLS (p = .019), FBC (p = .045) and FBCS (p = .012) measures over the CSR was found.
Interestingly, the RDRS∗ measure, i.e., the RDRS with the optimal combination of lower and higher percentiles, is the best performing method with the three performance indicators. Simi-lar results can be obtained if the same principle of removing ex-treme values is applied to the filtered images. The test of signif-icance of the difference between Spearman’s correlation
coeffi-cients for these two or any other combination of robust (R) and filtering (F) measures showed no substantial difference (p > .05), i.e., the simplest percentile clipping gives similar results with no significant difference, compared to the relatively more computa-tionally expensive filtering techniques.
Another interesting conclusion can be drawn by observing that display-referred measures are systematically more accurate than scene-referred ones. A significant difference of Pearson’s co-efficients has been found between the RSR and RDRS (p = .019), FG and FGS (p = .012), FBL and FBLS (p = .015) and FBC and FBCS (p = .014). This is somehow expected, as the subjective ground truth has been collected on an HDR display which comes with physical limitations in the actual range of possible emitted luminance.
Dynamic Range Prediction Failures
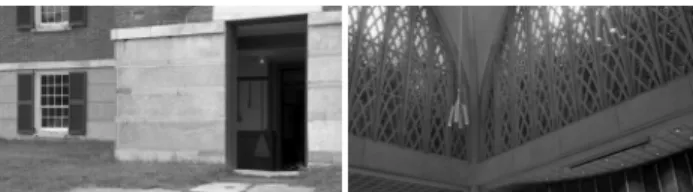
In order to analyze specific cases where the classical DR computation fails, five images from the dataset with the highest prediction error were singled out and displayed as red triangles in Figure 2. Two of these images are displayed in Figure 3, while the normalized DR predictions for the five pictures with different measures, as well as their MOS values, are reported in Table 2. Those cases mainly correspond to images where the distribution of highlights is concentrated in small or tiny regions, whose sur-face is too small to generate a significant perceptual response in the human visual system. The scatter plots (Figure 2) for the RDRS and FGS methods show that those cases are correctly han-dled by these measures.
There are also some cases where the robust DR computation
Mean opinion score (MOS)
0 20 40 60 80 100 CSR 0 20 40 60 80 100
Mean opinion score (MOS)
0 20 40 60 80 100 RDRS 0 20 40 60 80 100
Mean opinion score (MOS)
0 20 40 60 80 100 FGS 0 20 40 60 80 100
Figure 2: Comparison of the three measures: CSR(left), RDRS(middle) and FGS(right). The red triangles represent the extreme cases with the highest difference between the CSR and MOS scores (see Table 2). The green squares show the examples where the DR predictions result in higher error compared to CSR (see Table 3).
Figure 3: Two extreme case images: HannockKitchenOutside (CSR=89.837; MOS=32.200)(left) contains a light bulb with a very bright but very small area; and URChapel(2) middle (CSR=89.548; MOS=33.150)(right) which contains many very small areas with extremely low pixel values.
Table 2: Extreme cases where the difference between the CSR and MOS were the highest, showing the improvement of the scores in tested measures. All computed scores are scaled to MOS range.
Image name CSR RDRS FGS FBLS∗ MOS
Flamingo 94.082 71.487 59.899 66.386 56.00 HancockKitchenOut 89.837 63.351 57.322 41.300 32.20 HdrMark 43.638 97.406 98.100 84.187 89.90 NorthBubble 72.899 42.584 35.775 32.438 23.25 URChapel(2) m 89.548 50.557 61.931 55.572 33.15 `2-error 50.116 19.715 18.432 12.731
does increase the prediction error, as illustrated in Figure 2 by green squares and reported in Table 3. By conducting a further investigation, it was found that the images with the lowest MOS scores are the most error-prone with the robust measures. How-ever, the prediction error in this range of MOS is relatively low compared to the extreme cases found at higher DR, where CSR error can be extremely high and more misleading in practice.
Conclusions
Accurately and consistently calculating DR of HDR images and its relation to the HVS is still an unresolved problem. There are some common procedures, generally accepted in the HDR community, but these, to the best of authors’ knowledge, have never been validated.
In this paper, the scores obtained from different DR mea-sures, including classical calculation (CSR) of the ratio between the maximum and minimum values, robust computation using percentiles, and methods based on filtering and multiscale rep-resentations were systematically compared with the perceived DR (measured by MOS). The Spearman’s and Pearson’s corre-lations with the MOS were computed, along with the predic-tion error. The results show that the robust measures can sig-Table 3: Images where the scores obtained by the tested measures are worse than CSR. All the images are the ones with the lowest MOS scores in the dataset. All computed scores are scaled to MOS range.
Image name CSR RDRS FGS FBLS* MOS
DelicateFlowers 16.095 29.445 24.539 21.128 13.55
OCanadaNoLights b 34.720 54.362 50.281 41.967 8.35
TupperLake(1) 10.225 7.400 13.047 7.400 12.85
URChapel(2) b 24.823 28.531 25.248 27.325 13.75
`2-error 12.895 22.882 20.056 16.742
nificantly improve over the CSR measure. Interestingly, all these methods achieve comparable performance, although at a different computational complexity, which leans toward adopting simple percentile-based clipping in practical applications.
The reason why those measures can better describe the per-ceived DR is mainly found in the characteristics of the con-tent, and especially in the fact that very small but bright regions, which are taken into account in CSR computation, are not suffi-ciently extended to stimulate an equivalent response in the HVS. Nonetheless, it is hard to make final conclusions that apply to all the images, due to the complexity and multidimensionality of the perception of the DR attribute.
While more advanced studies are necessary in order to build a comprehensive model that will work on any image, this study shows that simple adjustments of the basic CSR measure are al-ready able to substantially increase the accuracy of DR computa-tion, without the need to resort to sophisticated and application-specific techniques as in [3].
In the future, we plan to further investigate this phenomenon by focusing on extreme cases that have the highest variance across measures. We will also take into account other features, such as area or distance between the peak values in the image, in a more comprehensive way and embedding explicitly well-known psy-chophysical laws.
References
[1] Francesco Banterle, Alessandro Artusi, Kurt Debattista, and Alan Chalmers. Advanced high dynamic range imaging: theory and prac-tice. CRC Press, 2011.
[2] Fr´ed´eric Dufaux, Patrick Le Callet, Rafal Mantiuk, and Marta Mrak. High Dynamic Range Video. From Acquisition, to Display and Ap-plications. Academic Press, 2016.
[3] Manish Narwaria, Claire Mantel, Matthieu Perreira Da Silva, Patrick Le Callet, and Soren Forchhammer. An objective method for high dynamic range source content selection. In Quality of Mul-timedia Experience (QoMEX), 2014 Sixth International Workshop on, pages 13–18. IEEE, 2014.
[4] Allan G Rempel, Matthew Trentacoste, Helge Seetzen, H David Young, Wolfgang Heidrich, Lorne Whitehead, and Greg Ward. Ldr2hdr: on-the-fly reverse tone mapping of legacy video and pho-tographs. In ACM Transactions on Graphics (TOG), volume 26, page 39. ACM, 2007.
[5] Tunc Ozan Aydin, Aljoscha Smolic, and Markus Gross. Automated aesthetic analysis of photographic images. Visualization and Com-puter Graphics, IEEE Transactions on, 21(1):31–42, 2015. [6] Alan Gilchrist, Christos Kossyfidis, Frederick Bonato, Tiziano
Agostini, Joseph Cataliotti, Xiaojun Li, Branka Spehar, Vidal An-nan, and Elias Economou. An anchoring theory of lightness percep-tion. Psychological review, 106(4):795, 1999.
[7] Vedad Hulusic, Giuseppe Valenzise, Edoardo Provenzi, Kurt Debat-tista, and Frederic Dufaux. Perceived dynamic range of hdr images. In Proceedings 8th International Workshop on Quality of Multime-dia Experience (QoMEX2016). IEEE, 2016.
[8] SIM2. http://www.sim2.com/hdr/, June 2014.
[9] Ahmet O˘guz Aky¨uz and Erik Reinhard. Color appearance in high-dynamic-range imaging. Journal of Electronic Imaging, 15(3):033001–033001, 2006.
[10] Giuseppe Valenzise, Francesca De Simone, Paul Lauga, and Fred-eric Dufaux. Performance evaluation of objective quality metrics
for hdr image compression. In SPIE Optical Engineering+ Applica-tions, pages 92170C–92170C. International Society for Optics and Photonics, 2014.
[11] Peter J. Burt and Edward H. Adelson. The laplacian pyramid as a compact image code. IEEE Transactions on Communications, 31(4):532–540, 1983.
[12] Carlo Tomasi and Roberto Manduchi. Bilateral filtering for gray and color images. In 6-th International Conference on Computer Vision, pages 839–846. IEEE, 1998.
[13] Ronald A Fisher. Frequency distribution of the values of the corre-lation coefficient in samples from an indefinitely large popucorre-lation. Biometrika, 10(4):507–521, 1915.
Author Biography
Vedad Hulusi´c is a post-doctoral researcher at Mines-T´el´ecom In-stitute in Paris, France. He worked as an Assistant Professor at the Uni-versity Sarajevo School of Science and Technology, Bosnia and Herzegov-ina. He has a PhD in Engineering from the University of Warwick, UK. He has a long-standing interest in the computer graphics, high dynamic range imaging, image and video quality assessment, visual perception and attention, and cross-modal interaction in which he has been a published author.