Université de Montréal
Deciphering causal genetic determinants of red blood cell
traits
par Samuel Lessard
Sciences biomédicales Faculté de Médecine
Thèse présentée
en vue de l’obtention du grade de doctorat en sciences biomédicales
4 avril 2017
Résumé
Les études d’association pan-génomiques ont révélé plusieurs variants génétiques associés à des traits complexes. Les mesures érythrocytaires ont souvent fait l’objet de ce genre d’études, étant mesurées de façon routinière et précise. Comprendre comment les variations génétiques influencent ces phénotypes est primordial étant donné leur importance comme marqueurs cliniques et leur influence sur la sévérité de plusieurs maladies. En particulier, des niveaux élevés d’hémoglobine fœtal chez les patients atteints d’anémie falciforme est associé à une réduction des complications et une augmentation de l’espérance de vie. Néanmoins, la majorité des variants génétiques identifiés par ces études tombent à l’intérieur de régions génétiques non-codantes, augmentant la difficulté d’identifier des gènes causaux.
L’objectif premier de ce projet est l’identification et la caractérisation de gènes influençant les traits complexes, et tout particulièrement les traits sanguins. Pour y arriver, j’ai tout d’abord développé une méthode permettant d’identifier et de tester l’effet de gènes knockouts sur les traits anthropométriques. Malgré un échantillon de grande taille, cette approche n’a révélé aucune association. Ensuite, j’ai caractérisé le méthylome et le transcriptome d’érythroblastes différentiés à partir de cellules souches hématopoïétiques et identifié plusieurs gènes potentiellement impliqués dans les programmes érythroïdes fœtaux et adultes. Par ailleurs, j’ai identifié plusieurs micro-ARNs montrant des motifs d’expression spécifiques entre les stages fœtaux et adultes et qui sont enrichis pour des cibles exprimées de façon opposée. Finalement, j’ai identifié plusieurs variants génétiques associés à l’expression de gènes dans les érythroblastes (eQTL). Cette étude a permis d’identifier des variants associés à l’expression du gène ATP2B4, qui encode le principal transporteur de calcium des érythrocytes. Ces variants, qui sont également associés à des traits sanguins et à la susceptibilité à la malaria, tombent dans un élément d’ADN spécifique aux cellules érythroïdes. La délétion de cet élément par le système CRISPR/Cas9 induit une forte diminution de l’expression du gène et une augmentation des niveaux de calcium intracellulaires.
En conclusion, des échantillons de génotypages exhaustifs seront nécessaires pour étudier l’effet de gènes knockouts sur les traits complexes. Les érythroblastes montrent de grandes différences au niveau de leur méthylome et transcriptome entre les différents stages développementaux. Ces différences influencent potentiellement la régulation de l’hémoglobine fœtale et impliquent de nombreux micro-ARNs et régions régulatrices non-codantes. Finalement, l’exemple d’ATP2B4 montre qu’intégrer des études épigénomiques, transcriptomiques et des expériences d’édition de génome est une approche puissante pour caractériser des variants génétiques non-codants. Par ailleurs, ces résultats impliquent ATP2B4 dans l’hydratation des érythroblastes, qui est associé à la susceptibilité à la malaria et la sévérité de l’anémie falciforme. Cibler ATP2B4 de façon thérapeutique pourrait avoir un impact majeur sur ces maladies qui affectent des millions d’individus à travers le monde.
Mots-clés : Anémie falciforme, mesures érythrocytaires, études d’association pan-génomiques, édition de génome, malaria
Abstract
Genome-wide association studies (GWAS) have revealed several genetic variants associated with complex phenotypes. This is the case for red blood cell (RBC) traits, which are particularly amenable to GWAS as they are routinely and accurately measured. Understanding RBC trait variation is important given their significance as clinical markers and modifiers of disease severity. Notably, increased fetal hemoglobin (HbF) production in sickle cell disease (SCD) patients is associated with a higher life expectancy and decreased morbidity. Nonetheless, most variants identified through GWAS fall in non-coding regions of the human genome, increasing the difficulty of identifying causal links.
The main goal of this project was to identify and characterize genes influencing complex traits, and in particular RBC phenotypes. First, I developed an approach to identify and test potential gene knockouts affecting anthropometric traits in a large sample from the general population, which did not yield significant associations. Then, I characterized the DNA methylome and transcriptome of erythroblasts differentiated ex vivo from hematopoietic progenitor stem cells (HPSC), and identified several genes potentially implicated in fetal and adult-stage erythroid programs. I also identified microRNAs (miRNA) that show specific developmental expression patterns and that are enriched in inversely expressed targets. Finally, I mapped expression quantitative trait loci (eQTL) in erythroblasts, and identify erythroid-specific eQTLs for ATP2B4, the main calcium ATPase of RBCs. These genetic variants are associated with RBC traits and malaria susceptibly, and overlap an erythroid-specific enhancer of ATP2B4. Deletion of this regulatory element using CRISPR/Cas9 experiments in human erythroid cells minimized ATP2B4 expression and increased intracellular calcium levels.
In conclusion, large and comprehensive genotyping datasets will be necessary to test the role of rare gene knockouts on complex phenotypes. The transcriptomes and DNA methylomes of erythroblasts show substantial differences correlating with their developmental stages and that may be implicated in HbF production. These results also suggest a strong implication of erythroid enhancers and miRNAs in developmental stage specificity. Finally, characterizing the erythroid-specific enhancer of ATP2B4 suggest that integrating epigenomic, transcriptomic and
gene editing experiments can be a powerful approach to characterize non-coding genetic variants. These results implicate ATP2B4 in erythroid cell hydration, which is associated with malaria susceptibility and SCD severity, suggesting that therapies targeting this gene could impact diseases affecting millions of individuals worldwide.
Keywords: Sickle cell disease, red blood cell traits, genome-wide association studies, genome editing, malaria susceptibility
Table of Contents
Résumé ... 1 Abstract... 3 Table of Contents ... 5 List of tables ... 11 List of figures ... 13List of Abbreviations and Acronyms ... 17
Acknowledgements ... 21
Chapter 1: Introduction ... 23
1.1 Introduction ... 24
1.2 Complex trait genetics ... 25
1.2.1 Genome-wide associations studies ... 26
1.2.2 Heritability ... 28
1.2.3 Missing heritability ... 29
1.3 Red blood cell traits ... 30
1.3.1 Erythropoiesis and hemoglobin synthesis ... 32
1.3.2 Diseases related to red blood cell traits ... 36
1.3.3 Malaria ... 37
1.3.4 Sickle cell disease ... 40
1.3.5 Modifiers of β-hemoglobinopathy severity ... 42
1.4 Identifying causal genes influencing human complex phenotypes by omics approaches ... 45
1.4.1 Coding variants ... 45
1.4.2 Epigenomics ... 48
1.4.3 Transcriptomics ... 53
1.5 Validating causal genes using genome editing... 57
1.5.1 Genome editing... 57
1.5.2 The CRISPR/Cas9 system ... 59
1.5.3 Using genome editing to identify causal loci ... 60
Chapter 2: Testing the Role of Predicted Gene Knockouts in Human Anthropometric Trait Variation ... 65 2.1 Context ... 66 2.2 Abstract ... 66 2.3 Introduction ... 67 2.4 Results ... 69
2.4.1 Number and distribution of predicted gene KOs in ESP ... 69
2.4.2 Predicted gene KO associated with anthropometric traits in ESP ... 70
2.4.3 Gene KO identification and association testing using exome array data... 72
2.4.4 Prioritizing gene KOs using a candidate-gene approach ... 72
2.5 Discussion ... 81
2.6 Materials and methods ... 82
2.6.1 Ethics statement ... 82
2.6.2 NHLBI Exome Sequence Project (ESP) ... 83
2.6.3 Variant quality-control and annotation ... 83
2.6.4 Replication cohorts with WGS or WES data available ... 84
2.6.5 GIANT Consortium ExomeChip datasets ... 84
2.6.6 Statistical analyses ... 85
2.6.7 Association of rare predicted gene KOs with anthropometric traits... 85
2.6.8 Candidate-gene enrichment analyses ... 86
2.7 Acknowledgements ... 87
2.8 Supplementary information... 88
Chapter 3: Comparison of DNA methylation profiles in human fetal and adult red blood cell progenitors ... 97
3.1 Context ... Error! Bookmark not defined. 3.2 Abstract ... 98
3.3 Background ... 100
3.4 Methods ... 102
3.4.4 Enrichment analyses ... 104
3.4.5 DNA genotyping and association studies ... 104
3.5 Results and discussion ... 105
3.5.1 Ex vivo culture of erythroid progenitor cells ... 105
3.5.2 The DNA methylation landscape in human erythroblasts ... 106
3.5.3 Differential DNA methylation between fetal and adult erythroblasts ... 107
3.5.4 Erythroid enhancers are enriched for differentially methylated CpGs ... 108
3.5.5 Several transcription factor binding motifs are preferentially located near differentially methylated CpGs ... 110
3.5.6 DNA methylation and genetic variation control HBG2 expression ... 111
3.6 Conclusions ... 119
3.7 Acknowlegdments ... 120
3.8 Supplementary information ... 121
Chapter 4: RNA-sequencing of ex vivo differentiated erythroblasts reveal novel genes and miRNAs associated with fetal and adult erythroid developmental stages ... 130
4.1 Context ... 131
4.2 Abstract ... 131
4.3 Introduction ... 132
4.4 Material and methods ... 134
4.4.1 Transcript differential expression analysis ... 134
4.4.2 miRNA differential expression analysis ... 134
4.4.3 Enrichment analyses ... 135
4.4.4 miRNA reverse-transcription quantitative PCR validation... 135
4.5 Results and discussion ... 136
4.5.1 Gene differential expression recapitulates the fetal-to-adult hemoglobin switch .. 136
4.5.2 The 14q32 miRNA cluster is up-regulated in fetal erythroblasts ... 139
4.5.3 Integration of miRNA and mRNA expression data ... 140
4.6 Conclusions ... 144
4.7 Acknowledgments ... 144
Chapter 5: An erythroid-specific enhancer of ATP2B4 mediates red blood cell hydration and malaria susceptibility... 147 5.1 Context ... 148 5.2 Abstract ... 148 5.3 Introduction ... 149 5.4 Results ... 149
5.4.1 eQTL mapping in erythroblasts identifies novel cell-specific associations with gene expression ... 149
5.4.2 ATP2B4 eQTLs and RBC traits ... 151
5.4.3 An erythroid-specific regulatory element is required for ATP2B4 expression... 154
5.5 Discussion ... 157
5.6 Methods ... 159
5.6.1 Cell culture, RNA-sequencing and DNA genotyping ... 159
5.6.2 Allelic imbalance and eQTL mapping ... 160
5.6.3 Replication of eQTLs in GTEx ... 161
5.6.4 eQTL enrichment analyses ... 161
5.6.5 Red blood cell traits analyses in Atp2b4-/- mice ... 162
5.6.6 Replication of the association between ATP2B4 and RBC phenotypes in the UK Biobank ... 162
5.6.7 Generating ATP2B4 deletions in cell lines ... 163
5.6.8 Reverse transcription-quantitative PCR ... 164
5.6.9 Intracellular calcium monitoring ... 164
5.7 Acknowledgments ... 165
5.8 Supplementary information ... 166
Chapter 6: Discussion... 175
6.1 Implications ... 176
6.1.1 Characterization of red blood cell trait GWAS loci ... 177
6.1.2 Modulation of HbF production ... 178
6.2.1 GWAS of RBC traits ... 182
6.2.2 GWAS of HbF ... 184
6.2.3 Integration with large-scale transcriptomic and epigenomic data ... 185
6.3 Future applications of genome editing ... 185
6.3.1 Modifications and applications of CRISPR/Cas9 ... 186
6.3.2 Large-scale characterization of genes and regulatory elements ... 187
6.4 Treatments of RBC disorders ... 189
6.4.1 Promising therapies to treat sickle cell disease ... 189
6.4.2 Malaria – therapies from human genetics ... 190
6.5 Conclusions ... 192
References ... i
Annex 1: An erythroid enhancer of BCL11A subject to genetic variation determines fetal hemoglobin level ... xxix
Abstract ... xxix
Main text ... xxx
Material and methods ... xxxvi Acknowledgments ... xliii Annex 2: Variant-aware saturating mutagenesis using multiple Cas9 nucleases identifies regulatory elements at trait-associated loci ...xliv
Abstract ... xlv Introduction ... xlv Results ...xlvi Discussion ... lxi Methods ... lxii Acknowledgments ... lxxiv Annex 3: Exome genotyping identifies pleiotropic variants associated with red blood cell traits ... lxxv Abstract ... lxxv Introduction ... lxxvi Subjects and methods ... lxxviii Results ... lxxxi
Discussion ... xci Acknowledgments ... xciv
List of tables
Chapter 1
Table 1. Red blood cell traits and examples of related conditions ... 33 Chapter 2
Table 1. Number and frequency of predicted gene knockouts (KO) in 1,727 African Americans and 2,772 European Americans from the NHLBI Exome Sequence Project (ESP) ...
... 74 Table 2. Association of gene knockouts (KOs) with anthropometric traits in the Exome Sequence Project (ESP) and Montreal Heart Institute (MHI) Biobank DNA sequencing datasets.
... 75 Table 3. Top association results between anthropometric traits and predicted gene knockouts (KOs) identified using ExomeChip data from 22 studies participating in the GIANT Consortium. ... 76 Table S1. Descriptive statistics for the different studies analyzed in this project. ... 89 Table S2. Number and frequency of predicted gene knockouts (KOs) in 1,785 African Americans and 2,896 European Americans from the NHLBI Exome Sequence Project (ESP) ...
... 90 Chapter 3
Table 1. Enrichment of transcription factor binding sites (TFBS) near differentially methylated CpGs. ... 113 Table 2. Genetic and epigenetic control of HBG2 / HBB expression in adult erythroblasts .. ... 114 Table S1. List of primers used for quantitative PCR analyses. ... 128 Table S2. Pathway clusters enriched in differentially methylated genes ... 129 Chapter 4
Table 1. Top miRNAs enriched for differentially expressed genes ... 138 Table 2. Genes significantly targeted by DE miRNAs ... 143 Table S1. KEGG pathways enriched in genes up-regulated in fetal or adult erythroblasts. 145
Chapter 5
Table S1. Top gene ontology terms and mouse phenotypes significantly enriched among erythroblast eGenes. ... 172 Table S2. Comparison of the association of the rs7551442 A-allele with red blood cell (RBC) traits in the first release of the UK Biobank and effect of the Atp2b4 targeted deletion on RBC phenotypes in mice. ... 173 Table S3. Single guide RNA design. ... 174 Table S4. qPCR design. ... 174 Annex 3
Table 1. Association results of variants in novel loci associated with red blood cell (RBC) traits. ... lxxxiv Table 2. Gene-based association results ... lxxxix Table 3. Overlap of red blood cell (RBC) markers with other blood cell traits and/or lipids . ... xc
List of figures
Chapter 1
Figure 1. Genetic variants associated with traits in genome-wide association studies
(GWAS). ... 27
Figure 2. Switch of hemoglobin β-chains ... 34
Figure 3. Stages of erythroid differentiation. ... 35
Figure 4. Life cycle of malaria parasites. ... 38
Figure 5. Hemoglobin production and sickle cell disease. ... 41
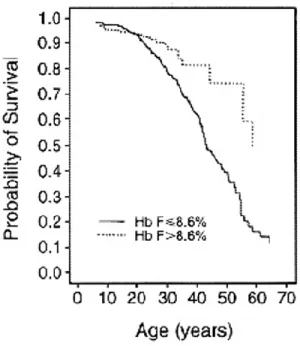
Figure 6. Survival of sickle cell disease patients in the cooperative study of sickle cell disease (CSSCD) ... 43
Figure 7. Epigenetic modifications ... 51
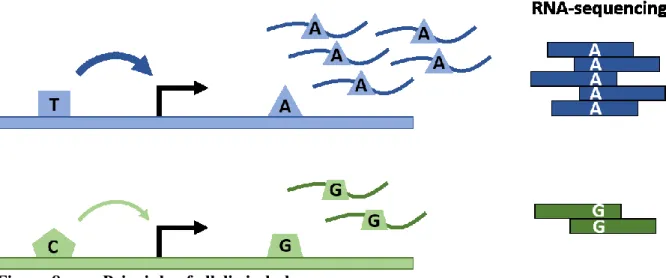
Figure 8. Principle of allelic imbalance ... 56
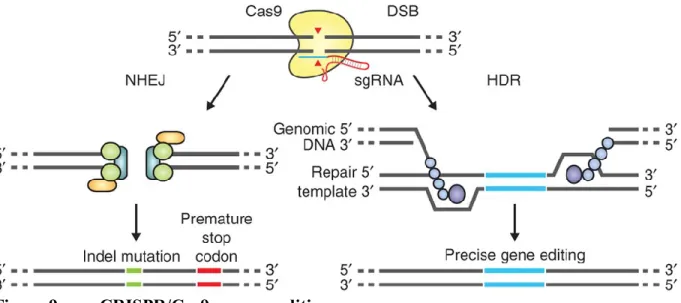
Figure 9. CRISPR/Cas9 genome editing... 57
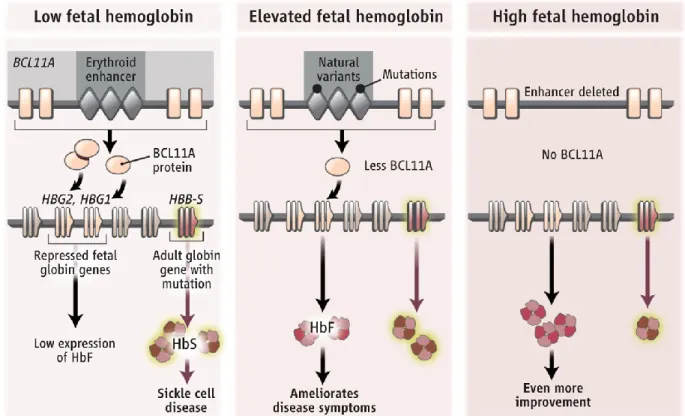
Figure 10. Modulation of BCL11A by genetic variants in an erythroid enhancer ... 61
Figure 11. Role of the FTO rs1421085 variants on obesity. ... 62
Chapter 2 Figure 1. Distributions of the number of NHLBI Exome Sequence Project (ESP) participants with predicted gene knockouts (KOs) ... 77
Figure 2. Schematic representation of the method to detect association between gene knockouts (KOs) and human quantitative variation... 78
Figure 3. Quantile-quantile (QQ) plots of association results between predicted gene knockouts (KOs) and anthropometric traits in the (A–C) NHLBI Exome Sequence Project (ESP) and (D–F) GIANT ExomeChip datasets ... 79
Figure 4. Quantile-quantile (QQ) plots of association results between predicted gene knockouts (KOs) in candidate-genes and anthropometric traits ... 80
Figure S1. Comparison of association P-values using different variant annotations in the ESP dataset for (A) BMI, (B) height, and (C) WHR. ... 91
Figure S2. Number of predicted knockout (KO) genes per NHLBI Exome Sequence Project participant. ... 92
Figure S3. Frequency of KO events in the ESP and GIANT datasets. ... 93
Figure S4. Calibration of our statistical method using the NHLBI Exome Sequence Project (ESP) dataset. ... 94
Figure S5. Quantile-quantile (QQ) plots of association results between predicted gene knockouts (KOs) and anthropometric traits restricted to 30 phenotype categories from the Mouse Genome Informatics (MGI) database in the (A-C) NHLBI Exome Sequence Project (ESP) and (D-F) GIANT ExomeChip datasets. ... 95
Figure S6. Comparison of association P-values using different variant annotations in the ESP dataset for (A) BMI, (B) height, and (C) WHR. ... 96
Chapter 3 Figure 1. Hierarchical clustering analysis of DNA methylation in erythroblasts. ... 115
Figure 2. Differential DNA methylation between fetal liver- and bone marrow-derived erythroblasts. ... 116
Figure 3. Examples of loci differentially methylated between fetal- and adult stage erythroblasts ... 117
Figure 4. Erythroid enhancers are enriched for SNPs associated with fetal hemoglobin (HbF) levels in patients with sickle cell disease. ... 118
Figure S1. Ex vivo differentiation of human CD34+ cells. ... 121
Figure S2. Ex vivo differentiated CD34+ cells exhibit gene expression and hemoglobin production that are characteristic of fetal or adult erythroblasts. ... 122
Figure S3. DNA methylation in the HBG2 (γ-globin) promoter ... 123
Figure S4. RNA expression of cell surface markers during ex vivo differentiation ... 124
Figure S5. DNA methylation data normalization ... 125
Figure S6. Correlations of DNA methylation between samples of our study and samples from the Roadmap Epigenomics Project. ... 126
Figure S7. Relationship between DNA methylation and the expression of GCNT2 isoforms ... 127 Figure S8. Enrichment of positive and negative correlations of DNA methylation and
Chapter 4
Figure 1. Differential expression (DE) of genes between 12 fetal and 12 adult erythroblast
samples. ... 137
Figure 2. Differential expression (DE) of miRNAs between 12 fetal and 12 adult erythroblast samples. ... 140
Figure 3. Validation of DE miRNAs by qPCR. ... 141
Figure 4. miRNA target networks. ... 142
Chapter 5 Figure 1. eQTL mapping in erythroblasts. ... 151
Figure 2. ATP2B4 eQTLs overlap an erythroid-specific regulatory region and are associated with RBC traits. ... 153
Figure 3. Genome editing demonstrates essential sequences at the trait-associated ATP2B4 erythroid enhancer. ... 155
Figure 4. ATP2B4 activity and calcium homeostasis in erythroid cells. ... 158
Figure S1. Erythroblasts eQTL are enriched for RBC trait-associated SNPs. ... 166
Figure S2. Number of shared eQTLs between erythroblasts and GTEx samples. ... 166
Figure S3. Number of eQTLs in GATA1/TAL1 ChIP-seq peaks shared between erythroblasts and GTEx samples. ... 167
Figure S4. Genomic control lambda (λGC) of eQTLs subsetted by erythroid regulatory regions. ... 168
Figure S5. ATP2B4 allelic imbalance in human erythroblasts. ... 169
Figure S6. Erythroblasts show an eQTL signal that is independent from ATP2B4 eQTLs found in GTEx. ... 170
Figure S7. Association of rs7551442 with mean corpuscular hemoglobin concentration (MCHC) in the UK Biobank... 170
Figure S8. Example of ENCODE and Roadmap Epigenomic Consortia DNAse I hypersensitive sites (DHSs) signals at the ATP2B4 locus. ... 171
Annex 1 Figure 1. Chromatin state and TF occupancy at BCL11A... xxxi
Figure 2. Regulatory variants at BCL11A. ... xxxii Figure 3. The GWAS-marked BCL11A enhancer is sufficient for adult-stage erythroid expression. ... xxxiv Figure 4. The GWAS-marked BCL11A enhancer is necessary for erythroid but dispensable for nonerythroid expression. ... xxxv Annex 2
Figure 1. Trait associations of the HBS1L-MYB intergenic region. ... xlvii Figure 2. DNA Striker algorithm...xlix Figure 3. Pooled saturating-mutagenesis screening of the HBS1L-MYB region by using NGG- and NGA Cas9s and variants from 1000 Genomes haplotypes ... li Figure 4. Mapping NGG- and NGA-restricted sgRNA dropout scores to genomic cleavage position identifies putative functional elements ... liv Figure 5. Trait-associated SNPs mark essential enhancer elements ... lvii Figure 6. The HBS1L-MYB intergenic region contains highly repetitive genomic sequences . ...lx Annex 3
Figure 1. Quantile-Quantile (QQ) plots of single variant association results in the all ancestry meta-analyses for the seven red blood cell (RBC) traits analyzed. ...lxxxii Figure 2. CD36 expression in human erythroblasts... lxxxvii Figure 3. Venn diagram summarizing pleiotropic effects for genetic variants associated with red blood cell (RBC) traits... xcii
List of Abbreviations and Acronyms
3C : Chromosome Conformation Capture 5-hmC: 5-hydroxymethylcytosine
5-mC: 5-methylcytosine AI: Allelic imbalance
ATAC-seq: Assay for Transposase-Accessible Chromatin with high throughput sequencing BFU: Burst-forming unit-erythroid
BM: Bone marrow erythroblasts BMI: Body mass index
bp: base pair
cDNA: complementary DNA
CFU: Colony-forming unit-erythroid
ChIA-PET: Chromatin Interaction Analysis by Paired-End Tag Sequencing ChIP-seq: Chromatin immunoprecipitation followed by sequencing
CMP: Common myeloid progenitors CNV: Copy number variant
CpG:Cytosine followed by a guanine
CRISPR: Clustered regularly interspaced short palindromic repeats crRNA: CRISPR RNA
CSSCD: Cooperative study of sickle cell disease CV: Coefficient of variation
dbGaP: database of Genotypes and Phenotypes dCas9: dead Cas9
DE: Differential expression DHS: DNAse hypersensitive site DM: Differential DNA methylation DNA: Deoxyribonucleic acid
DNAse-seq: DNase I hypersensitive sites sequencing DSB: Double strand break
ENCODE: Encyclopedia of DNA Elements EPO: Erythropoietin
EPOR: Erythropoietin receptor
eQTL: Expression quantitative trait loci
eSpCas9: enhanced Streptococcus pyogenes Cas9 ESP: NHLBI Exome Sequence Project
ExAC: Exome Aggregation Consortium
FAIRE-seq: Formaldehyde-Assisted Isolation of Regulatory Elements followed by sequencing FACS: Fluorescence-activated cell sorting
FC: Fold change
FDR: False discovery rate FL: Fetal liver erythroblasts
FPKM: Fragments per Kilobase per million mapped reads GAGE: Generally Applicable Gene-set Enrichment GC: Genomic control
GCTA: Genome-wide Complex Trait Analysis GEO: Gene expression omnibus
GIANT: Genetic Investigation of Anthropometric Traits GO: Gene ontology
GTEx: Genotype-Tissue Expression
GUIDE-Seq: genome-wide, unbiased identification of DSBs enabled by sequencing GWAS: Genome-wide association study
h2: heritability
HbA: Adult hemoglobin HbC: Hemoglobin C HbE: Hemoglobin E HbF: Fetal hemoglobin HBG: Hemoglobin HbS: Sickle hemoglobin HCT: Hematocrit
HDAC: Histone deacetylase HDR: Homolgy directed repair
HF1 : Streptococcus pyogenes Cas9 high-fidelity variant 1
Hi-C : Chromosome Conformation Capture with high- throughput sequencing HMM: Hidden Markov models
HPFH: Hereditary persistence of fetal hemoglobin HPSC: Hematopoietic progenitor stem cells HRC: Haplotype reference consortium HSC: Hematopoietic stem cells
HUDEP-2: human erythroid precursor cell line 2 IBD: Identity by descent
ICF: Immunodeficiency, Centromeric instability and Facial anomalies IHEC: International Human Epigenome Consortium
Indels: Insertion/deletions
IUPAC: International Union of Pure and Applied Chemistry kb: kilobase
KEGG: Kyoto Encyclopedia of Genes and Genomes KO: Knockout
LCR: Locus control region LD: Linkage disequilibrium LoF: Loss-of-function log: logarithm
MAF: Minor allele frequency Mb: Megabase
MCHC: Mean corpuscular hemoglobin concentration MCH: Mean corpuscular hemoglobin
MCV: Mean corpuscular volume MEL: Mouse erythroleukemia cells
MHI: Montreal Heart Institute miR: micro-RNA
miRNAs: micro-RNAs
MNase-seq: Micrococcal nuclease digestion followed by sequencing mRNA: Messenger ribonucleic acid
NCBI: National Center for Biotechnology Information NHEJ: Non-homologous end-joining
NHLBI: National Heart, Lung, and Blood Institute NSAID: Non-steroid anti-inflammatory drugs OMIM: Online Mendelian Inheritance in Man Ortho EB: Orthochromatic erythroblasts PAM: Protospacer adjacent motif PCA: Principal component analysis piRNA: PIWI-interacting RNA
pLI: probability of being loss-of-function intolerant Poly EB: Polychromatic erythroblasts
P: P-value
Pro EB: Proerythroblasts
qPCR: quantitative polymerase chain reaction QQ-plot: Quantile-quantile plot
RBC: Red blood cell
RDW: Red blood cell distribution width REML: Restricted maximum likelihood RETIC: Reticulocyte count
RET: Reticulocytes
RFN: RNA-guided FokI–dCas9 nuclease RNAi: RNA interference
RNA Ribonucleic acid RNA-seq: RNA sequencing ROI: Region of interest
RT-qPCR: Reverse transcription quantitative polymerase chain reaction RVIS: Residual Variation Intolerance Score
SAM: synergistic activation mediator SCD: Sickle cell disease
SCF: Stem cell factor SD: Standard deviation
SEM: Standard error of the mean SE: Standard error
SFEM: serum-free expansion medium sgRNA: single guide RNA
SKAT: Sequence kernel association test snoRNA: small nucleolar RNAs
SNP: Single nucleotide polymorphism SpCas9: Streptococcus pyogenes Cas9 T2D: Type 2 diabetes
TALENS: Transcription Activator-Like Effector Nucleases TALE: Transcription Activator-Like Effector
TFBS: Transcription factor binding site TF: Transcription factor
tracrRNA: trans-activating crRNA μM : microMolar
μL: mircroLiter
UTR: Untranslated region
VEP: Ensembl Variant effect predictor WES: Whole-exome sequencing WGS: Whole-genome sequencing WHR: Waist-hip ratio
WT: Wild type
ZFN: Zinc-finger nuclease ZFP: Zinc-finger protein
Acknowledgements
I would like to start by expressing my utmost gratitude to my supervisor and mentor, Dr Guillaume Lettre, for giving me the opportunity to undertake my PhD degree in his laboratory, and for giving me the opportunity to work on such a vast range of projects. I am sincerely grateful for his support and guidance, but also for all his trust in my work and ideas. Dr Lettre is an outstanding scientist and an immense inspiration to me.
I wish to thank Dr Daniel E. Bauer, Matthew C. Canver for the wonderful collaborations. I would like to offer a special thanks to Dr Bauer and members of his group for temporarily welcoming me in their lab and mentoring me on CRISPR/Cas9 experiments.
I would also like to thank all my colleagues with whom I shared the last five years: Mélissa Beaudoin, Ken Sin Lo, Geneviève Galarneau, Nathalie Chami, Cécile Low-Kam, Valérie Turcot, Yann Ilboudo, Simon Lalonde, Valérie-Anne Codina-Fauteux, and Jessica Desjardins; Thank you for all the assistance, insightful advice, and amazing lab atmosphere. I would like to offer a special thanks to Mélissa for teaching and guiding on wet lab experiments, which made these projects possible. I would also like to thank Ken for is bioinformatics advice and help with scripting languages. I extend my appreciation to Dr John Rioux and members of his group for their comments and suggestions during lab meetings, and to Sylvain Foisy for sharing the computer cluster, which I used profusely!
I extend my sincere appreciation to the members of my thesis and doctoral exam committees, Dr Gaetan Mayer, Dr Luis Barreiro, and Dr Sébastien Lemieux, for their constructive comments and suggestions. I would also like to express my gratitude to Dr Gaetan Mayer, Dr Luis Barreiro, Dr Tomi M. Pastinen and Dr Catherine Martel, for accepting to be part of my thesis jury and for agreeing to evaluate this work.
I am also thankful to Dr Nicolas Lartillot for introducing me to computational approaches and programming, and to Marie Pageau for inviting me to teach in several bioinformatics classes.
I am also very grateful for the financial support from the Canadian Institutes of Health Research (CIHR), Fonds de Recherche du Québec – Santé (FRQS), Fondation Le Grand Défi Pierre Lavoie, Faculté de Médecine de l’Université de Montréal, Fondation de l’Institut de Cardiologie de Montréal, and Fondation Desjardins.
I offer my immense gratitude to my parents, Johanne and Pierre, and to my brothers Pierre-Alexandre and David, for their support and encouragements during my studies. I also wish to extend my warm thanks to all my friends who supported me and who eagerly celebrated my accomplishments with me, including Nicolas Carignan, Karine Choquet, Alexandre Chouinard, Geneviève Côté, Guillaume Côté, Alix Salvail-Lacoste, Olivier Lamy-Canuel, Alice Lu, Corentin Monfort, Stefany Paulin, Christine Provost, Gaetan Provost, Maxime Kien Duy Quach, Matthieu Rousseau, and Olivier Roy.
Lastly, I want to express my deep appreciation to my life partner Alexandry Calisto for her amazing patience and understanding. Thank you for your immense care and encouragements, and for supporting me every moment of the way.
I want to thank everyone who showed interest in my project and who helped me throughout the course of my under and post-graduate studies.
1.1
Introduction
The first human genome sequence draft was first published in 2001 simultaneously by the International Human Genome Sequencing Consortium and Venter et al.1,2 The human genome is composed of more than 3 billion deoxyribonucleic (DNA) base pairs, which encode an annotated 20,441 protein-coding genes, 20,219 non-coding genes, and 14,606 pseudogenes.3 Accounting for the different isoforms, the human genome encompasses an annotated 198,002 different transcripts.3 Cell type specificity is achieved through the differing activity of regulatory elements such as promoters, enhancers and insulators, which are accompanied by epigenomic and DNA tridimensional interactions.
A large portion of inter-individual variation can be explained by genetic variation. Typically, each human genome contains 4-5 million genetic variants, the vast majority of which are single nucleotide polymorphisms (SNP) – sites that differ at only one DNA base pair.4 Other genetic variation include small insertion and deletions (indels), and structural variants such as large deletions, copy number variants, and inversions. Latest whole-genome sequencing studies estimate that each individual carries around ~38 de novo mutations, assuming a germline mutation rate of ~1.2x10⁻⁸ per bp per generation.5-8 Most genetic variants carried by individuals are common with a minor allele frequency (MAF) > 5%, with only 1-4% of variants with a MAF < 0.05%.4 Healthy individuals carry ~100 loss-of-function (LoF) variants predicted to disrupt the function of protein-coding genes, although most are common and found in non-essential genes.9 Nonetheless, genetic mutations can have drastic impact on human health, as demonstrated by diseases cataloged in the Online Mendelian Inheritance in Man (OMIM) database such as sickle cell disease and cystic fibrosis.10
In contrast to monogenic diseases, which are caused by one specific genetic mutation, complex traits can be explained by tens or hundreds of genetic variants of generally small effects, with a sizable proportion influenced by the environment. For instance, one of the most
variants associated with 36 red cells, white cells, and platelet indices.13 Understanding the genetic architecture of complex trait can yield important insights into their biology. Blood cells are implicated in a vast set of functions such as oxygen transport, immunity and thrombosis. Because of this, dysregulation of blood cell traits can lead to many disorders such as anemia, immunodeficiency, hemophilia, and cancer. Thus, studies of complex traits can be very valuable for the identification of therapeutic targets for related human disorders.
1.2
Complex trait genetics
Gregory Mendel’s famous work on laws of inheritance was rediscovered in the early 20th century. Mendelian inheritance stipulates that a given phenotype can be explained by transmission of a specific allele. This, however, could seemingly not explain quantitative traits such as height. Ronald A. Fisher 1918’s paper reconciled these notions by proposing that quantitative traits can be explained by Mendelian inheritance if they were seen as the additive effect of multiple loci, each with a small effect on the phenotype.14,15 Even when a trait is binary like in common diseases such as heart disease and type 2 diabetes, they can still be explained by the additive effect of several variants, each of which with increasing the risk of disease. Complex traits can also be influenced by non-genetic factors (environment) and non-additive effects such as gene-gene (epistasis) interactions and gene-environment interactions.
The first genetic linkage maps of Drosophilia phenotypes developed by Thomas Hunt Morgan and his student Alfred Sturtevant laid the foundation for genetic mapping that is the identification of genetic loci that correlates with a given phenotype.16,17 Human linkage studies were very successful in identifying genetic markers segregating within pedigrees with monogenic diseases such as Marfan syndrome.18 Linkage studies also were able to detect loci linked with common diseases such as inflammatory bowel disease and schizophrenia, albeit with a more limited success.19 This is because mutations causing monogenic disorders are generally rare and have high penetrance, whereas common diseases can be explained by multiple variants with small effects and low penetrance. Thus, linkage studies are underpowered to map
variants influencing common diseases. In addition, linkage studies were often conducted with relatively low-density genetic markers (e.g. microsatellites spaced ~10 centimorgans apart). The low-resolution of linkage maps made it particularly difficult to find potential causal genes.
1.2.1 Genome-wide associations studies
An alternative to linkage studies are genetic association studies, where a genetic variant is statistically correlated with a trait or disease. When the trait is dichotomous, like in case-control studies, the frequency of the variant is compared between each group. As opposed to linkage study, association studies are usually carried in unrelated samples. Association studies can be conducted on a candidate-gene basis, but require strong hypothesis about the implication of the gene on the trait or disease of interest. Genome-wide association studies (GWAS), on the other hand, aim to survey the genome globally and thus do not make assumptions about the genes associated with the phenotype. First GWAS were made possible following the cataloging of SNPs by early sequencing studies and their decreasing genotyping cost, which made it possible to capture a large fraction of the common variation of the human genome.19
GWAS have been very successful in identifying genetic variants associated with traits or diseases. As of January 2017, the GWAS catalog contains 30,593 unique variant-trait associations identified from 2,701 different studies (Figure 1).20 Arguably one of the first GWAS interrogated less than 100,000 SNPs for association with myocardial infarction, and successfully identified a SNP in the lymphotoxin-α (LTA) gene.21 This study included 94 cases and 658 controls, which contrasts with recent GWAS which can include hundreds of thousands of samples and interrogate several million variants.12,13
GWAS take advantage of the local non-random correlation between genetic variants, defined as linkage disequilibrium (LD). LD is created by mutations and evolutionary forces such
neighboring variants, it is not necessary to genotype them all. Rather, genotyping a subset of variants is enough to tag most of the common variation.22 Efforts such as the International HapMap project aimed at cataloging human genetic variations. Phase I of the HapMap project genotyped ~1 million SNPs in 269 samples from an African, a European, a Japanese, and a Chinese population.23 They estimated that around 500,000 SNPs are enough to tag common variation in individuals of European descent. 22,23
Figure 1. Genetic variants associated with traits in genome-wide association studies (GWAS).
SNPs associated with hematological measurements are highlighted in dark blue. Downloaded from www.ebi.ac.uk/gwas, accessed April 4th 2017.20
These reference panels can also be useful to carry genotype imputation, which aim to extend the number of variants in GWAS studies by estimating the identity of non-genotyped variants using LD. Imputation can lead to increased power to detect association, and is useful for genetic-fine mapping and meta-analyses.24 The 1,000 genomes project phase 3 panel includes over 88 million variants from 26 populations, and includes structural variants and short indels.4 The haplotype reference consortium (HRC) contains 64,976 human haplotypes composed of ~40 million SNPs, and can be used to accurately impute variants down to 0.1% frequency.25 Whole-genome sequencing (WGS) studies are thus very valuable for GWAS, and
the advent of population-specific imputation panels will further increase accuracy of imputation.26-33
1.2.2 Heritability
Observed complex phenotypes are due to the sum of genetic and environmental factors. Thus, the phenotypic variance (σ2
P) can be explained by the sum of genetic (σ2G) and environmental variance (σ2
E):
𝜎𝑃2 = 𝜎𝐺2+ 𝜎𝐸2
Heritability represents the proportion of the phenotypic variance that is explained by genetic variation. Broad-sense heritability (H2) represent the contribution of all genetic effects on the phenotypic variance, including dominance and epistatic effects (H2=σ2
G/σ2P).34 Narrow-sense heritability (h2) is defined as the proportion of phenotypic variance explained by additive genetic variance only (σ2
A; h2=σ2A/σ2P). These heritability definitions do not account for gene and environment co-variation or environment interactions. An example of gene-environment interaction that has been described is the interaction of diet and genetic variants on obesity measures.35,36 Heritability is not necessarily constant and can be influence by changes in environmental factors. For instance, increased physical activity may reduce heritability of traits such as body mass index (BMI).37 Heritability can also be modified by natural selection and inbreeding.34
Various approaches can be used to estimate the heritability of a trait. For example, in parent-offspring design studies, heritability is obtained by estimating the slope (β) of a linear regression between the mid-parent trait (the average of the parent’s trait) and the trait of the offspring. This assumes that shared phenotype values between parent and offspring are due to genetic factors, and not to shared environment, which can inflate heritability estimates.34 Another approach are twin studies that use monozygotic and dizygotic twins. Both are expected
Hence, heritability can be estimated by taking twice the difference of the correlation between monozygotic (rMZ) and dizygotic (rDZ) twins38:
ℎ𝑒𝑟𝑖𝑡𝑎𝑏𝑖𝑙𝑖𝑡𝑦 = 2 × (𝑟𝑀𝑍− 𝑟𝐷𝑍)
For example, twin studies estimate the heritability of height at around 80%.39 A meta-analysis of 2,748 twin studies including over 14 million subjects reported that the average heritability of 17,804 human traits was around 49%, the most heritable being ophthalmological, dermatological, and skeletal traits (mean h2>0.59).40 For most traits (69%), the correlation between twins were consistent with most of the heritability being explained by additive factors. 40
Heritability can also be estimated using identity by descent (IBD). IBD corresponds to part of the genome that are shared between individuals and that have been inherited by a common ancestor. The idea behind this method is that siblings will share around 50% of their genome IBD with some variation (~4%) due to random segregation and recombination. Siblings with higher IBD are expected to be more similar to siblings with lower shared IBD. Heritability can thus be estimated by using the correlation between phenotypic similarity and the proportion of the genome shared IBD.34,41 Tools like Genome-wide Complex Trait Analysis (GCTA) use the correlation between unrelated samples to estimate heritability.42,43 This method uses a linear model to fit the GWAS SNP data to the phenotype and uses restricted maximum likelihood (REML) to estimate the variance explained by these variants. These methods require large datasets to obtain estimates with reasonable precision, and are limited to the variants tagged by the GWAS dataset. The LD score regression method estimates heritability from summary statistics and can be used to partition heritability on function annotations.44
1.2.3 Missing heritability
GWAS of height in 253,288 individuals identified ~700 variants associated with this trait.11 Even though a large number of variants were identified, they explained ~16% of the phenotypic variance, leaving a large gap with the estimated heritability of height of 80%.11,42
This “missing” heritability can be in part explained by variants that do not reach statistical significance. Including the ~9,500 most strongly associated variants increased the variance explained to 29%, and all common variants capture ~60% of the heritability, suggesting that even larger sample size will be required to identify common variants with very small effects.
Rare and low-frequency variants may also explain a part of the missing heritability. Although these variants are expected to have greater effect sizes, very large study are needed to capture enough samples with the low-frequency or rare variants to have power to detect the association. A recent study using the ExomeChip genotyping array in >700,000 samples identified 606 independent variants associated with height, including 83 with low frequency (minor allele frequency (MAF) <5%).12 New loci identified by this study explained an additional 4.1% of the heritability.12
Imprecise phenotyping can also influence heritability measures, and better phenotyping can lead to increased power to detect associations. Power can also be increased by using quantitative phenotypes instead of categorical phenotypes, for example by replacing type 2 diabetes status by blood glucose levels.45 Joint testing of multiple correlated phenotypes can also increase power.46 Missing heritability can also reside in variants not captured by GWAS studies such as structural variants and mitochondrial DNA variants.45 Genetic fine-mapping can reveal new local associations and increase the explained heritability of GWAS loci.47
1.3
Red blood cell traits
The adult bone marrow produces 2.4 million red blood cells (RBC) per seconds.48 RBCs, also called erythrocytes, are the most common cell type in the human body. They are responsible for the transport of oxygen (O2) from the lungs to the tissues, and for the transport of carbon dioxide (CO2) back from the tissues to the lungs. Mature RBCs are rich in hemoglobin, a
highly regulated process, as it has to accommodate the limited life span of erythrocytes (100-120 days), as well as physiological and pathological stresses such as changes in altitude or bleeding. Aside from their vital role in oxygen delivery to the organs, RBCs also serve roles in vascular tonus regulation, pathogen resistance, inflammatory response, and thrombosis.49-54
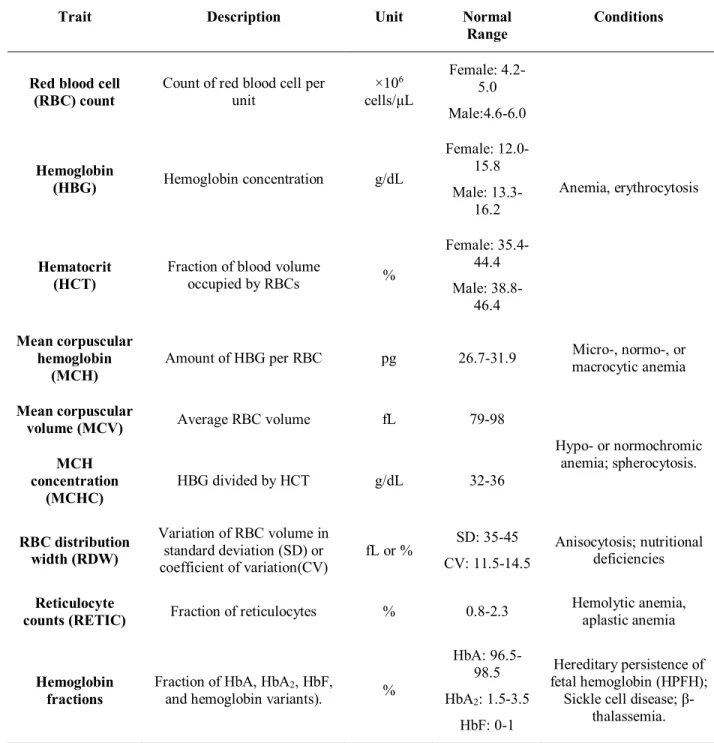
Although erythropoiesis is a well-regulated process, deviation from normal RBC indices can reflect conditions such as anemia, which may in turn reflect disorders such as cardiovascular or liver diseases. Thus, it is not surprising that blood indices are routinely monitored to assess the health of patients. Several indices are routinely measured in a standard complete blood count (Table 1).55 The number of RBCs is measured with RBC counts (×106 cells/µL). The hematocrit (HCT) represents the fraction of blood occupied by RBCs (% volume) whereas the relative amount of hemoglobin is measured with hemoglobin concentration (HBG, g/dL). At the cellular level, mean corpuscular hemoglobin (MCH, pg), mean corpuscular volume (MCV, fL), and MCH concentration (MCHC, g/dL) represent the amount of hemoglobin, the average volume, and hemoglobin concentration of RBCs respectively. Finally, the RBC distribution width (RDW), presented as the coefficient of variation (RDW-CV, %) or the standard deviation (RDW-SD, fL), represents the range of the RBC volume distribution.
RBC indices are highly heritable (40-90%). Because RBC traits are routinely and accurately measured, they are amenable to genetic association studies and can be straightforwardly applied to large cohorts.55 Moreover, functional characterization is possible in model organisms and human erythroid cell culture systems as these assays are well developed and phenotypes are usually cell-autonomous. 55-61 Large-scale genetic association studies have been performed.13,61,62 A GWAS in 135,367 individuals of European and South Asian ancestry identified 75 loci associated with RBC indices, explaining ~4-9% of the phenotypic variation.61 Individuals with a high genetic risk score derived from these SNP were more likely to have high hemoglobin levels associated with adverse outcomes in individuals with various conditions such as neurological and cardiovascular diseases.61,63,64 Chami et al reported 16 additional variants associated with RBC traits in 130,273 samples, including 23,896 individuals of non-European
descent.54 This study focused on rare coding variants, and identified genes implicated in monogenic disorders such as ALAS2, where mutations cause X-linked sideroblastic anemia and erythropoietic protoporphyria.10,54 More recently, Astle et al reported 2,706 loci, defined as high LD groups, associated with hematological traits in 173,480 individuals of European ancestry. This GWAS used comprehensive imputation panels to test ~29.5 million markers down to a minor allele frequency of 0.01%.13 This study estimated that common variants captured 10-28% of the variance in RBC indices, and identified variants associated with pleiotropic effects on multiple hematological traits. For example, SH2B3 was associated with platelet, red blood cell and white blood cell phenotypes.13 Although comprehensive, these studies focused mainly of individuals of European descent. The largest study of RBC traits in individuals of African descent included 16,500 samples.62 Because of positive selection, individuals in malaria-stricken regions have high frequency of variants that modify the susceptibility to this disease, such as mutations causing glucose-6-phosphate dehydrogenase (G6PD) deficiency, which can strongly influence RBC traits.62,65 This highlights the importance of conducting association studies in different populations, especially since GWAS discoveries are generally transferable across ethnicities.
1.3.1 Erythropoiesis and hemoglobin synthesis
The first organ responsible for erythropoiesis is the yolk sac, which releases primitive, macrocytic, RBCs in the developing blood stream.48 The source of RBC eventually switches to the fetal liver (FL), which produces definitive RBCs.66 In contrast to primitive RBCs, definitive RBC progenitors proliferate before entering the blood stream enucleated.67 The months following birth, the site of erythropoiesis switches again to the bone marrow (BM), and to a lesser extent, the spleen. The latter being mainly active as an additional erythropoietic resource under stress conditions like anemia.68
Table 1. Red blood cell traits and examples of related conditions69,70
Trait Description Unit Normal
Range Conditions
Red blood cell
(RBC) count Count of red blood cell per unit ×10
6 cells/µL Female: 4.2-5.0 Male:4.6-6.0 Anemia, erythrocytosis Hemoglobin (HBG) Hemoglobin concentration g/dL Female: 12.0-15.8 Male: 13.3-16.2 Hematocrit (HCT)
Fraction of blood volume
occupied by RBCs % Female: 35.4-44.4 Male: 38.8-46.4 Mean corpuscular hemoglobin (MCH) Amount of HBG per RBC pg 26.7-31.9 Micro-, normo-, or macrocytic anemia Mean corpuscular
volume (MCV) Average RBC volume fL 79-98
Hypo- or normochromic anemia; spherocytosis. MCH concentration (MCHC) HBG divided by HCT g/dL 32-36 RBC distribution width (RDW) Variation of RBC volume in standard deviation (SD) or coefficient of variation(CV) fL or % SD: 35-45 CV: 11.5-14.5 Anisocytosis; nutritional deficiencies Reticulocyte
counts (RETIC) Fraction of reticulocytes % 0.8-2.3
Hemolytic anemia, aplastic anemia
Hemoglobin fractions
Fraction of HbA, HbA2, HbF,
and hemoglobin variants). %
HbA: 96.5-98.5 HbA2: 1.5-3.5 HbF: 0-1 Hereditary persistence of fetal hemoglobin (HPFH);
Sickle cell disease; β-thalassemia.
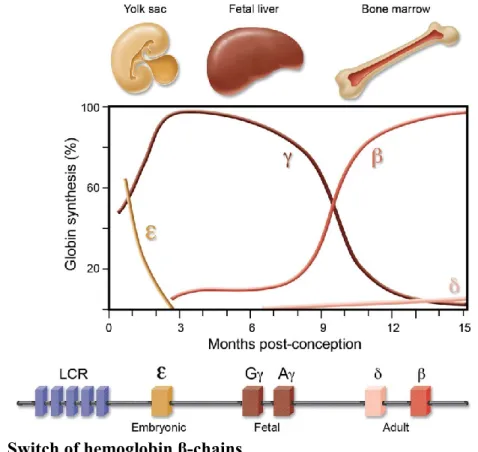
The switch of organ carrying erythropoiesis is correlated with a switch of the main type of hemoglobin produced. Hemoglobin is a tetramer composed of two beta and two alpha chains. Each of these globin chains contain a heme prosthetic group covalently bound by a histidine.48 Heme is composed of protoporphyrin IX with an iron atom at its center. The iron can bind O2
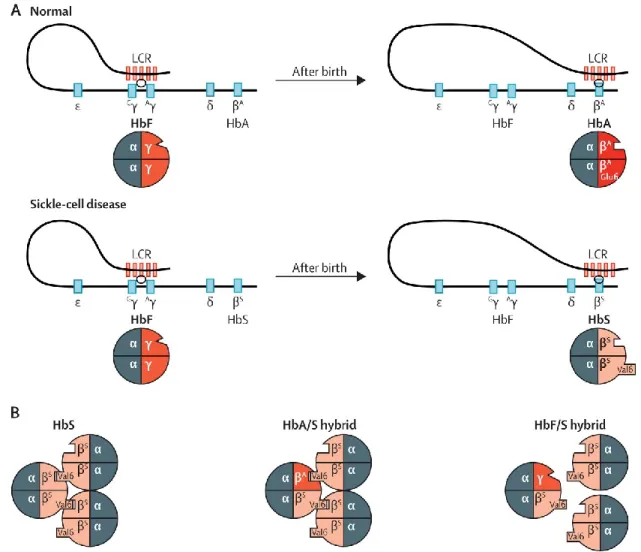
and CO2 when in its ferrous state (Fe2+).48 Embryonic hemoglobin is mainly composed of the α-chain ζ, and the β-α-chain ε (ζ2ε2).71 Hemoglobin produced by fetal and adult erythrocytes are fetal hemoglobin (HbF; α2γ2) and adult hemoglobin (HbA, α2β2), respectively. The production of γ-globin is characteristics of anthropoid primates, and may confer a competitive advantage to the fetus as HbF has a higher affinity to oxygen than HbA, produced by the mother. Other types of hemoglobin are produced at lower levels in each developmental stages. For instance, HbA2 is composed δ-globin instead of β-globin, and comprises around 2% of adult hemoglobin. HbF is also found in healthy adults at usually less than 1% (Figure 2).72
Figure 2. Switch of hemoglobin β-chains
Embryonic ε-globin, encoded by the HBE gene, is replaced by the fetal γ-globin at the first semester post-conception. Two types of γ-globin exists (Gγ and Aγ), which are encoded by HBG2 and HBG1. Around birth, β-globin, encoded by HBB, becomes the major β-chain. Adults also produce low levels of δ-β-globin, encoded by the
HBD gene. Expression of the globin genes is regulated by of the locus control region (LCR). α-chains (not shown)
are produced by a different locus on chromosome 16. The α-chain ζ-globin is expressed during the early embryonic stage, then permanently replaced by α-globin. Adapted from Bauer et al.73
as Gγ and Aγ, which are encoded by two different genes (HBG2 and HBG1 respectively). Gγ-globin predominates on Aγ-Gγ-globin. The β-Gγ-globin cluster is under the control of the locus control region (LCR), an element that confers erythroid-specific and high-level expression of the β-globin genes. It is stipulated that the transcription of β-β-globin genes is activated by looping of the LCR to the promoter of the gene to be expressed – each gene competing with each other.71,74
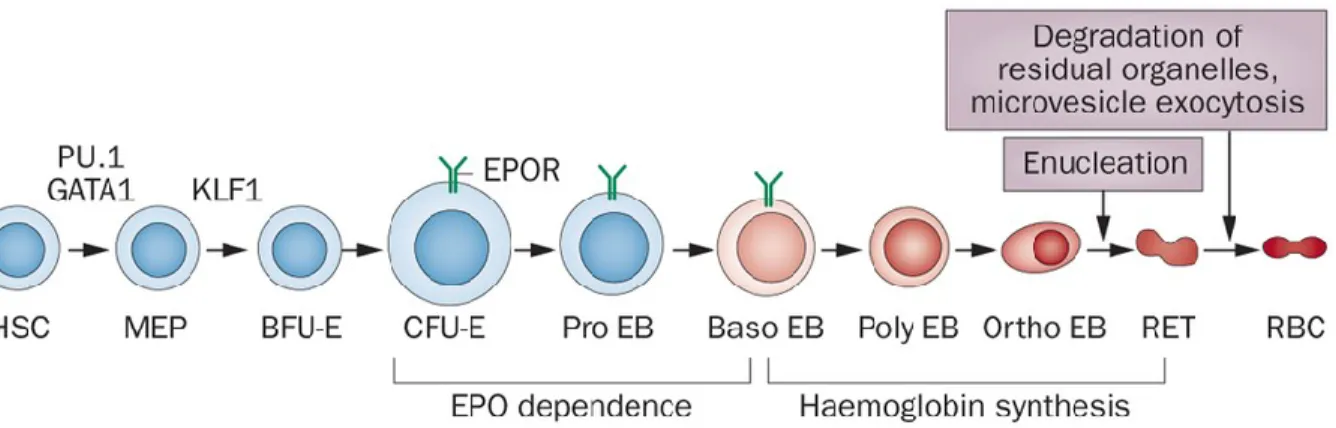
HSC progenitors are directed to the myeloid lineage by giving rise to common myeloid progenitor (CMP) cells.75-77 CMP are then transformed to megakaryocytes-erythroid progenitors (MEP), which give rise to committed erythroid progenitor cells (Figure 3).75-77 Erythroid progenitors can be subdivided as burst-forming unit-erythroid (BFU-E), which differentiate to colony-forming unit-erythroid (CFU-E).71,78 The latter finally differentiate into erythroblasts, which enucleate and give rise to erythrocytes.71,78 The growth and differentiation of BFU-E to CFU-E and latter stages is dependent on multiple growth factors, including stem cell factor (SCF), thrombopoietin (TPO), interleukins 3, 6 and 11 (IL-3, IL-6, IL-11), insulin-like growth factor 1 (IGF1), glucocorticoids, and erythropoietin (EPO). 71,78
Figure 3. Stages of erythroid differentiation.
PU.1, GATA1 and KLF1 are involved in erythroid cell fate determination from hematopoietic stem cells (HSC). Erythropoietin (EPO) dependence ends at the early basophilic erythroblast (Baso EB) phase, and is followed by the initiation of hemoglobin synthesis. MEP: Myeloid early progenitors; BFU-E: Burst-forming unit-erythroid; CFU-E: Colony-forming unit-erythroid; Pro EB: Proerythroblasts; Baso-EB: Basophilic erythroblasts; Poly EB: Polychromatic erythroblasts; Ortho EB: Orthochromatic erythroblasts; RET: Reticulocytes; RBC: Red blood cells. Adapted from Koury & Haase.79
RBC production is tightly regulated. Under hypoxia, levels of EPO increases. Binding of EPO to its receptor (EPO receptor, EPOR) to erythroid progenitor cells leads to increased expression of erythroid program genes, stimulating differentiation. Production and differentiation of RBCs are also tightly linked with heme production and thus to iron availability. For example, transcripts implicated in heme biosynthesis, such as the mRNA of δ-aminolevulinate synthase 2 (ALAS2), contain iron response elements bound by iron response protein that block translation until sufficient intracellular iron concentration.80 Because of its importance, iron is highly conserved and recycled, leading to daily losses of iron of only about 1-2mg representing 0.1% of total iron in the adult human body.81 Production of hepcidin by hepatocytes limits availability of transferrin-bound plasma iron, which is used for erythropoiesis. Hepcidin acts by lowering absorption of dietary iron, recycling of iron by macrophages, and increasing storage of iron in hepatocytes via the degradation of ferroportin, responsible for iron efflux. Conversely, increased erythropoietic demands leads to secretion of erythroferrone into the plasma, repressing liver hepcidin production, and increased plasma iron availability.82
1.3.2 Diseases related to red blood cell traits
Given the necessarily stringent regulation and coordination of erythropoiesis, it is not surprising that several disorders are associated with changes in RBC traits (Table 1). Erythrocytosis is a condition characterized by a higher than normal hematocrit, and can be caused by inherited mutations causing increased response of erythroid progenitor cells to circulating cytokines such as erythropoietin (EPO) (https://omim.org/entry/133100). Increased RBC can also indicate myeloproliferative disorders due to somatic mutations in erythroid progenitor cells such as polycythemia vera, which is caused by mutations in JAK2 that promote clonal proliferation (https://omim.org/entry/133100). Increased RBC counts can also indicate chronic hypoxemia due to lung disease or congenital heart defects.
deficiencies limiting hemoglobin production such as vitamin B12 or iron deficiency.55,83,84 Anemia can either result or be a consequence of cardiovascular diseases.83 Congestive heart failure can be caused by severe anemia. Conversely, anemia in patients with chronic heart failure is associated with increased comorbidities and can be caused by renal dysfunction, increased proinflammatory cytokines, and impaired iron absorption.83 Gene mutations leading to anemia can hinder the production of RBCs such as in Diamond-Blackfand anemia which is due to mutations in genes encoding ribosomal proteins.10 Other mutations lead to decrease hemoglobin production. This is the case of genes implicated in heme biosynthesis such as ALAS2. Mutation in this gene leads to X-linked sideroblastic anemia, characterized by decreased heme production and iron overload.85-87 Other examples are α- and β-thalassemia, caused by mutation in HBA1/HBA2 and HBB respectively. Moreover, MCV, MCH, MCHC, and RDW can distinguish different types of anemia (Table 1). For example, iron deficiency is characterized by microcytic (low MCV) and hypochromic (low MCHC) RBCs.84 Increased RDW is also an independent predictor of mortality due to cardiovascular or kidney diseases, obesity, and cancer.83,88-91 Even in healthy individuals, high RDW is associated with higher mortality.92 Finally, anemia can results from misshapen erythrocytes. This is the case of hereditary spherocytosis, which can be caused by mutations in ANK1, or sickle cell disease (SCD) cause by a mutation in HBB.10,93
1.3.3 Malaria
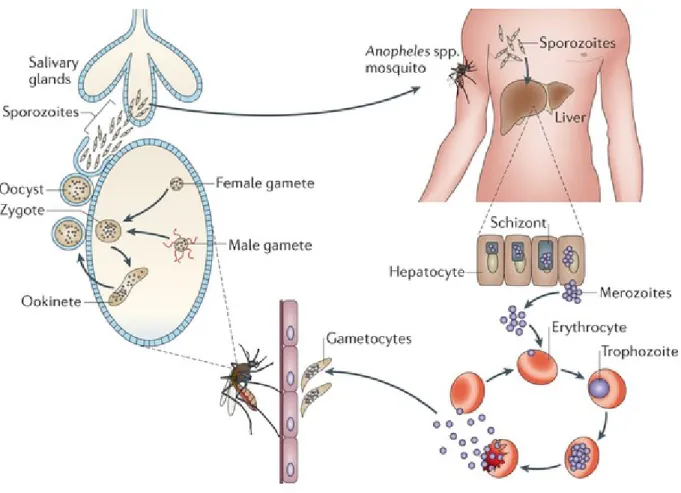
In 2015, the World Malaria Report estimated 212 million cases of malaria infection with 438,000 related deaths. Although the number of cases is decreasing, it is still heavy in developing regions, and especially in Africa where ~90% of all deaths occurred in 2015. The disease is most fatal in children, as their immunity is not fully developed: 70% of deaths were from children under 5. The disease is spread by common females Anopheles mosquitoes, making around 3.2 billion individuals at risk. It is caused by protozoans of the Plasmodium genius, in particular P. falciparum and P. vivax.94
The life cycle of these parasites is complex (Figure 4). Briefly, they first enter the bloodstream in the form of sporozoites following an Anopheles mosquito bite. The sporozoites
are transported to the liver where they infect hepatocytes and undergo schizogony – asexual reproduction of the protozoan. This results in the production of tens of thousands of merozoites, which are released back to the bloodstream in packets called merosomes. There, they start a cycle where they infect RBC, continue schizogony, and are released through RBC lysis. Inside RBCs, some merozoites break this cycle and undergo gametocytogenesis. For P. falciparum, gametocytes sequester to the bone marrow where they mature into gametes, which are released to the peripheral circulation where they can be ingested by feeding mosquitoes. Finally, gametes mate and produce new sporozoites in the infected mosquitoe.94
Figure 4. Life cycle of malaria parasites.
Malaria parasites infect the human body through bites of Anopheles mosquitoes. Sporozoites are transported to the liver to undergo schizogony. Schizonts release tens of thousands of merozoites into the bloodstream where they infect erythrocytes and undergo gametocytogenesis. Gametes are eventually ingested by feeding mosquitoes, where they are fertilized and become zygotes, which matures into oocyst. Occyst eventually burst and release sporozoites into the salivary glands of the mosquito. Adapted from de Koning-Ward et al.95
Malaria infection causes a large range of symptoms including fevers, headaches, abdominal pain, diaphoresis, vomiting, tachycardia, jaundice, and hepatomegaly. Symptoms usually appear after 6-14 days after infection by the parasite.96 It can develop into severe malaria, which is associated with complication such as cerebral malaria, pulmonary edema, severe anemia, bleeding, and renal failure.96 If untreated, the complications can develop rapidly, and translate to death within hours or days. Since 2000, it is estimated that there was a reduction of 60% of malaria-related deaths, thanks to prevention measures, mosquito control, and the development and use of anti-malarial drugs, such as quinine and artemisinin-based therapies. However, development of new therapeutic strategies are needed because of the emergence of treatment-resistant parasites.94
Malaria is notable because of its heavy evolutionary pressure on the human genome. Indeed, several mutations have been identified that confer some forms of resistance to infection. For instance, mutations in CD36 or ICAM1 limit adherence of infected RBC to the endothelium or to other cells.97-99 Mutations that affect the immune system like HLA variants are also common. Other mutations affect different proprieties of RBCs. A notable example is a mutation in the GATA1-binding site of promoter of the Duffy antigen/receptor for chemokines (DARC) gene, which encodes the Duffy antigen. Duffy-negative individuals are resistant to infection by P. vivax, as binding to this antigen is essential for erythrocyte invasion of the parasite.100 Mutations in SLC4A1, FECH and GYPA are also associated with reduced parasite invasion or growth.101-103 Deficiency of the glucose-6-phosphate dehydrogenase enzyme due to mutations in the G6PD gene causes increased hemolysis due to increased oxidative stress, which protects against severe malaria by limiting parasite replication.98,99,104 Finally, regulatory and structural mutations in the globin genes can lead to important changes in the RBC environment where the parasite lives. α+-thalassemia, caused by the disruption of either HBA1 or HBA2, protects against severe malaria.105 More remarkably, mutations in the HBB gene, can lead to different version of globins produced, which are termed HbC, HbE, and HbS. These mutations have distinct regional localization, and their consequences have different severities. HbC heterozygotes and homozygotes are protected from severe malaria, which may be through increased splenic clearance of RBCs. HbE carriers are resistant to P. falciparium infection. Finally, heterozygotes
for the HbS allele are ~10 times more protected from severe malaria.98,106 The mechanism of action might be through increased clearance of infected RBCs or suppression of parasite growth in cells. GWAS have identified variants in the G6PD, ABO, HBB, ATP2B4, and CD40LG loci associated with malaria susceptibility.107
1.3.4 Sickle cell disease
SCD is a recessive genetic disease caused by a mutation in the β-globin gene HBB (Figure 5). Specifically, SCD is due to an A→T transversion, which changes the glutamic acid at position 6 of the β-globin protein by a valine resulting in sickle hemoglobin (HbS). SCD can also be caused by compound heterozygous mutations that includes βS, such as a combination of βS with β-thalassemia (βS/β0 or βS/β+) or with other mutations such as hemoglobin C (βS/βC).93 A damaging consequence of this substitution is polymerization of HbS when deoxygenated, disrupting the shape of erythrocytes which adopt a characteristic “sickled” shape. Polymerization of HbS is also linked to cation homeostasis dysregulation and RBC dehydration, which in turn increases hemoglobin content and exacerbates polymerization.108 Sickled RBC are more fragile: Normal RBC have lifespan of ~3-4 months, whereas sickled RBCs can last <20 days due to increased hemolysis, resulting in anemia.109 The increased stress related to higher RBC production to account for the rapid loss of RBCs leads to an increased number of premature RBCs in the blood stream. These “stress reticulocytes” and sickle RBCs both tend to adhere to blood vessels, which leads to occlusion of capillaries and local hypoxia.110
Because of the selective advantage of heterozygote carriers of the SCD mutation in malaria stricken regions, this disease has a very high prevalence, affecting 20-25 million individuals worldwide, particularly in sub-Saharan Africa. An estimated 300,000 individuals are born with SCD each year.111 In Africa, the mortality rates of children under 5 affected by the disease can reach 50-90%, most of which succumb to infections.112 In high-income countries, SCD patients have higher life expectancy due to earlier diagnosis, better disease management, education, and greater access to care. Unfortunately, the burden of the disease in
better health care management, such as the implementation of screening programs and better education.111
Figure 5. Hemoglobin production and sickle cell disease.
(A) Fetal hemoglobin (HbF, α2γ2) is the main type of hemoglobin before birth γ-globin constitutes the β-chain of
HbF, and is encoded by the Gγ- Aγ-globin genes. After birth, healthy individuals produce adult hemoglobin (HbA,
α2β2), which contains β-globins. In sickle cell disease patients, the glutamic acid at position 6 (Glu6) is mutated
into a valine (Val6) to form sickle hemoglobin (HbS, α2βS2). (B) HbS tends to polymerise under deoxygenated
conditions. γ-globin inhibits polymerisation. Its anti-sickling effect is greatly higher than that of β-globin. Adapted from Lettre & Bauer.93
The morbidities associated with SCD are broad and heterogeneous. Pain crises, characterized by excruciating musculoskeletal pain, are the most common complication of SCD and are due to vaso-obstruction of capillaries.113 25% of SCD will suffer from strokes.109 Acute chest syndrome is a pulmonary complication defined by new pulmonary infiltrates due to
vaso-occlusion of blood vessels. It is responsible for 25% of SCD deaths.114,115 Infection, such as by Streptococcus pneumoniae, are very common particularly because of the loss of function of the spleen, and are a major cause of mortality, especially in children.109 Other complications include osteonecrosis, aplastic crises, priapism, leg ulcers, and kidney failure.109
Most treatments of SCD aim at reducing its complications. Hydroxyurea is the only drug approved by the US Food and Drug Administration to treat SCD. This drug increases HbF levels in SCD patients, reducing the number of complications and increasing life expectancy. The mechanism of action of hydroxyurea on HbF is incompletely understood. Its main HbF-inducing effect is probably through increased stress erythropoiesis, which results from the cytotoxic suppression of erythroid progenitors in the bone marrow.116 Indeed, hydroxyurea inhibits the ribonucleotide reductase, which catalyzes the formation deoxyribonucleotides from ribonucleotides, resulting in decreased DNA synthesis and cytotoxicity. Although this drug is usually well tolerate and have generally mild side effects, it usually doesn’t increase HbF levels enough to completely abrogate SCD complications.93 SCD patients can routinely receive blood transfusion, which can correct anemia and reduce vaso-occlusion-related complications such as stroke and acute chest syndrome.117 However, transfusions can lead to complications such as iron overload. SCD patients can be treated for pain crises with opioids or non-steroid anti-inflammatory drugs (NSAID). Anti-malarial drugs, vaccines and antibiotics can reduce the risk of infections.109,118 The only known cure for SCD is bone marrow transplant, which is associated with 6-year event-free survival rate of >90% for HLA-matched donors.119 However, it is not a feasible health care strategy in low-income countries where the burden of SCD is severe.
1.3.5 Modifiers of β-hemoglobinopathy severity
Individuals with β-hemoglobinopathies present highly heterogeneous clinical manifestations. For example, a study reported that ~40% of SCD patients followed during 9 years never suffered from painful vaso-occlusive crises, whereas ~5% had 3-10 episodes per