Translated Title: Reprint Status: Edition:
Author, Subsidiary: Author Role:
Place of Publication: Québec Publisher Name: INRS-Eau Date of Publication: 1990
Original Publication Date: 31 janvier 1990 Volume Identification:
Extent of Work: viii, 117
Packaging Method: pages incluant 3 annexes Series Editor:
Series Editor Role:
Series Title: INRS-Eau, Rapport de recherche Series Volume ID: 287
Location/URL:
ISBN: 2-89146-296-3
Notes: Rapport annuel 1990-1991
Abstract: 10.00$
Call Number: R000287
by Jean-Pierre FORTIN Jean-Pierre VILLENEUVE Djilali BENMOUFFOK Martin MONTMINY Claude BLANCHETTE
Scientific Report INRS-Eau No 287
BY: Université du Québec Institut national de la recherche scientifique INRS-Eau 2800, rue Einstein Québec (Québec) G1X 4N8 CANADA 31 January 1991
For: Hydrology Division Environment Canada Ottawa, Ontario K1AOE7
and
Application Division Canada Center for
Remote Sensing 1547 Marivale Road Ottawa; Ontario K1A OY7
PART 1 1.1 1.2 1.3 1.4 PART 2 2.1 2.2 2.2.1 2.2.2 2.2.2.1 2.2.3 2.2.4 2.3 2.3.1 2.3.1.1 2.3.1.2 2.3.1.2.1 2.3.1.2.2 2.3.1.2.3 2.3.1.2.4 2.3.1.2.4.1 2.3.1.2.4.2 GENERAL INFORMATION ... 1
Software main characteristics and hardware requirements ... 2
Introduction ... 2
Organization of the manual ... 3
Software availability and information ... 4
THE PHYSITEL PROGRAM (1.0) ... 5
General structure ... 6
Getting started ... 7
List of files on floppy disks ... 7
Installing PHYSITEL 1.0 ... ~ ... 8
Installing PHYSITEL 2.0 using 1 NSTALL. BAT pragram ... 9
Test data and structure of data files ... 10
Starting PHYSITEL 2.0 ... 12
Using PHYSITEL 2.0 ... 12
Sub-menu #1.0: regional data bases ... 13
Sub-menu #1.1: define new regional data base ... 13
Sub-menu #1.2: existing regional data base ... 15
Sub-menu #1.2.1: data base selection ... 16
Sub-menu #1.2.2: header of selected regional data base ... 17
Sub-menu #1.2.3: file content of selected regional data base ... 18
Sub-menu #1.2.4: data input ... 19
Sub-menu #1.2.4.1: land-use classes pixel by pixel fram IMATEL ... 20
2.3.1.2.7.2 2.3.2 2.3.2.1 2.3.2.2 2.3.2.2.1 2.3.2.2.2 2.3.2.2.3 2.3.2.2.4 2.3.2.2.4.1 2.3.2.2.4.2 2.3.2.2.4.3 2.3.2.2.4.3.1 2.3.2.2.4.3.1.1 2.3.2.2.4.3.1.2 2.3.2.2.4.3.2 2.3.2.2.4.3.3 2.3.2.2.4.3.3.1 2.3.2.2.4.3.3.2 2.3.2.2.4.3.4 2.3.2.2.4.3.4.1 2.3.2.2.4.3.4.2 2.3.2.2.4.3.4.3 2.3.2.2.4.3.4.4 2.3.2.2.4.3.5 2.3.2.2.4.4 2.3.2.2.4.4.1 2.3.2.2.4.4.2 2.3.2.2.4.4.3 2.3.2.2.4.5 2.3.2.2.4.5.1 2.3.2.2.4.6 2.3.2.2.4.6.1 2.3.2.2.4.6.2 2.3.2.2.5 2.3.2.2.6 2.3.2.2.6.1 2.3.2.2.6.2
Sub-menu #1.2.7.2: classified image ... 30
Sub-menu #2.0: watershed data bases ... 31
Sub-menu #2.1: define new waterhed data base ... 32
Sub-menu #2.2: existing watershed data base ... 33
Sub-menu #2.2.1: data base selection ... 34
Sub-menu #2.2.2: header of selected data base ... 35
Sub-menu #2.2.3: file content of selected watershed data base ... 36
Sub-menu #2.2.4: add or edit files ... 37
Sub-menu #2.2.4.1: raster data integration ... 38
Sub-menu #2.2.4.2: vector file import ... 40
Sub-menu #2.2.4.3: watershed topography and mask fram WDBfiles ... 40
Sub-menu #2.2.4.3.1: DEM prepracessing ... 42
Sub-menu #2.2.4.3.1.1: filtering ... 42
Sub-menu #2.2.4.3.1.2: removalof local extreme values ... 43
Sub-menu #2.2.4.3.2: slope determination ... 45
Sub-menu #2.2.4.3.3: aspect treatment ... 46
Sub-menu #2.2.4.3.3.1: aspect determination ... 46
Sub-menu #2.2.4.3.3.2: correction of aspect ... 48
Sub-menu #2.2.4.3.4: local pit pracessing ... 49
Sub-menu #2.2.4.3.4.1: localisation of local pits ... 50
Sub-menu #2.2.4.3.4.2: working data base ... 51
Sub-menu #2.2.4.3.4.3: fiat area outlets ... 52
Sub-menu #2.2.4.3.4.4: depression outlets ... 53
Sub-menu #2.2.4.3.5: drainage network determination ... 54
Sub-menu #2.2.4.4: sub-basins processing ... 55
Sub-menu #2.2.4.4.1: determination ... 56
Sub-menu #2.2.4.4.2: editing ... 57
Sub-menu #2.2.4.4.3: links ... 58
Sub-menu #2.2.4.5: land-use integration for grid intervals ... 59
Sub-menu #2.2.4.5.1: raster data fram IMATEL ... 60
Sub-menu #2.2.4.6: file editing ... 61
Sub-menu #2.2.4.6.1: aspect editing ... 62
Sub-menu #2.2.4.6.2: DOS shell ... 63
Sub-menu #2.2.5: display files ... 64
Sub-menu #2.2.6: export files ... 65
Sub-menu #2.2.6.1: export to HYDROTEL ... 66
3.2.1 3.2.1.1 3.2.1.2 3.2.2 3.2.3 3.2.3.1 3.2.4 3.2.5 3.2.6 3.2.7 3.2.8 units ... 70
Preprocessing of DEM data ... 71
Removal of extreme values (sub-menu #2.2.4.3.1.2) ... 71
Filtering of DEM data (sub-menu #2.2.4.3.1.1) ... 72
Determination of slopes (sub-menu #2.2.4.3.2) ... 72
Determination of aspect (sub-menu #2.2.4.3.3) ... 73
First determination of aspect (sub-menu #2.2.4.3.3.1) ... 73
Automatic correction of aspect (sub-menu #2.3.4.3.3.2) ... 74
Interactive correction of aspect (sub-menu #2.2.4.6) ... 75
Processing of local pits, fiat areas and depressions (sub-menu #2.2.4.3.4) ... 76
Drainage network and basin determination (sub-menu #2.2.4.3.5) ... 76
Sub-basin processing to get homogeneous hydrological units (sub-menu #2.2.4.4) ... 76
Figure 2.1 Figure 2.2 Figure 2.3 Figure 2.4 Figure 2.5 Figure 2.6 Figure 2.7 Figure 2.8 Figure 2.9 Figure 2.10 Figure 2.11 Figure 2.12 Figure 2.13 Figure 2.14 Figure 2.15 Figure 2.16 Figure 2.17 Figure 2.18
meteorological data for streamflow simulation and
forescasting by PHYSITEL, IMATELAND HYDROTEL ... 3
General structure of PHYSITEL ... 7
Geographie location of the test basin ... 10
Main menu ... 13
Sub-menu #1.0: regional data bases ... 13
Sub-menu #1.1: define new regional data base ... 15
Sub-menu #1.2: existing regional data base ... 16
Sub-menu #1.2.1: data base selection ... 17
Sub-menu #1.2.2: header of selected regional data base ... 18
Sub-menu #1.2.3: file content of selected regional data base ... .19
Sub-menu #1.2.4: data input ... 20
Sub-menu #1.2.4.1: land-use classes pixel by pixel fram IMATEL ... 21
Sub-menu #1.2.4.2: input data fram raster file ... 22
Sub-menu #1.2.4.2.1: raw data raster file ... 23
Sub-menu #1.2.4.2.2: SPANS style raster file ... 24
Sub-menu #1.2.4.3: input data fram vector file ... 25
Sub-menu #1.2.5: change de X, Y coordinates ... 26
Sub-menu #1.2.5.1: degrees to UTM ... 27
Figure 2.22 Figure 2.23 Figure 2.24 Figure 2.25 Figure 2.26 Figure 2.27 Figure 2.28 Figure 2.29 Figure 2.30 Figure 2.31 Figure 2.32 Figure 2.33 Figure 2.34 Figure 2.35 Figure 2.36 Figure 2.37
Sub-menu #1.2.7.2: classified image ... 31
Sub-menu #2.0: watershed data bases ... 32
Sub-menu #2.1: define new watershed data base ... 33
Sub-menu #2.2: existing watershed data base ... 34
Sub-menu #2.2.1: data base selection ... 35
Sub-menu #2.2.2: header of selected data base ... 36
Sub-menu #2.2.3: file content of selected watershed data base ... 37
Sub-menu #2.2.4: add or edit files ... 38
Sub-menu #2.2.4.1: raster data integration ... 39
Sub-menu #2.2.4.2: vector file import ... 40
Sub-menu #2.2.4.3: watershed topography and mask from WDB files ... 41
Sub-menu #2.2.4.3.1: DEM preprocessing ... 42
Sub-menu #2.2.4.3.1.1: filtering ... 43
Sub-menu #2.2.4.3.1.2: removal of local extreme values ... 44
Sub-menu #2.2.4.3.2: slope determination ... 45
Figure 2.42 Figure 2.43 Figure 2.44 Figure 2.45 Figure 2.46 Figure 2.47 Figure 2.48 Figure 2.49 Figure 2.50 Figure 2.51 Figure 2.52 Figure 2.53 Figure 2.54 Figure 2.55 Figure 2.56 Figure 2.57 Figure 2.58 Figure 3.1 Figure 3.2 Figure 3.3
Sub-menu #2.2.4.3.4.2: working data base ... 52
Sub-menu #2.2.4.3.4.3: fiat area outlets ... 53
Sub-menu #2.2.4.3.4.4: depression outlets ... 54
Sub-menu #2.2.4.3.5: drainage network determination ... 55
Sub-menu #2.2.4.4: sub-basins pracessing ... 56
Sub-menu #2.2.4.4.1: determination ... 57
Sub-menu #2.2.4.4.2: editing ... 58
Sub-menu #2.2.4.4.3: links ... 59
Sub-menu #2.2.4.5: land-use integration for grid intervals ... 60
Sub-menu #2.2.4.5.1: raster data fram IMATEL ... 61
Sub-menu #2.2.4.6: file editing ... 62
Sub-menu #2.2.4.6.1: aspect editing ... 63
Sub-menu #2.2.4.6.2: DOS shell ... 64
Sub-menu #2.2.5: display files ... 65
Sub-menu #2.2.6: export file ... 66
Sub-menu #2.2.6.1: export to HYDROTEL ... 66
Sub-menu #2.2.6.2: export to SPANS ... 68
3 x 3 window used fram removal of extreme values ... 71
Weights used fo filter DEM data ... 72
APPENDIXB APPENDIXC
Data files
PART 1 GENERAL INFORMATION
1.1 SOFTWARE MAIN CHARACTERISTICSAND HARDWARE REQUIREMENTS
Name: PHYSITEL 2.0 Objective: Programming language: Type of microcomputer: Memory requirements: Written by: Developped by: 1.2 INTRODUCTION
Preparation of watershed data base for streamflow simulation by HYDROTEL
"C", with use of GKS for display purposes
IBM compatibles with mathematical co-processor. A VGA board is suggested but not mandatory.
640k.
Martin Montminy and Djilali Benmouffok
Jean-Pierre Fortin, Djilali Benmouffok and Martin Montminy
PHYSITEL 2.0 is one of three complementary programs developped specifically for hydrological applications. As seen in figure 1.1, HYDROTEL is a software program allowing simulatiom or forecast of streamflow in rivers. The analysis of remotely sensed data for input to HYDROTEL is done by IMATEL. As for PHYSITEL, it can be considered as a special type a GIS program allowing both the integration of spatial data into hydrological units and determination of relations between these units through the drainage network derived from DEM data.
Data
H
Processed
Remotely
Sensed data
l
Physical data
~
(pedology,
1PHYSITEL
topography, ... )
'---'
r
Processed
Weather
Radar
1Weather
~
Radar
1PRERAD
Da ta
L - . - - - ' 1 ~ 1Streamflow
HYDROTEL~Simulation
'---'.
and forecast
t t 1Physical and
R. S. hydromet.
data for
specific basins
Hydromet. and
Streamflow
Data
FIGURE 1.1 Integrated analysis of physical, remotely sensed and meteorological data for steamflow simulation and forecasting by PHYSITEL, IMATEL and HYDROTEL.
With PHYSITEL 2.0, raster integration is be allowed to any other larger raster resolution and to hydrological units of any shape.
1.3 ORGANIZATION OF THE MANUAL
how to input and process data.
Complementary information on various topics related to the use of PHYSITEL 2.0 are given in part "THREE".
1.4 SOFTWARE AVAILABILITY AND INFORMATION
The current version (2.0) of PHYSITEL is normally available only to Environment Canada and CCRS personnel participating in the testing of that version.
For more informations on PHYSITEL 2.0, please contact: Prof. Jean-Pierre Fortin INRS-Eau
2800, rue Einstein, bureau 105 Québec (Québec) G1X4N8 CANADA Telephone: Telex:
Fax:
(418) 654-2591 051-31623 (418) 654-26002.1 GENERAL STRUCTURE
As will be seen in the main menu, the program allows the preparation of regional as weil as watershed data bases.
Regional data bases (RDB) will contain spatial data coming from various sources with their original spatial resolution. The only modifications made to the original data will be done to their geographical coordinates, if necessary, as ail data in a particular regional data base will be referenced spatially with the same projection (UTM). Data sets whose spatial extent is larger or smaller than that of the regional data base will be accepted by PHYSITEL. In particular, PHYSITEL 012.0) is able to input raster data from and output data to SPANS (a TYDAC software package), and read vector data from ARCINFO. RDB's should be considered as a way to archive data in PHYSITEL for the creation of WDB. So, their size has only to be large enough to include ail watersheds on which a user would Iike to make simulations. As their is no restriction on the number of RDB's, apart the storage capacity on disk, there may be as many RDB's as WDB's, that is one WDB by RDB. The decision on how many WDB's should be created from a particular RDB is essentially a matter of convenience in PHYSITEL 2.0.
Data bases for particular watersheds (WDB) will be derived from regional data bases, with the spatial resolution and particular type of integration chosen by the user. Remember that the spatial resolution of the watershed data base must be greater or equal to the largest spatial resolution of the input files of the regional data base from which those files will be imported.
INPUT
l e 1 1 1 F" 1 DATA - -File 3FIGURE 2.1 General structure of PHYSITEL.
2.2 GETTING STARTED
This section gives ail necessary informations to install the program on your microcomputer. A data set is also furnished with the program to help the user to get acquainted with it.
2.2.1 List of files on floppy disks
PHYSITEL 2.0 is sent on two 1.2 M floppy disk. Content:
Disk #1: program Disk. · CONFIG.SYS
Display and printer drivers as weil as GSSCGI,SYS driver contra 1er necessary to run the program with the graphies options can be bougth fram:
Graphie Software Systems Inc. 9590 SW Gemini Drive P.O. Box 4900 Beaverton, OR 97076-4900 U.S.A. Tel. (503) 641-2200 Fax (503) 643-8642 2.2.2 Installing PHYSITEL 1.0
The AUTOEXEC.BAT and CONFIG.SYS files on your system should first be modified to run PHYSITEL 2.0.
- modifications to AUTOEXEC. BAT file add: SET KERNEL
=
path\PHYSITELwhere: "path" is the full path name including drive specification of location of the PHYSITEL subdirectory.
- modifications to CONFIG.SYS file add: FILES
=
20 (or more)DEVICE = path\name.sys
where: "path" is the full path name of the directory where the display driver is. "name" is the name of the display driver file.
is.
NOTE: the previous command may be modified to. DEVICE = path\GSSCGLSYS/T
ln that case, only the essential parts of the GSS program are loaded when booting the computer, saving memory space for other programs run on the computer. It is then necessary to copy DRIVERS.EXE in the PHYSITEL directory and to run it prior to run PHYSITEL. Otherwise, this is not necessary. When the AUTOEXEC.BAT and CONFIG.SYS files are modified, one may proceed with the other files.
PHYSITEL 2.0 can be installed using program INSTALL.BAT present on program disk or by following the steps given below.
2.2.2.1 Installing PHYSITEL 2.0 using 1 NSTALL. BAT program
To install PHYSITEL follow these three steps and PHYSITEL will install itself. File IDISK1.LST" on diskette #1 list ail the files that should be present in the "path" directory specified in STEP 3:
1. insert PHYSITEL diskette #1 in drive A; 2. change to that drive (A:);
ln order to familiarize the user with PHYSITEL 2.0, a data set is ineluded with the program. At the same time, it should be looked at as an example, for the preparation of other data sets.
Test basin: sub-basin of the Eaton river upstream of streamgauge station 030242 (Ioeated downstream of the bridge on highway 210, at Sawyerville. Figure 2.2 shows the position of the station on the map, together with those of meteorologieal stations and basins limits. 1" 30' lC-.~OD RlyCR 2 330()(f.. ç ~ "0 .., ~ t,
Eoton'
basin
..
~teorologiç.l st.tions l - 7020885 2 - 7022280 3 - 702230f 4 - 72033\:"..
5 - 7(-21.263 6 - 7024621. 7 - 7027372 8 - 7027520 9 - 7027802 10 - 7028124 11 - 7028906 v-a..
0 0 Streamflov st~~ions 0 2 a z J. - 030234 B - 030242 ~.
on '., ~.
on..
SCQiC'; 5 0 S '0 20 25 30"
1 1 1 1 ... J , 7,° 30' 7tO .5- 71° oc1. Regional data bases;
2.-
Watershed data bases;
O. -
Exit.
FIGURE 2.3 Main menu.
2.3.1 Sub-menu #1.0: regional data bases
Two options are offered in sub-menu 1.0 (figure 2.4). Option 1 allows the definition of a new regional data base. If the user wants to access an existing data base, he selects option 2. One can return to the "main menu" by selecting option "0" and pressing "ENTER" or typing "0".
MAIN MENU
1. REGIONAL DATA BASES
2.
1
O.
1. Define new data base;
~
2.- Use existing data base;
0.- Return to previous menu.
FIGURE 2.4 Sub-menu #1.0: regional data bases.
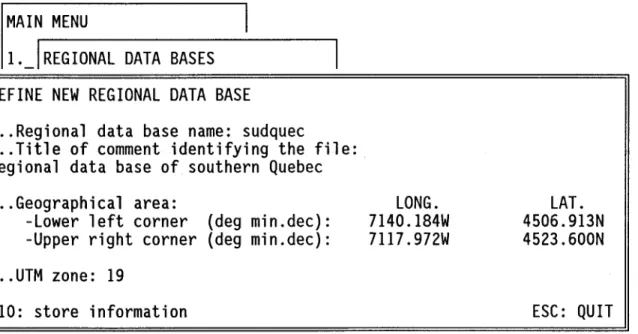
comment identifying the data base more explicitely can be typed on the next lines.
The geographical are a covered by the ROB is then entered, lower left corner first and upper right corner last. For each corner, the first coordinate is the longitude and the second the latitude. Both coordinates are typed as shown. For example, 710 40' west
would be typed as "7140.000W". Thousandths of a minute are used instead of "seconds" for accuracy purposes. Only portions of data sets included inside of these geographical limits will be stored in the ROB.
Ali data in the ROB will be spatially referenced with the UTM projection. The user has to specify the UTM zone.
One can quit the sub-menu any time by pressing "ESC" and return to the previous menu. Otherwise, once the characteristics of the new ROB are given they may be saved by pressing "F10".
A new ROB is then created and a return to the previous menu is done automatically.
MAIN MENU
1._IREGIONAL DATA BASES
DEFINE NEW REGIONAL DATA BASE
... Regional data base name: sudquec
... Title of comment identifying the file:
Regional data base of southern Quebec
... Geographical area:
-Lower left corner (deg min.dec):
-Upper right corner (deg min.dec):
... UTM zone: 19
FlO: store information
LONG.
7140.l84W
7117.972W
FIGURE 2.5 Sub-menu #1.1: define new regional data base.
LAT.
4506.9l3N
4523.600N
Seven options are active in sub-menu #1.2 (figure 2.6). Two "user's defined tasks" are also available with PHYSITEL 2.0.
First a RDB has to be selected as the current one, by option 1.
Option 2 allows the user to see the actual content of the selected data base.
The header of the RDB, containing the characteristics of the data base defined in sub-menu #1.1, can be shown if option 3 is selected.
To input new data select option 4.
If a change in x-y coordinates is necessary it can be done by choosing option 5. Modification of file content can be done if option 6 is chosen.
It is possible to display the data, if option 7 is selected.
If option 8 or 9 are selected a message "Sarry not implemented yet!!!" will be displayed. One can add his own functions. See appendices A and B.
MAIN MENU
11. REGIONAL DATA BASES
2.
O. 1.
~
2. EXISTING REGIONAL DATA BASE
O.
~
1. Data base selection;
FIGURE 2.6
2.- Header of selected data base;
3.- File content of selected data base;
4.- Data input;
5.- Change of X,Y coordinates;
6.- File modification;
7.- Display;
8.- User's defined task #1;
9.- User's defined task #2;
0.- Return to previous menu.
Sub-menu #1.2: existing regional data base.
2.3.1.2.1 Sub-menu # 1.2. 1: data base selection
A list of existing RDB is produced when sub-menu #1.2.1 is chosen (figure 2.7). Select the RDB on which you want to work by placing the cursor on that data base name and then by pressing "ENTER". The name of the current data before selection appears in the lower left corner of the menu.
SUDQUEC
QUESUD
KOOTENAY
Current data base: sudquec
FIGURE 2.7 Sub-menu #1.2.1: data base selection.
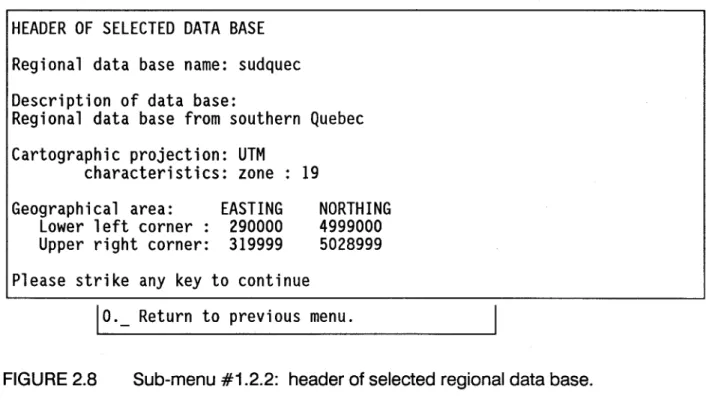
2.3.1.2.2 Sub-menu #1.2.2: header of selected regional data base
ESC:QUIT
The content of the header of the selected RDB is shown in sub-menu #1.2.2 for information only. No action can be taken. Return to the previous menu is done by striking any key.
HEADER OF SELECTED DATA BASE
Regional data base name: sudquec
Description of data base:
Regional data base from southern Quebec
Cartographie projection: UTM
characteristics: zone: 19
Geographical area:
Lower left corner :
Upper right corner:
EASTING
290000
319999
Please strike any key to continue
NORTHING
4999000
5028999
10._
Return to previous menu.
FIGURE 2.8 Sub-menu #1.2.2: header of selected regional data base.
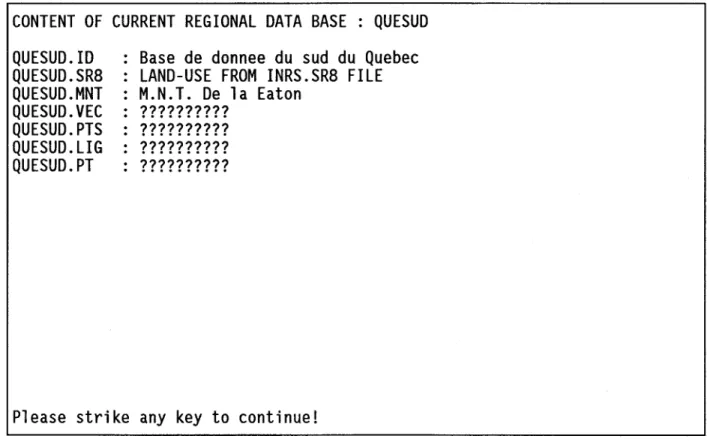
2.3.1.2.3 Sub-menu # 1.2.3: file cantent af se/ected regianal data base
Sub-menu #1.2.3 shows the name of the RDB together with a list of files actually in the RDB (figure 2.9). A return to the previous menu is obtained by striking any key.
QUESUD. ID
QUESUD.SR8
QUESUD.MNT
QUESUD.VEC
QUESUD.PTS
QUESUD. LIG
QUESUD.PT
Base de donnee du sud du Quebec
LAND-USE FROM INRS.SR8 FILE
M.N.T. De la Eaton
??????????
??????????
??????????
??????????
Please strike any key to continue!
FIGURE 2.9 Sub-menu #1.2.3: file content of current regional data base.
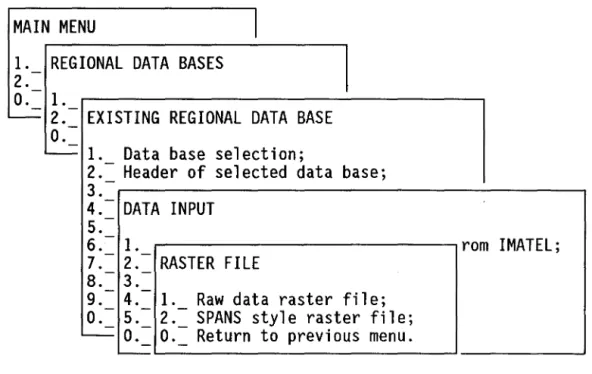
2.3.1.2.4 Sub-menu # 1.2.4: data input
Sub-menu #1.2.4 (figure 2.10) is used to access specifie menus for input of various types of data. With PHYSITEL 2.0 it will be possible to input:
land-use classes pixel by pixel IN *.SR8 format;
raster data formatted as defined in sub-menu #1.2.4.3; vector data formatted as defined in sub-menu #1.2.4.4.
MAIN MENU
11. REGIONAL DATA BASES
2.
-O. l.
~
2.-
-EXISTING REGIONAL DATA BASE
O.
~
1. Data base selection;
2.-
Header of selected data base;
3.-.---,
4.-
DATA INPUT
5.-6.-
1. Land-use classes pixel by pixel from IMATEL;
7.
2.-
Raster file;
8.- 3.-
Vector file;
9.- 4.-
User's defined format #1;
0.- 5.-
User's defined format #2;
~
0.= Return to previous menu.
FIGURE 2.10 Sub-menu #1.2.4: data input.
2.3.1.2.4.1 Sub-menu #1.2.4.1: land-use classes pixel by pixel fram IMATEL
Land-use classes on a pixel by pixel basis can be input fram IMATEL. The land-use file, as output by IMATEL, should contain ail needed informations on class identification (see appendix A for more details).
Type the full path name of the IMATEL file and the extension of the regional file name. Press "F10" to store the file and display a window in which a comment describing the file may be added. Press "RETURN" after.
1. -
REGIONAL DATA BASES
2.
-O.
- 1.--
2.
-EXISTING REGIONAL DATA BASE
O.
--
1. -Data base selection;
2.
-Header of selected data base;
3.
4.
-
-DATA INPUT
15.
-6.
- 1. -LAND-USE CLASSES PIXEL BV PIXEL FROM IMATEL
7.
-2.
-8. 3.
- -... Imatel file name :
9.
-4.
-... RDB's file name
:QUESUD.
o.
-5.
-' - - -
o.
FlO: store information
ESC: QUIT
'
-FIGURE 2.11 Sub-menu #1.2.4.1: land-use classes pixel by pixel fram IMATEL.
2.3.1.2.4.2 Sub-menu #1.2.4.2: raster file
Two input raster formats are available in PHYSITEL 2.0 (figure 2.12). The first option is a general raster format and the second one allows compatibility with SPANS raster files. Select the one you need.
MAIN MENU
1l. -
REGIONAL DATA BASES
2.
-o.
- l.-L . . . . -
2. EXISTING REGIONAL DATA BASE
-o.
-L . . . . - l.
Data base selection;
-2. Header of selected data base;
-3.
-4.
-DATA INPUT
5.-6.
- l. -rom IMATEL;
7. 2. RASTER FILE
--8. 3.
--9.
4.
l.Raw data raster file;
0.-
5.-2.- SPANS style raster file;
-
o.
0.= Return to previous menu.
-FIGURE 2.12 Sub-menu #1.2.4.2: raster file.
2.3.1.2.4.2.1 Sub-menu #1.2.4.2.1: raw data raster file
A general purpose raster format is available with PHYSITEL 2.0 (see appendix A for more details) (figure 2.13). It is provided to read D.E.M. data primarily, but cou Id be used to read similar types of data as weil.
Type tirst the original full path file name of the raster data. Then, enter the type of data: 0 for "ASCII", 1 for binary coded on two bytes (type "SHORT" in C). Continue by entering the extension to the regional file name under which the data will be saved.
Indicate the UTM coordinates of the lower left corner and the upper right corner (easting first). Finally, enter the grid size, in meters, in the X and Y directions.
The raster file is read and saved by pressing "F10". When "F-10" is pressed a new window appears in which a comment describing the file may be added. Press "RETURN" after ward.
MAIN MENU
1 l. -REGIONAL DATA BASES
2.
-O.
- l.2.
-EXISTING REGIONAL DATA BASE
1'
-O.
-' - - - l.
Dat RAW DATA RASTER FILE
-2.
-Hea
3.
-
... Raster file's name:
4.-DAT .. Type of raster data:
05.
-o -
ascii
6.
- l. -1 - binary
7.
-2.
-8.
- 3. -... RDB's fil e name
.
.
QUESUD.
9. 4. --O.
-5.
-... Geographical area(UTM)
EASTING
NORTHING
' - - -
o.
... Lower left corner:
--
... Upper right corner:
.... Grid size(meters):
FIO: store information
ESC: QUIT
FIGURE 2.13 Sub-menu #1.2.4.2.1: raw data raster file.
2.3.1.2.4.2.2 Sub-menu #1.2.4.2.2: SPANS style raster file
Type the full paths for the header and image files fram SPANS (*.RNL and *.RHN file formats). Next, type the extension to the regional file name under which the data will be saved. Press IF10" to store the information and display a window in which a comment describing the file may be added. Press "RETURN" afterwards.
MAIN MENU
11. REGIONAL DATA BASES
2.
-O. 1.
~
2.-
EXISTING REGIONAL DATA BASE
0.-~
1.
Data base selection;
2.-
Header of selected data base;
3.-r---~
4.-
DATA INPUT
5.-6. 1.
Irom IMATEL;
7. - 2.-RASrr========================i1
8.- 3.-
SPANS STYLE RASTER FILE
9.- 4.- 1.
0.- 5.- 2.- ... Header file's name(RHN):
'-- O. O.
. ... Image file's name(RNL):
~---
... RDB file's name:
QUESUD.
FlO: store information
ESC:QUIT
FIGURE 2.14 Sub-menu #1.2.4.2.2: SPANS style raster file.
2.3.1.2.4.3 Sub-menu #1.2.4.3: input data fram vector file
A general purpose vector format, allowing input of vector files produced with the ARCINFO·function UNGENERATE (ARCINFO user's guide, January, 1989), is available with PHYSITEL 2.0 (figure 2.15). It is pravided to read vector data representing various types of variables, like a river network subdivided in reaches or homogeneous units.
Type the full path of the original vector file, as weil as the extension to the regional file name under which the data will be saved. Then, using the "SPACE BAR" identify the type of data contained in the vector file as "points" or "Iines". Press "F10" to store the informations and display a window in which a comment describing the file may be added. Press "RETURN" afterwards.
l. -
REGIONAL DATA BASES
/2.
-O.
- l.--
2.
EXISTING REGIONAL DATA BASE
-O.
--
l. -Data base selection;
2.
-Header of selected data base;
3.
-4.
-DATA INPUT
5.
6.-
1._ Land-use classes pixel by pixel from IMATEL;
7. 2.
--8. 3.
- -VECTOR FILE
9.
-4.
-O.
-5.
-... Vector file name:
' - - -
O.
... RDB file name: QUESUD
-' - - -
... Type of file: UNES
FlO: store information
ESC: QUIT
FIGURE 2.15 Sub-menu #1.2.4.3: input data fram vector file.
2.3.1.2.5 Sub-menu #1.2.5: change de X, Y coordinates
This menu leads to two sub-menus where it is possible to obtain the UTM equivalent of a LONG-LAT coordinate(option 1) and vice-versa(option 2).
MAIN MENU
11. -
REGIONAL DATA BASES
2.
-o.
- 1.-~
2. EXISTING REGIONAL DATA BASE
-o.
-~ 1.
Data base selection;
-2. Header of selected data base;
-3.
-File content of selected data base;
4.
-5.
-CHANGE OF X Y COORDINATES
6.
7.-
1._ Degrees to UTM;
8.2. UTM to Degrees;
9.
-o.
- Return to previous menu.
-o.
-1
FIGURE 2.16 Sub-menu #1.2.5: change of X, Y coordinates.
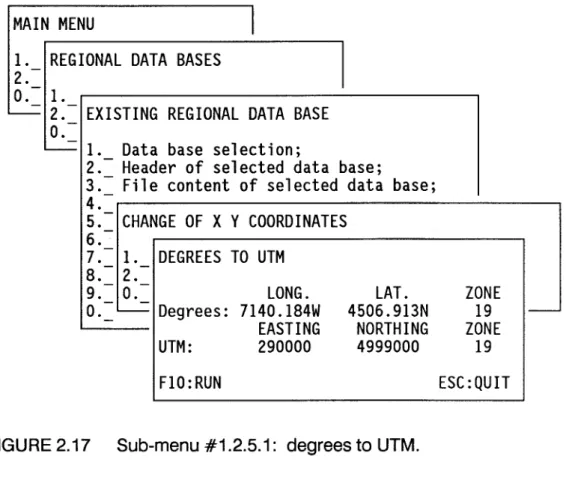
2.3.1.2.5.1 Sub-menu #1.2.5.1: degrees to UTM
The user enters the longitude and latitude of the coordinates in degrees using the same format as in sub-menu #1.1 plus the UTM zone relative to which the transformation will be pertormed.
1. -
REGIONAL DATA BASES
2.
-O.
- 1.-' - - -
2. EXISTING REGIONAL DATA BASE
-O.
-' - - - 1.
Data base selection;
-2. Header of selected data base;
-3. File content of selected data base;
-4.
-5.
-CHANGE OF X Y COORDINATES
6.
-7.
- 1. -DEGREES TO UTM
8. 2.
--9. O.
LONG.
LAT.
ZONE
0.---= Degrees: 7140. 184W
4506.913N
19
1-EASTING
NORTHING
ZONE
UTM:
290000
4999000
19
F10:RUN
ESC: QUIT
FIGURE 2.17 Sub-menu #1.2.5.1: degrees to UTM.
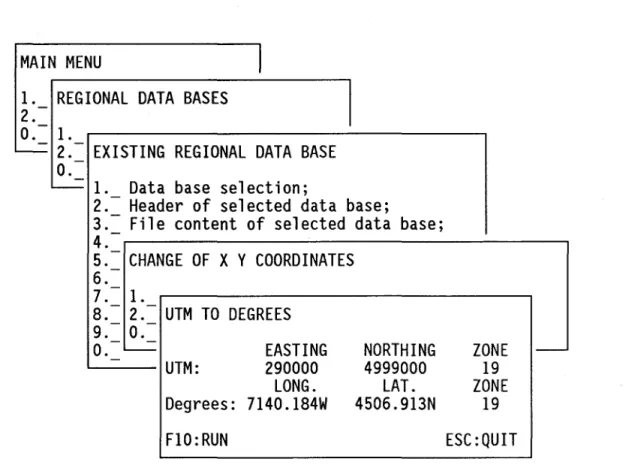
2.3.1.2.5.2 Sub-menu #1.2.5.2: UTM to degrees
Sub-menu #1.2.5.2 (figure 2.18) is the conterpart of sub-menu 1.2.5.1 and is used to obtain the degree equivalent of a geographical coordinate expressed in UTM.
The user enters the easting and northing coordinates as weil as the zone of the UTM projection and press "F10" to get the result.
MAIN MENU
1l. -
REGIONAL DATA BASES
2.
-O.
- l.--
2. EXISTING REGIONAL DATA BASE
-O.
-' - - l.
Data base selection;
-2. Header of selected data base;
-3. File content of selected data base;
-4.
-5.
-CHANGE OF X Y COORDINATES
6.
-7.
- l.-8. 2. UTM TO DEGREES
--9. O.
--O.
' - -EASTING
NORTHING
ZONE
-UTM:
290000
4999000
19
LONG.
LAT.
ZONE
Degrees: 7140. 184W
4506.913N
19
FlO: RUN
ESC :QUIT
FIGURE 2.18 Sub-menu #1.2.5.2: UTM to degrees.
2.3.1.2.6 Sub-menu # 1.2. 6: file modification
If a user wants to modify a file without leaving PHYSITEL, he may use this menu (figure 2.19). He has access to DOS and may use the pragram of its choice to edit the file. When this is done, he comes back to PHYSITEL by typing "EXIT". Note that what will appear on your screen will differ fram figure 2.19 depending on your computer, your operating system and the directory where physitel is located. Note also that it is very important to return to that directory before returning to PHYSITEL.
(C)Copyright Hewlett-Packard 1986-1988
(C)Copyright Microsoft Corp 1981-1988
C:\PHYSITEL>
FIGURE 2.19 Sub-menu #1.2.6: file modification.
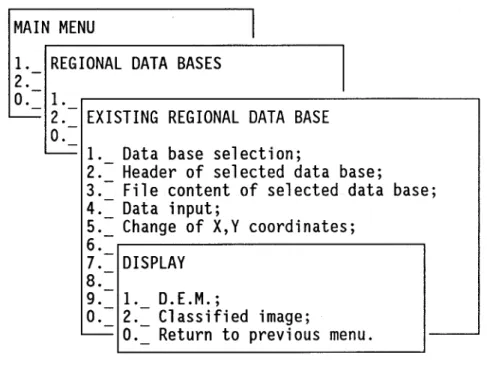
2.3.1.2.7 Sub-menu #1.2.7: display
Display of digital elevation model data or land-use classes on a pixel by pixel basis in the RDB are available in PHYSITEL 2.0.
Choose option 1 for DEM display and option 2 for land-use classes (figure 2.20).
MAIN MENU
11. REGIONAL DATA BASES
2.
-o.
1.~
2.- EXISTING REGIONAL DATA BASE
0.-~
1. Data base selection;
2.-
Header of selected data base;
3.- File content of selected data base;
4.-
Data input;
5.-
Change of X,Y coordinates;
6.-7.- DISPLAY
8.
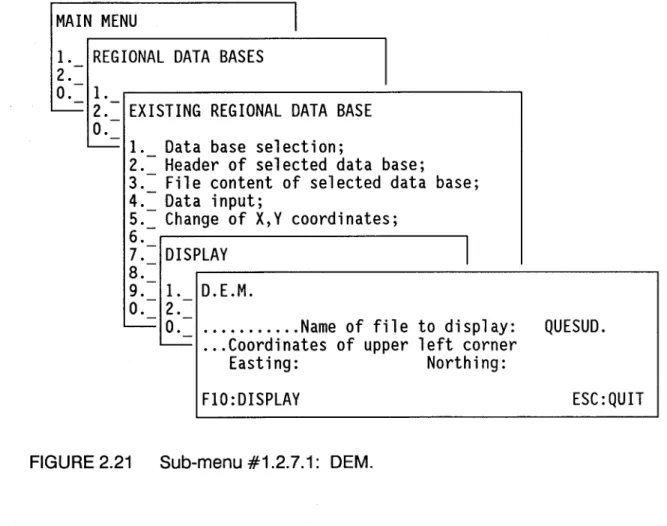
2.3.1.2.7.1 Sub-menu # 1.2.7.1: DEM
Type the extension of the file name of the digital terrain model you want to display, as weil as the UTM coordinates of the upper left corner of the matrix. Press "F10" to display the DEM.
MAIN MENU
1l. -
REGIONAL DATA BASES
2.
-O.
- l.-' - - -
2.
EXISTING REGIONAL DATA BASE
-O.
-- l. -
Data base selection;
2.
-Header of selected data base;
3.
File content of selected data base;
4.
=
Data input;
5. Change of X,Y coordinates;
6.
17.
--DISPLAY
8.
-9.
- l. -D.LM.
O.
-2.
--
O.
... Name of file to display:
QUESUD.
C o . -
... Coordinates of upper left corner
Easting:
Northing:
FIO:DISPLAY
ESC: QUIT
FIGURE 2.21 Sub-menu #1.2.7.1: DEM.
2.3.1.2.7.2 Sub-menu #1.2.7.2: classified image
Type the extension of the file name of the classified image you want to display, as weil as the coordinates of the upper left corner of the image. Press "F10" to display the image.
MAIN MENU
11. REGIONAL DATA BASES
-2.
-O. l.
~
2.- EXISTING REGIONAL DATA BASE
-o.
~
1. Data base selection;
2.-
Header of selected data base;
3.-
File content of selected data base;
4.-
Data input;
5.-
Change of
X,Y
coordinates;
6.
7.-
DISPLAY
8. -9. l.0.- 2.-
CLASSIFIED IMAGE
--=
0.---= ...
Name of file to display:
... Coordinates of upper left corner
Easting:
Northing:
F10:DISPLAY
FIGURE 2.22 Sub-menu #1.2.7.2: classified image.
2.3.2 Sub-menu #2.0: watershed data bases
QUESUD .
ESC:
QUIT
It should be noted immediately that the structure of menus permitting to work on the watershed data bases (WDB) will be similar to those of the regional data bases (RDB). Two options are offered in sub-menu #2.0 (figure 2.23). Option 1 allows the definition of a new watershed data base. To have access to an existing WDB, option 2 has to be
MAIN MENU
1. WATERSHED DATA BASES
2.-1
O.
1. Define new data base;
~
2.- Use existing data base;
0.= Return ta previaus menu.
FIGURE 2.23 Sub-menu #2.0: watershed data bases.
2.3.2.1 Sub-menu #2.1: define new watershed data base
Sub-menu #2.1 (figure 2.24) is used to define the characteristics of a new watershed data base.
First type the file name (without extension) under which the WOB will be saved and the file name (without extension) of ROB from which it will be created. A title or comment identifying the data base may be added next.
The geographical area within which ail pertinent data should be has also to be entered. Ali subsequent operations in the WOB will be performed only on the data within that geographical area rather th an on the larger ROB geographical area, in other words, on a subset of the ROB data set. Enter the longitude and latitude of the lower left corner and of the upper right corner of the area. Since PHYSITEL works exclusively with a UTM projection, the UTM zone is necessary to transform the coordinates of the corners into that projection.
The grid size (in meters) used for spatial integration is given next. Remember that the grid size must be greater or equal to the resolution of every file of the regional data base you plan to import in the watershed data base. The cells obtained from that process will be the basis for the second spatial integration into homogeneous hydrological units available with PHYSITEL 2.0.
DEFINE NEW WATERSHED DATA BASE
... Watershed data base name:
... From regional data base:
... Title or comment identifying the data base:
... Geographical area:
-Lower left corner (deg min.dec):
-Upper right corner (deg min.dec):
... UTM zone: a
... grid size(m):
Fla: store information
x
a
LONG.
O.OOOW
O.OOOW
ya
FIGURE 2.24 Sub-menu #2.1: define new watershed data base.
2.3.2.2 Sub-menu #2.2: existing watershed data base
LAT.
O.OOON
O.OOON
ESC:QUIT
Apart from two user's defined tasks, five options are offered in sub-menu #2.2 (figure 2.25).
First, a particular WDB has to be selected as the current data base, using option 1. The header of the WDB, containing the characteristics of the data base defined in
sub-them.
Option 6 should be selected if the user wants to export files.
MAIN MENU
11. WATERSHED DATA BASES
2.-O. l.
--=
2. EXISTING WATERSHED DATA BASE
O.
--=
1. Data base selection;
2.- Header of selected data base;
3.- File content of selected data base;
4.- Add or Edit files;
5.- Display files;
6.- Export files;
7.- User's defined task #1;
8.- User's defined task #2;
0.- Return to previous menu.
FIGURE 2.25 Sub-menu #2.2: existing watershed data base.
2.3.2.2.1 Sub-menu #2.2.1: data base selection
A list of existing WDB is produced when sub-menu #2.2.1 is chosen (figure 2.26). Select the WDB on which you want to work by placing the cursor on that data base name and then pressing "ENTER". The name of the current data base before selection appears in the lower left corner of the menu.
- Clifton.ASC: mean altitude of each square (m), ASCII file. This file has 227 rows by 280 columns. Each ail is 78 m by 78 m. The UTM coordinate of the lower left corner is 297295,5008010 and the coordinate of the upper right corner is 319135,5025716;
- Clifton.SR8: land-use data for each square; imatel file/SR8 format). This is not a classification of the Clifton basin and it's purpose is only to provide the user with a file in the correct format so that be can test the program.
- File structure for ASCII file (Clifton.ASC):
- matrix of altitudes of each square entered row by row. Each value is separeted by one or more space, a tab or a new line. There is no header.
- File structure for land-use data (Clifton.SR8): - this is the SR8 format used by IMATEL 1.0. - Header: 2048 bytes:
The first 256 bytes contain informations on the number of lines and columns in the image, the pixel size and the origin of the image in metric coordinates. The following 768 bytes contain the look-up table used to display the image. The final
- Clifton.ALT: mean altitude of each square (m);
- Clifton.ORI: aspect of each square to eight points of the compass, identified 1 to 8 counterclockwise fram East (= 1);
- Clifton.PTE: slope of each square (mjm);
- Clifton. MSK: basin mask; - Clifton.CLA: land-use data;
- Clifton.REL: downstream link file name;
- Clifton.SB (= Clifton.ZON): sub-basin (homogeneous hydrological units) file name.
- File structure for *.ALT, *.ORI, *.PTE, *.MSK, *.REL, *.zON; see appendix B.
2.2.4 Starting PHYSITEL 2.0
Change to the directory in which you have your program files and type "PHYSITEL - e" to access the English version of PHYSITEL. When "PHYSITEL" appears on the screen, push any key and the main menu will appear. Vou are now ready to start your session with PHYSITEL 2.0.
2.3 USING PHYSITEL 2.0
The main menu of PHYSITEL 2.0 contains 2 options (figure 2.3) allowing access to either regional or watershed data bases.
Vou can select either option by using the arrows on the key board and pressing "ENTER". It is also possible to select an option by typing its number directly. At the end of a session, it is possible to exit PHYSITEL 2.0 by selecting "EXIT" and pressing "ENTER" or by typing "0".
CUF
WTEST
CUHON
CUF2
Current data base:
FIGURE 2.26 Sub-menu #2.2.1: data base selection.
2.3.2.2.2 Sub-menu #2.2.2: header of selected data base
ESC:
QUITThe header content of the selected WDS is shown in sub-menu #2.2.2 (figure 2.27) for information purposes only. No action can be taken. Return to the previous menu by striking any key.
HEADER OF SELECTED DATA BASE
Watershed data base name: clif
From regional data base: sudquec
Description of data base:
Base de donnee pour le bassin de la riviere clifton
Cartographie projection: UTM
Caracteristics: zone: 19
Geographical area:
Lower left corner:
Upper right corner:
Grid size(m):
EASTING
290000
320001
1000
Please strike any key to continue
NORTHING
4999000
5029001
1000
FIGURE 2.27 Sub-menu #2.2.2: header of the selected data base.
2.3.2.2.3 Sub-menu #2.2.3: file content of selected watershed data base
Sub-menu #2.2.3 shows the name of the WDB, together with a Iist of files currently in the WDB (figure 2.28). A return to the previous menu is obtained by striking any key.
CUF .ASP
CUF.DB
CUF.DEP
CUF.DLK
CUF.FI2
CUF. FIL
CUF. FLA
CUF .HIG
CUF. ID
CUF.LOW
CUF. LPT
CUF.LU
CUF .MNT
CUF .NET
CUF .OR2
CUF .OR3
CUF .OR4
CUF .OR5
CUF .OR6
Ori. corrigees en determinant reseau .net avec fichier .db
DATABASE avec .fil, .pte et .ori
DEPRESSIONS avec base de donnees .db et OUTLETS .out
DOWNSTREAM LINKS de .asp, .net, .sb
D.E.M. filtre a partir du fichier clif.mnt
FLAT AREAS avec base de donnees .db et .lpt
HIGH VALUES du fichier clif.fil
Base de donnee pour le bassin de la riviere clifton
LOW VALUES DU FICHIER CLIF.FIL
local pits avec fichier .fil, *ori
LAND-USE land-use land-use
D.E.M. obetenue a partir du fichier sudquec.mnt
NETWORK a partir de la BD .db et ex:299000, 5022000
orientation du fichier clif.fil avec differences finies
ASPECTS
Orientations corrigees a la main
ASPECTS orientation
ASPECTS orientations du fichier clif.or6
Please strike any key for more
FIGURE 2.28 Sub-menu #2.2.3: file content of selected watershed data base.
2.3.2.2.4 Sub-menu #2.2.4: add or edit files
Sub-menu #2.2.4 (figure 2.29) gives access to the main tasks related to the preparation ofaWOB.
Option 1 is selected if raster data have to be spatially integrated according to the grid spacing specified when the database was defined (sub-menu #2.1).
Option 4 can be used to define and process sub-basins.
Option 5 is to be used for the spatial integration of land-uses classes from various sources.
Option 6 allows editing of the files.
Options 7 and 8 allow the user to add his own tasks, see appendices.
MAIN MENU
11. WATERSHED DATA BASES
2.
-O. 1.
~
2.-
-EXISTING WATERSHED DATA BASE
O.
~
1. Data base selection;
2.-
Header of selected data base;
3.-.---~
4.-
ADD OR EDIT FILES
5.-6.-
1. Raster data integration;
7.
2.-
Vector file import;
8.
3.-
Watershed topography and mask;
O.
4. Sub-basins processing;
---- 5. Land-use;
6.-
File editing;
7. User's defined task #1;
8.-
User's defined task #2;
0.= Return to previous menu.
FIGURE 2.29 Sub-menu #2.2.4: add or edit files.
2.3.2.2.4.1 Sub-menu #2.2.4.1: raster data integration
If raster data have to be spatially integrated, sub-menu #2.2.4.1 is chosen (figure 2.30). This may be the case for a D.E.M. data file.
Then an integration pracess is chosen. Only one integration pracess in which the mean areal value is computed is available in PHYSITEL 2.0. Two user's defined processes can be added (see appendices).
Type "F10" to run the task. Ali other needed informations are obtained fram the header file of the WOB.
MAIN MENU
11. -
WATERSHED DATA BASES
2.
-O.
- 1.-' - - -
2. EXISTING WATERSHED DATA BASE
-O.
--
1. -Data base selection;
2. Header of selected data base;
-3.
4.
--ADD OR EDIT FILES
15.
-6.
- 1. -RASTER DATA INTEGRATION
7.
-2.
-8.
-3. ... File name in RDB:
-sudquec .
O.
-4.
-... File name in WDB:
cl
if.-
5.
-6.
-Integration process:
17.
-1 - Mean value(single variable)
8.
-2 - user's defined integration process #1
o.
-3 - User's defined integration process #2
It is possible to import vector files fram the RDB to the WDB by type the extensions of the files names in those bases. Press "F10" to store the information. Note that no task is pragrammed to use vector files in PHYSITEL 2.0.
MAIN MENU
11. -
WATERSHED DATA BASES
2.
-O.
- 1.-' - - -
2.
EXISTING WATERSHED DATA BASE
-O.
--
1. -Data base selection;
2.
-Header of selected data base;
3.
-4.
-ADD OR EDIT FILES
5.
-6.
- 1.-7. 2.
- -VECTOR FILE IMPORT
8. 3.
--O.
-4.
-... RDB's file name: sudquec .
-
5.
-... WDB's file name:
cl
if .6.
-7.
-FIO: store information
ESC:QUIT
8.
O.
=
Return to previous menu.
FIGURE 2.31 Sub-menu #2.2.4.2: vector file import.
2.3.2.2.4.3 Sub-menu #2.2.4.3: watershed topography and mask fram WDB files Sub-menu #2.2.4.3 (figure 2.32) gives access to ail tasks necessary to defined the drainage network upstream of a particular point on a river and th us the area covered by the watershed corresponding to that network.
Option 1 is selected to pre-process the DEM file in order to obtain a smoother variation of elevation from point to point.
Option 4 is a special group of tasks permitting to make the necessary modifications for points or groups of points causing interruptions in the drainage network.
Option 5 allows determination of the drainage network. This option should be selected when ail necessary modifications have been done.
Two more user's defined functions can be added with PHYSITEL 2.0 (see appendices).
MAIN MENU
11. WATERSHED DATA BASES
2.
-O. 1.
~
2.- EXISTING WATERSHED DATA BASE
-O.
~
1. Data base selection;
2.= Header of selected data base;
3.4.- ADD OR EDIT FILES
5.
-6. 1.
7.- 2.- WATERSHED TOPOGRAPHY AND MASK FROM WDS FILES
8.-
3.-0.- 4.- 1. DEM preprocessing;
~
5.- 2.- Slope determination;
6. 3. Aspect treatment;
7. 4.- Local pit processing;
8. 5.- Drainage network
&
mask determination;
O. 6. User's defined application #1;
~
7.- User's defined application #2;
0.= Return to previous menu.
Two options are accessed by sub-menu #2.2.4.3.1 (figure 2.33) for pre-processing purposes of the original DEM file.
Option 1 is selected if filtering of the original file is wished. Erroneous values in the file resulting in extreme (minima or maxima) values can be removed if option 2 is selected.
MAIN MENU
11. -
WATERSHED DATA BASES
2.
-O.
- 1.-' - - -
2. EXISTING WATERSHED DATA BASE
-O.
-- 1. -
Data base selection;
2. Header of selected data base;
-3.
-4.
-ADD OR EDIT FILES
5.
-6.
- 1.-7. 2. WATERSHED TOPOGRAPHY AND MASK FROM WDB FILES
--8. 3.
--O.
-4.
- 1. -DEM PREPROCESSING
-
5.
2.
6.- 3.-
1._Fil teri ng;
7.
4.
2. Removal of local extreme values;
8.-
5.-
0.= Return to previous menu.
O.
-6.
7.- User's defined application #2;
'
-0.= Return to previous menu.
FIGURE 2.33 Sub-menu #2.2.4.3.1: DEM preprocessing.
2.3.2.2.4.3.1.1 Sub-menu #2.2.4.3.1.1: filtering
First enter the name of the file to be filtered (usually the original filename) and that of the filtered file (figure 2.34). In practice, only extensions to the filenames have to be given as ail file in the WDS differ only by their extensions.
Press "F10" to execute the task. It is also possible to display either the file to be filtered or the filtered file by pressing "F1". The name of the file to be displayed is then asked for. Press any key to come back to menu.
MAIN MENU
1l. -
WATERSHED DATA BASES
2.
-O.
- l.--
2. EXISTING WATERSHED DATA BASE
-O.
-- l. -
Data base selection;
2. Header of selected data base;
-3.
4.
--ADD OR EDIT FILES
15.
-6.
- l. -FILTERING
7.
-2. WATERSH
-8.
-3.
- .---... Original DEM file name in WDB:
cl
if.O.
-4.
- l. -DEM ... Filtered DEM file name in WDB:
cl
if .-
5.
-2.
-6.
-3.
- l. -... Filter to be used:1
7. 4.
- -2.
-1 - Default 3x3 fil ter
8.
-5.
-O.
-2 - User's defined filter #1
O.
6.
' - - -3 - User's defined filter #2
-
-' - - -
7.
Use
-O.
-Ret F1:DISPLAY
F10:RUN
ESC: QUIT
Enter the name of the DEM file (filtered or unfiltered) from which you want to remove those extreme values. Next, enter the filename under which you want to store the maxima and that for the minima. Storing the extreme values gives the user the possibility to decide that a particular value is not a wrong value but corresponds to a true value on the terrain.
Press "F10" to execute the task and "F1" to display the file before and/or after removal of the extreme values.
MAIN MENU
1l. -
WATERSHED DATA BASES
2.
-O.
- l.--
2.
-EXISTING WATERSHED DATA BASE
O.
-- l. -
Data base selection;
2.
-Header of selected data base;
3.
-4.
-ADD OR EDIT FILES
5.
-6. - l.
-7.
-2.
-WATERSHED TOPOGRAPHY AND MASK FROM WDB FILES
8. 3. - - 1
O.
-4.
- l. -DEM
-
5. 2.
- -REMOVAL OF LOCAL EXTREME VALUES
6. 3. - - l.
-7. 4. 2.
... DEM file name in WDB:
cl
if. 8.-5.-
0.-... File name of high values:
cl
if.O.
6. '---.... File name of low values:
cl
if .-
--
7.
-Use
o.
-Ret
Fl:DISPLAY
FlO: RUN
ESC:QUIT
the DEM file in the WDB, followed by the filename you want to give to the slope file. Remember that only extensions need be given.
The method used to determine the slope is chosen next. With PHYSITEL 2.0, only option 1 is available but it is possible to add user's defined methods of determination (see appendices).
Press "F10" to run the task and "F1" to display the slope file.
MAIN MENU
1l. -
WATERSHED DATA BASES
2.
-O.
- l.-' - - -
2.
EXISTING WATERSHED DATA BASE
-O.
-' - - - l.
Data base selection;
-2. Header of selected data base;
-3.
4.
--ADD OR EDIT FILES
15.
-6.
- l. --
SLOPE DETERMINATION
7.
-2. WAT
-8. 3.
- -... DEM file name in WDB
O.
-4.
- l. -(filtered or unfiltered):
cl if.
-
5.
-2.
-... Slope file name
.
.
cl if.
6. 3.
--7. 4.
- -... Method to be used: 1
8.
-5.
-1 - Default slope determination;
O.
-6.
-2 - User's defined slope determination;
-
7.
ln sub-menu #2.2.4.3.3 (figure 2.37) two options are offered. A first determination of aspect is obtained by using option 1. Then option 2 may be used, more or less as a filter, to correct particular aspect directions with the help of both the slope and the DEM files. This happens, for instance, if two contiguous si opes are in opposite direction, as computed previously.
MAIN MENU
11. WATERSHED DATA BASES
2.
-O. l.
~
2.- EXISTING WATERSHED DATA BASE
O.
-~
1. Data base selection;
2.- Header of selected data base;
3.-~---~
4.- ADD OR EDIT FILES
5. -6. l.
7.- 2.- WATERSHED TOPOGRAPHY AND MASK FROM WDB FILES
8.-
3.-0.- 4.- 1. DEM preprocessing;
~ 5. - 2. - .---,
6.- 3.- ASPECT TREATMENT
7.-
4.-8.- 5.- 1. Aspect determination;
ation;
O. 6. 2.- Correction of aspect;
~
7.- 0.- Return to previous menu.
0.-
-FIGURE 2.37 Sub-menu #2.2.4.3.3: aspect treatment.
2.3.2.2.4.3.3.1 Sub-menu #2.2.4.3.3.1: aspect determination
ln order to compute aspect directions, enter the filename of the DEM file you want to use and then the filename of the aspect file that will be created (figure 2.38).
Option 1 uses finit differences.
Option 2 chooses the lowest of the 8 nearest neighbors of a pixel as the aspect of that pixel.
Press IF10" to run the task and IF1" to display the aspect file.
MAIN MENU
11. -
WATERSHED DATA BASES
2.
-O.
- 1.--
2.
-EXISTING WATERSHED DATA BASE
O.
-' - - - 1.
Data base selection;
-2. Header of selected data base;
-3.
- 14.
-ADD OR EDIT
5.
-ASPECT DETERMINATION
6.
- 1.-7.
-2. WATERSH ... DEM file name in WBD
-8. 3.
(filtered or unfiltered):
cl
if.0.-
4.-
1. DEM ... Aspect file name
.
.
cl
if .' - - -
5.
2.
--
-6.
-3. ASP ... Method to be used: 1
-7.
-4.
-1 - Finite differences;
8.
-5.
- 1. -2 - Lowest of 8 nearest neighbors;
O.
-6.
-2.
-3 - User's defined aspect determination;
' - - -
7.
O.
-
If a few aspect directions have to be corrected, it is possible to do so. The following task will make use of informations coming from the DEM, slope and aspect files to check conflicting directions that make the correction necessary. Enter the filenames of the previously created DEM, slope and aspect files (figure 2.39), as weil of the file name under which the corrected aspect file will be saved, and press IF10" to run the task. The corrections are made directly to the aspect file. The corrected aspect file may be displayed by pressing IF1".
MAIN MENU
1I. -
WATERSHED DATA BASES
2.
-O.
- I.-' - - -
2.
EXISTING WATERSHED DATA BASE
-O.
-' - - - I.
Data base selection;
-2.
-Header of selected data base;
3.
-4.
-ADD OR EDIT FILES
5.
-6.
I.7.
--2.
--WATERSHED TOPOGRAPHY AND MASK FROM WDB FILES
l
8. 3.
--O.
-4.
- I. -DEM CORRECTION OF ASPECT
' - -
5. 2.
.---
-6.
-3.
-ASP ... DEM file name
·
·
cl
if.7. 4.
- -... Slope file name
·
·
cl
if.8. 5.
- - I. -... Aspect file name
·
·
cl
if.O.
-6.
-2.
-... Corrected aspect file name
·
·
cl
if.' - - -
7.
O.
-O.
' - - -Fl:DISPLAY
FlO: RUN
ESC:QUIT
altitude is lower than ail surrounding points or by a group of such points, ail at the same altitude and forming a fiat area. The tasks accessed by sub-menu #2.2.4.3.4 (figure 2.40) are designed to find an outlet for such points or fiat areas.
Option 1 is used to locate ail local pits (single point).
A temporary working data base regrouping ail information on each point must be created with option 2 to facilitate the other options.
Option 3 give access to the task permitting to find an outlet from local pits or fiat areas blocking normal drainage.
Option 4 is used to complete the work for ail uptream points whose normal drainage was blocked previously.