HAL Id: inria-00568186
https://hal.inria.fr/inria-00568186
Submitted on 22 Feb 2011
HAL is a multi-disciplinary open access
archive for the deposit and dissemination of
sci-L’archive ouverte pluridisciplinaire HAL, est
destinée au dépôt et à la diffusion de documents
Vincent Mahe, Salvador Martinez Perez, Guillaume Doux, Hugo Bruneliere,
Jordi Cabot
To cite this version:
Vincent Mahe, Salvador Martinez Perez, Guillaume Doux, Hugo Bruneliere, Jordi Cabot.
POR-TOLAN: a Model-Driven Cartography Framework. [Research Report] RR-7542, INRIA. 2011, pp.27.
�inria-00568186�
a p p o r t
d e r e c h e r c h e
3 9 9 IS R N IN R IA /R R --7 5 4 2 --F R + E N G Thème COMP
ORTOLAN
: a Model-Driven Cartography
Framework
Vincent Mahé — Salvador Martinez Perez — Hugo Brunelière — Guillaume Doux — Jordi
Cabot
N° 7542
Vincent Mahé , Salvador Martinez Perez , Hugo Brunelière , Guillaume Doux ,
Jordi Cabot
Thème COM — Systèmes communicants Projets AtlanMod
Rapport de recherche n° 7542 — Janvier 2011 — 24 pages
Abstract: Processing large amounts of data to extract useful information is an essential task within
companies. To help in this task, visualization techniques have been commonly used due to their capacity to present data in synthesized views, easier to understand and manage.
However, achieving the right visualization display for a data set is a complex cartography process that involves several transformation steps to adapt the (domain) data to the (visualization) data format expected by visualization tools. To maximize the benefits of visualization we propose Portolan, a generic model-driven cartography framework that facilitates the discovery of the data to visualize, the specification of view definitions for that data and the transformations to bridge the gap with the visualization tools. Our approach has been implemented on top of the Eclipse EMF modeling framework and validated on three different use cases.
Résumé : Traiter de grands volumes de données pour en extraire des informations utiles est une tâche
essentielle au sein des entreprises. Pour faciliter cette tâche, les techniques de visualisation ont été communément utilisées, du fait de leur capacité à présenter les données dans des vues synthétiques, plus faciles à comprendre et à gérer.
Cependant, obtenir la bonne représentation visuelle pour un ensemble de données est un proces-sus complexe de cartographie qui implique de nombreuses étapes de transformation pour adapter le format des données du domaine au format des données de visualisation attendu par les outils de visualisation. Pour maximiser les avantages de la visualisation, nous proposons PORTOLAN, un environnement générique de cartographie dirigée par les modèles qui facilite la découverte des données à visualiser, la spécification des définitions de vues sur ces données, et les transformations pour franchir la distance avec les outils de visualisation. Notre approche repose sur les composants Eclipse EMF Modeling et a été validée sur trois différents cas d’utilisation.
1
Introduction
Business data is a key asset in any company. Efficient analysis and understanding of this data can bring a significant competitive advantage. Visualization techniques have been largely used for this purpose since the beginning of computer science, from the earlyAPE dataflow toolkit[9], the HY+ visualization system[7], AVS[23], to the INFOVIStoolkit[11].
Nevertheless, good data visualizations are not trivial to obtain. Visualization itself is a complex process with its own techniques, formats and tools which are different from those used in the business domain. Therefore, business data must be processed (e.g. to select the subset we want to visualize) and then transformed to the format expected by a given visualization tool.
This process, from raw data to a useful visualization, is a complex process which needs to be managed in itself. It includes several intermediate steps in order to get appropriate data, translate them to other formats, merge them, bind them to corresponding visual items, and give users an appropriate interface to play with the data shown in the views. Until now, this process has been generally created in an hard-coded and adhoc manner (i.e. only useful for a given visualization tool and/or for a specific business domain).
In this paper, we present an unified framework to deal with all these steps in a more homoge-neous way. We refer to this framework as a cartography framework1. Moreover, our framework is based on the use of Model-driven engineering techniques (MDE). MDE advocates the use of models as key artefacts in all software engineering activities. Representing the different components and manipulations in the cartography as models and model transformations, we can manage all cartog-raphy elements in a more homogeneous way. Therefore, the translation from raw business data to visualization can be expressed as a set of model transformations.
In this sense, the contributions of this paper are threefold. First we define, to the best of our knowledge, the first complete Model-Driven Cartography process. We have identified four high level tasks and the different kinds of actors that are needed to bridge the gap between raw data and visualization. Secondly, we predefine several of the (modeling) elements needed in the process, as the cartography metamodel. Finally, we provide an extensible tool support in the form of a ready-to-use platform that can be easily tailored to the needs of each given domain.
This paper is structured as follows: this introduction is followed by a general presentation (sec-tion 2) of our approach. The three contribu(sec-tions are detailed in next sec(sec-tions: the Cartography Metamodel in section 3, the Model-Driven Cartography process in section 4 and, in section 5, our implementation, the PORTOLANplatform. Three use cases illustrate the different features of our approach in section 6. Section 7 compares with the related works, followed by the conclusions and further work in section 8.
2
Overall View of Model-Driven Cartography
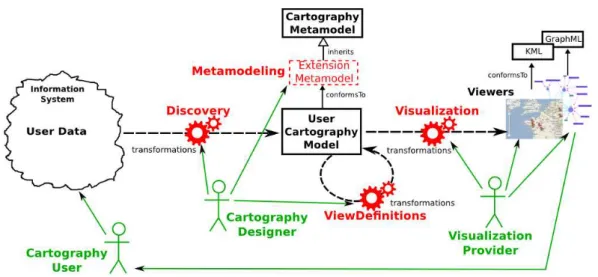
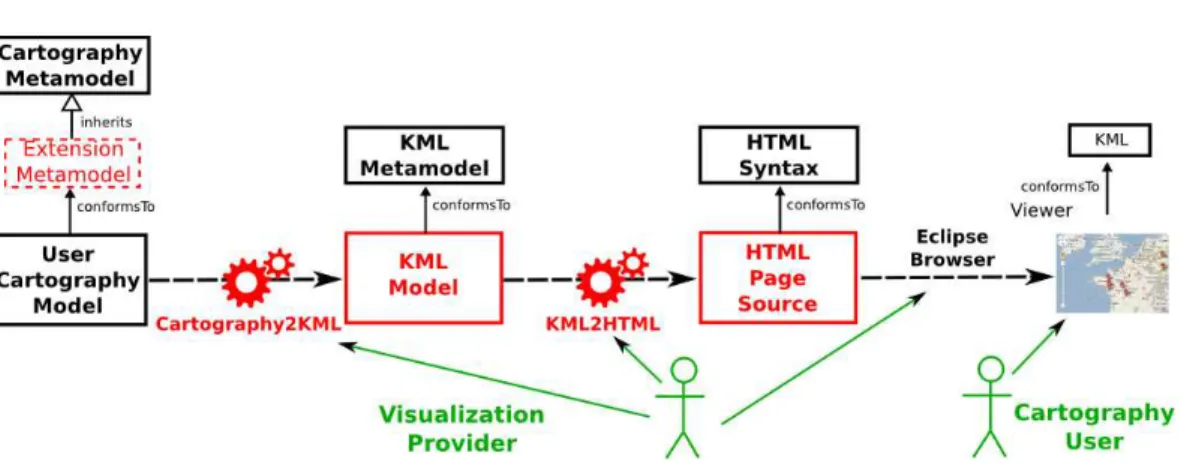
Our model-driven cartography process is built around a pivot cartography metamodel that acts as an intermediate representation in the chain of transformations needed to go from raw data to
Figure 1: Model-Driven Cartography
alization. This intermediate representation facilitates the resue of most of the cartography elements across different domains. In this section, we introduce this metamodel, the process around it and the tool support we provide. All these concepts are then detailed in the next sections.
2.1
Cartography Metamodel
To deal with the data-to-visualization issues, we rely on a model-driven mechanism. A dedicated metamodel is thus needed to provide a uniform representation for the data to be visualized. We have designed an all-purposes Cartography Metamodel (on top of Fig.1) with generic types (as Entity or Relationship) useful for visualization purposes. The user’s data is then expressed in an User Cartography Model (center of the schema) which conform to this (possibly extended) metamodel.
After, this data is used as input of several viewers (right side of Fig.1) able to read data conform-ing to this cartography metamodel and transform it into visual items (nodes, edges,etc).
2.2
Cartography Process
A cartography process can be summarized in four high-level tasks (built around the previous cartog-raphy metamodel) required in the data-to-visualization process for any given domain:
1. Metamodeling: capture the structure of the domain concepts to be visualized. If necessary, the cartography metamodel can be extended to tailor it to the concepts of the input domain; 2. Discovery: inject user data into a central cartography model which conforms to the domain
3. View Definitions: filter the data in the user cartography model to get partial and/or computed views of it to be visualized;
4. Visualization: obtain graphical displays of user’s data as defined in the previous views. As part of the process definition, we have identified three different kinds of actors that should take part in it:
• Cartography User: he is the person the whole cartography is designed for; he provides its
data as input of the process and use the corresponding viewers to visualize and take decisions
from the generated views; he does not need skills in MDE nor in Cartography;
• Cartography Designer: he is an engineer with enough skills in MDE to be able to specify the
domain metamodel extension, to chain and use discovery tools (generating the user central
cartography model) and to write useful view definitions;
• Visualization Provider: it can be an external company or organism, which builds pluggable model transformations and visualization tools relying on the cartography metamodel; the visualization may be provided as a component-on-the-shelf.
The data translations needed in our cartography approach rely mainly on the Model-Driven In-teroperability principle, as proposed by Bézivin et al.[3]. This is a major benefit of using MDE for Cartography.
2.3
Tool Support
The characterization of these four high level tasks, with the identification of the three kinds of users, has driven to an effective implementation of our approach in a Model-Driven Cartography platform. The developed tooling is based on Eclipse and available as an open-source application6.
This platform provides MDE components related to the visualization framework, and ready-to-use tools which handle most parts of the Cartography process. They can be extended and tuned to user’s specific needs.
3
Cartography Metamodel
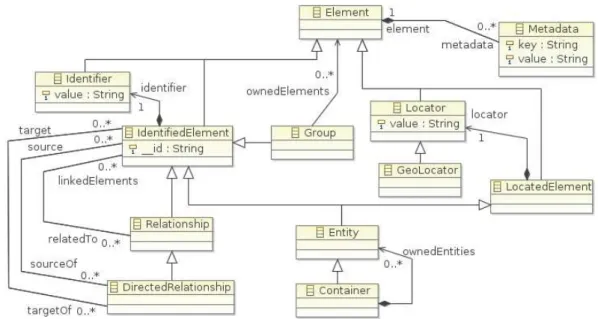
Our cartography metamodel provides an intermediate and generic representation for all kinds of domain. The cartography metamodel contains all important concepts needed to achieve a proper data visualization. This core metamodel is presented in Fig. 2. Table 1 lists the main concepts of the metamodel (right column) and the visualization requirements that motivate their presence (left column).
This metamodel can be used as-is, but users can also extend it to adapt it to the important concepts in their domain, by creating a kind of Domain Specific Language (DSL) for cartography. However, we have to notice that, as the visualization part relies only on the core metamodel types (with possible identification of the effective type of each instance through reflexivity), it is generic and domain-agnostic.
Figure 2: Cartography generic metamodel
Task and what it implies Corresponding Types
A view has to display a name for each node IdentifiedElement (or
Entity) and itsIdentifier
Maps, geographical or not, need to locate elements LocatedElement
(Entity), and Locator
(GeoLocator) Graphs require linking related elements together Relationship
Some relations are one-way DirectedRelationship
A grouping/ containment notion is important to cluster
data
Group,Container
Each item may have specific individual properties, imply-ing a type object[15] mechanism
Metadata
4
Model-Driven Cartography Process
We detail here the four high level tasks of a Model-driven Cartography process that we introduced in section 2.2: Metamodeling, Discovery, View Definitions, and Visualization.
4.1
Metamodeling of the domain
The metamodeling step consists in the specification of the targeted user’s domain, as an extension of the cartography metamodel. Three cases are relevant:
• the Cartography core metamodel can be used as-is by customers, who will then build the discovery tools and generate the central model using only the core metamodel types (illustrated in Fig. 2);
• the Cartography metamodel can be extended by an engineer (the Cartography Designer role) to add types closer to the user domain. These new types are linked to the core ones through inheritance relationships. In this case, the first steps in the metamodeling phase are devoted to specifying the main concepts of the domain and deciding the base class in the core metamodel for each of them. The resulting types of the metamodel extension define a cartography DSL for the domain, enabling the corresponding tooling, transformations and modeling of the domain. An example of such a DSL is visible in Fig. 12, illustrating this modeling initial step on a domain which concerns software tools.
• an existing domain metamodel can also be reused as cartography metamodel if the cartography designer is able to define inheritance relationships with the core metamodel types. This also affects the relations between elements. References must be reified in order to inherit from (Directed)Relationshipcore type; Fig. 13 illustrates this case.
These three cases have been experimented (see section 6), validating this metamodeling phase.
4.2
Discovery of the Data
The goal of this step is to transform raw data from different sources (and coming from different technical spaces[17]), provided as-is by the final user (the Cartography User actor), into a central cartography model which conforms to the (possibly extended) core cartography metamodel. These tasks are handled by an engineer with skills in MDE (Cartography Designer role).
This phase is expressed as a sequence of text-to-model and model-to-model transformations. A classical discovery chain is composed of the following steps:
1. An injection process takes the raw data and transforms it into a model-based representation. For instance for XML-based raw data, a predefined XML injector express this data as an instance of the XML metamodel. At this stage, the structure of the data has not been changed, only the nature of its representation has been modified from XML to model. The main benefit of this step is that the data is, now, expressed as a model which we can directly use all MDE techniques on to manipulate this data.
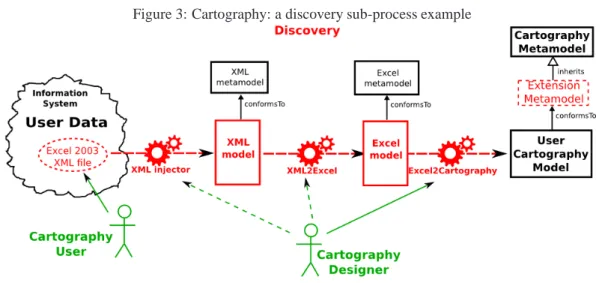
Figure 3: Cartography: a discovery sub-process example
Figure 4: Cartography: a discovery sub-process example
2. A first model-to-model transformation, depending on the nature of raw data format, takes the injected model and transforms it into a domain model. Following the previous example, in this step the information included in the XML model is extracted and represented as a domain model instance of an appropriate domain metamodel for the user’s activity. E.g., if the XML-based raw data included information about personnel of a company, in this step, this data is expressed in terms of a HHRR2metamodel. In short, this domain metamodel corresponds to the elements in the XML Schema for the raw data.
3. The domain model then needs to be mapped to a cartography model. A model-to-model trans-formation (written by people with knowledge of both data domain and the core metamodel) takes care of this. The key task in this step is to select the most appropriate cartography concept for each domain element.
4. If multiple sub-processes are involved, a merging transformation produces the final result of the Discovery task.
We illustrate such a sub-process on an example from an Excel data file to the central model using an XML injector and two model transformations (Fig. 4):
1. The Cartography User brings a data file in MS Excel 2003 XML format;
2. The engineer (Cartography Designer) runs a XML injector on this XML textual file to gener-ate the corresponding model (which then conforms to the XML metamodel);
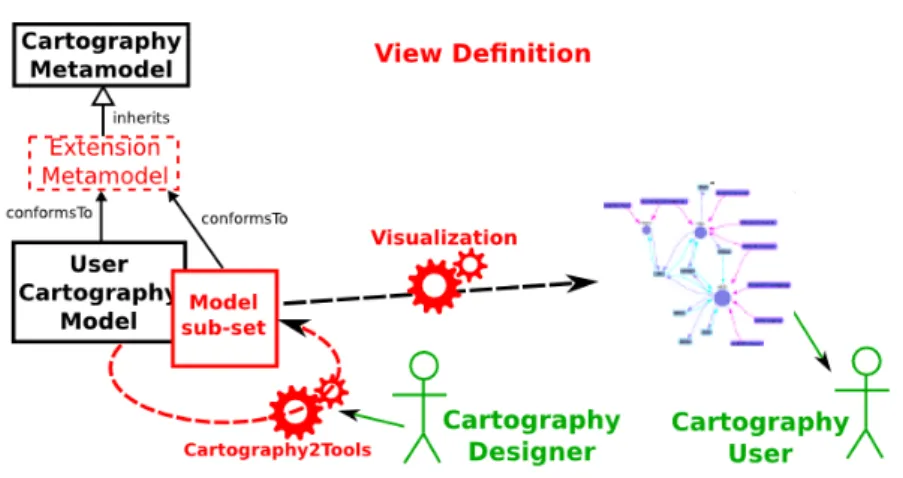
Figure 5: Cartography: an example of a view definition
3. This engineer then processes the previous output XML model with an existing XML2Excel transformation which explores the XML model and generates the underlying Excel items, as a model which conforms to the Excel metamodel (with Worksheet,Table,Row,Column
types);
4. As the last step implies domain specific elements and structure, the corresponding model-to-model transformation must be written by the Cartography Designer, with some knowledge of the content of the Excel file; the transformation processes its rows (as elements of the model) depending on their specific structure and cells and on the corresponding types within the user’s extension of the cartography metamodel;
5. As all the data were provided within the same Excel file, no additional transformation is needed here in order to merge all generated cartography models in one central model. This Discovery phase reuses many MDE components which already exist (for instance the ATL Zoo3includes more than 200 transformations to exchange data between different formats).
4.3
Edition of the View Definitions
View Definitions are transformations of the (extended) cartography model to filter the data and/or compute derived information that must be visualized. They are expressed as model-to-model trans-formations. The result is another cartography model that still conforms to the same cartography metamodel. This subset can then be processed as the original one by the provided visualizations.
The principle of view definitions is illustrated (Fig. 5) on an example relying on a DSL similar to Fig. 12, with a transformation which computes direct links betweenTool instances over the correspondingFormatinstances:
1. An engineer (the Cartography Designer role) writes a Cartography2Tools transformation tak-ing the central cartography model as input and a model conformtak-ing to the same metamodel as output; it generates only the instances of Tool type in the destination model and computes relationships between tools by replacing Format instances and corresponding links to tools by direct Export/Import instances;
2. The resulting subset model, as it relies on the same metamodel, but with onlyToolentities and
Export/Importdirected relationships, can then be processed by provided visualizations as if it was the central model;
3. The Cartography User gets the corresponding display, which is a filtered view (Toolnodes linked byExport/Importedges) of the whole picture.
The main expectation for such edition work is to give engineers an access to a model-driven workbench with the required environment for editing view definitions. As view definitions rely on model-to-model transformations, a transformation language environment (including an editor, outline, debugger, compiler, etc) is mandatory in a dedicated Cartography environment.
4.4
Visualization of the Model
Visualization components can be provided by external Visualization Providers. Each visualization relies on a specific viewer and a dedicated transformation chain. This chain is a process opposite to the Discovery one, as it takes a cartography model as input and generates raw (often textual) data files which can be read natively by the targeted viewer:
1. A model-to-model (view-oriented) transformation changes the cartography model into a visu-alization model which conforms to the viewer metamodel.
2. Another model-to-model (data-oriented) transformation takes the viewer model and translates it to the targetted textual syntax as a model embedding the visualization items.
3. A model-to-text transformation re-expresses this model into the textual description format expected by the viewer. This file is generated by an extractor component.
4. The final textual file can be directly read by the viewer which displays the corresponding tree, graph, or other visualization. The Cartography User can then manipulate the view in order to better understand and analyze the business data.
Our tool (section 5) embeds the metamodels corresponding to the formats needed by several viewers. We have used existing metamodels (like GraphML, from a previous project4) and we de-fined the common ones that were lacking (such as the KML one) to provide a ready-to-use platform. An example of such visualization process produces GoogleMaps visualization for the geo-located elements of the user’s cartography model (Fig. 6):
Figure 6: Cartography: one visualization process
1. A model-to-model Cartography2KML transformation, written by the Visualization Provider of a GoogleMaps view, processes the central cartography model and creates, for each Locat-edElementinstance which has aGeoLocatorkind as itslocatorattribute, an element into a GoogleMaps model which itself conforms to the Keyhole Meta Language (KML)5;
2. The output KML model is processed within an EMF-based program which takes the KML items and generates an HTML page source with the corresponding KML tags;
3. The HTML textual source corresponding to the KML model is passed to the internet browser embedded within Eclipse;
4. The code of the HTML page calls the GoogleMaps viewer and pass the KML data to it, which displays the user’s items on the corresponding map.
The visualization component can be provided with internal mechanisms which hide the whole chain, so the user only sees a button to launch the chain and automatically gets the final result in the display.
5
Tool Support of Model-Driven Cartography
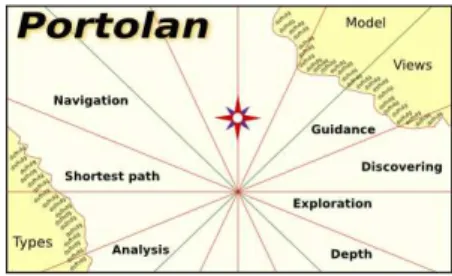
As portolans were first nautical charts to help navigation in 14thcentury, the PORTOLANapplication (Fig. 7) aims to help decision-makers to explore, discover, navigate, analyze the collections of data of their company.
The PORTOLANCartography Framework6 is our implementation of the Model-Driven Cartogra-phy approach presented in this report. In order to be fully usable as an implementation, the platform
5KML: http://code.google.com/apis/kml/
Figure 7: PORTOLAN
provides default generic components for each of the four steps identified in our approach, providing a ready-to-use Cartography toolbox. As an effective platform, it demonstrates the feasibility of our conceptual proposal.
The next sections detail the main features and underlying architecture of the PORTOLAN plat-form.
5.1
Overview
The PORTOLANprototype embeds two main perspectives (in the Eclipse sense), each of them ad-dressing distinct sets of users:
1. the Decision-Maker perspective (Fig. 8), centered on visualization aspects, allows graphi-cal display, navigation and manipulation of the user’s data; the goal is to efficiently help the decision-maker to better understand the situation, and then take appropriate decisions; the decision-maker perspective can be considered as the end-user application offered by the pro-totype; it targets the Cartography User actor early defined in our approach; this perspective hides the cartography process, so its user only sees the final set of available visualizations; 2. the Engineer perspective (Fig. 9) is centered on discovery work and definition of views; it
allows to define and customize transformations, according to specified criteria and constraints, and to generate the central cartography model to be visualized by the decision-maker; the goal is to provide a development-oriented environment for the cartography process; it is a work-bench integrating the ATL7perspective (for implementing the needed model-to-model trans-formations) together with multiple DSLs and projectors for standards like KML, GraphML, etc ; this perspective is intended to be used by the Cartography Designer, but the Visualization
Provider may also benefit from it to develop visualization extensions; this perspective handles
all the cartography process.
Figure 10: PORTOLANarchitecture
5.2
Underlying Architecture
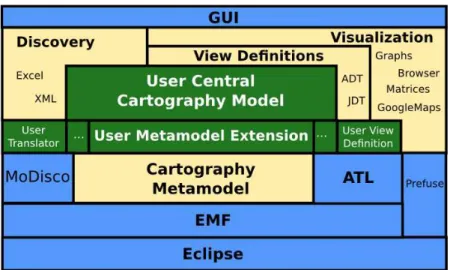
The PORTOLANcartography platform includes multiple model-driven components on top of Eclipse, as presented in Fig. 10.
5.2.1 Eclipse platform
The lower elements in the schema are the part of PORTOLANwhich relies on existing Eclipse com-ponents, with an emphasis on the Eclipse Modeling project: EMF for the model handling, ATL[16] for model transformation, MoDisco[19] for model discovery, edition and navigation capabilities, etc. As in any Eclipse tooling, the developments are realized in a workspace so that is possible to directly benefit from the standard Eclipse tooling such as available versioning systems (e.g. SVN or CVS), task managers (e.g. Mylin), etc.
5.2.2 Portolan core
The upper elements of the schema are the cartography framework high-level components. They are related to the four steps presented earlier: Metamodeling, Discovery, View Definitions and
Visual-ization.
This part includes the extension mechanisms presented in subsection 5.4. An Eclipse-based graphical user interface gives useful handles on both components.
5.2.3 User’s parts
The intermediate elements are the components which are customer-specific. The company may adapt or extend the provided sample metamodel and transformations in order to specialize them to its own domain of cartography. The user’s metamodel extension gives the abstract syntax for the user’s central cartography model. Translators are transformations used in discovery chains. View definitions are transformations to compute the user’s model into subsets or metrics to be displayed in the visualization perspective.
The platform provides default elements for this user’s parts (giving a ready-to-use application), which the company may adapt or replace.
Most of the features provided by the PORTOLANcartography platform are related to one of the four leading tasks highlighted in our Model-Driven Cartography approach (see Fig. 1):
• Metamodeling: PortolanCore cartography metamodel, Ecore modeler; • Discovery: ATL XML injector, Excel & XML metamodels;
• View Definition: ATL development environment;
• Visualization: ATL XML extractor, GraphML and KML metamodels, predefined viewers.
5.3
Predefined Viewers
The Portolan Cartography Framework is shipped with predefined functional viewers:
• a Prefuse-based[12] graph viewer: it relies onEntityandRelationshiptypes of the Cartog-raphy metamodel to display corresponding graphs, offering multiple layouts (force directed, nodes tree, LinLog[20], etc);
• a GoogleMaps view: this viewer displays on a GoogleMaps page the data items which have geolocated information, relying on theGeoLocatortype.
• the MoDisco[19] model browser: this tool facilitates the navigation of the central model based on the type of the elements
5.4
Extension Mechanisms
The PORTOLANcartography platform integrates all the provided features within extension mecha-nisms in order to apply each feature to different domains and be able to plug in PORTOLANother viewers and cartography tools.
5.4.1 Metamodel Extension
The cartography metamodel presented in our approach (see section 4.1 and Fig. 2) is embedded in PORTOLANas the PortolanCore Ecore metamodel. A company’s engineer (acting as Cartography
an Ecore diagram with the provided Ecore tools and making these types inherit from PortolanCore types. This metamodel extension only needs to be declared in the PORTOLANpreferences to be used as the reference cartography metamodel.
See section 6 and Fig. 13 for an illustration of the way the core metamodel can be extended.
5.4.2 Generic Visualization Extension
This extension point is the central registration mechanism of visual functionalities inside POR -TOLAN. It must be used by every Visualization Provider to plug its viewer in order to make it available to end-users. Some default viewers are provided with the PORTOLANprototype (Prefuse-based graph viewer, Modisco model browser, GoogleMaps viewer).
The technical implementation relies on Eclipse Extension Points mechanism. The Visualization
Provider creates his viewer as an Eclipse editor, declares it using the corresponding Editor Extension,
and also declares it as a Portolan Visualization extension, with respect to the corresponding schema. An example of such a PORTOLANdeclaration is given here:
<extension point="fr.inria.portolan.visualization.fullView"> <full_view commandId= "fr.inria.portolan.visualization.prefuse.commands.fullModel" editorId= "fr.inria.portolan.visualization.prefuse.ui.PrefuseEditor" iconPath="icons/prefuse_force.png" id="fr.inria.portolan.visualization.prefuse.view" name="Portolan Full Model Graph View Definition" pluginId="fr.inria.portolan.visualization.prefuse" text="Full Graph (Single)"
tooltip="Multi relationships are managed multiple single edges"> </full_view>
</extension>
The underlying mechanism inserts the corresponding button into the view bar of the Visualization perspective (as in the Decision-Maker perspective of Fig. 8), thus giving the Decision-maker a direct access to this new visualization.
5.4.3 End-User View Definition Extension
In order to filter the central cartography model and get a subset of it, a Cartography Engineer may write ATL transformations which do computations on this model and produce filtered models. The PORTOLANView Definitions mechanism give the ability to declare such filters and get correspond-ing button in the PORTOLAN main tool bar (left side of the Visualization perspective on Fig. 8).
When a user clicks on such a View Definition button, the corresponding command is run: the trans-formation applies on the central cartography model and the resulting model is passed to the specified editor. The result is a visualization with only the filtered elements.
As for visualizations, the View Definitions mechanism relies on Eclipse Extension Points. The
Cartography Engineer declares its ATL transformation using a specific *.vdfile with extension parameters as illustrated in the next example. This*.vdfile also specifies the final Visualization editor which will be used to display the resulting subset of the central cartography model.
<plugin> <extension point="fr.inria.portolan.visualization.viewDefinition"> <view_definition id="ToolsCartography.example.ExtractTools" categoryId= "fr.inria.portolan.visualization.prefuse.commands.viewDefinitionCategory" iconPath="Transformations/ViewDefinitions/ExtractTools.png" commandId="prefuse.tools.with.licenses.command" name="Tools with Licenses"
text="View: Tools Licenses" transformationPath= "Transformations/ViewDefinitions/ExtractTools.asm" postName="_Tools" editorId= "fr.inria.portolan.visualization.prefuse.ui.PrefuseEditor" shortMM="Cartography"> </view_definition> </extension> </plugin>
The PORTOLANModel-Driven Cartography Framework has been validated by applying it to three use cases, covering the three distinct possible uses of the metamodel identified in section 4.1.
6
Experiments
The PORTOLANcartography platform has its origin in the visualization needs of several industrial projects with different requirements.
In what follows, we present three use cases that explore three potential ways to use our frame-work by:
• making a direct use of the cartography metamodel;
• extending the cartography metamodel with a domain-specific extension; • plugging a previously existing DSL in the cartography metamodel.
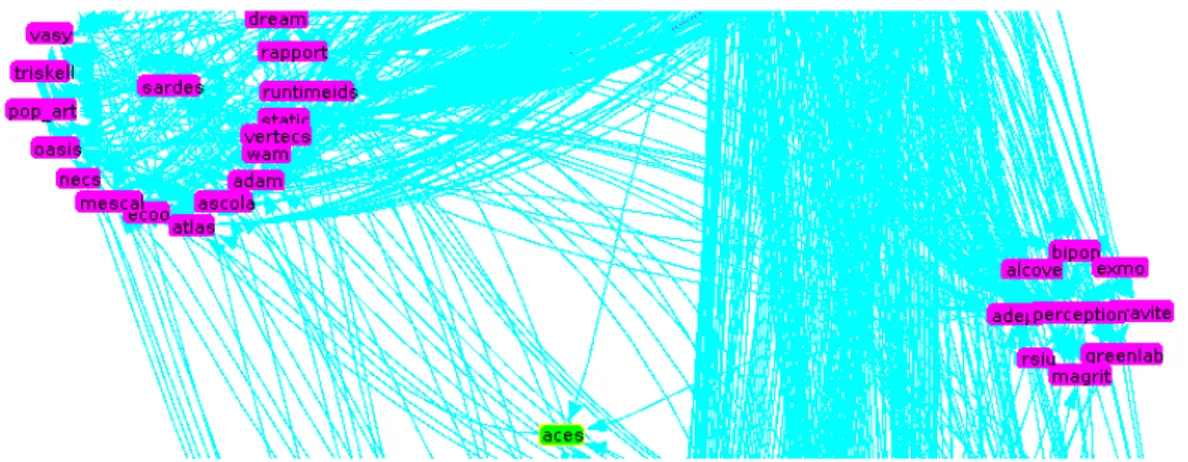
Figure 11: INRIA teams collaborations (excerpt)
6.1
Use of Core Metamodel: Collaborations within an Organization
INRIA (National French Research Institution in Computer Science) wanted a representation of its internal organization (areas, departments, human resources) along with its research activity and re-sults, specially regarding a visual representation of the collaboration between research teams. Since this collaboration can be simply represented as a graph, the predefined cartography metamodel does not need to be extended in this scenario.
To populate the cartography metamodel we injected the XML documents describing the collab-oration into a specific collabcollab-oration metamodel. A model to model transformation was in charge of translating this collaboration information in terms of the cartography metamodel. From there, we can automatically visualize the collaboration relationships. In Fig. 11, we can see a sample of the resulting visualization.
6.2
Core Metamodel Extension: Map of Business Tools and Formats
A large bank was interested in visualizing the possible interoperability (in terms of compatibility of the import/export formats) scenarios between the huge number of tools used in its different business units.
According to the requirements, we extended the cartography metamodel with new Tool and For-mat entities together with Import and Export relationships. Some additional concepts (like User or Milestone) were added to deal with the underlying business processes. With this extension, visual-ization tools can directly represent the concepts of interest for the bank. All these new classes were defined as subclasses of existing ones in the cartography metamodel (darker in Fig. 12).
The necessary data was provided by the bank in an Microsoft Excel worksheet. It has been refactored and processed as seen in section 4.2.
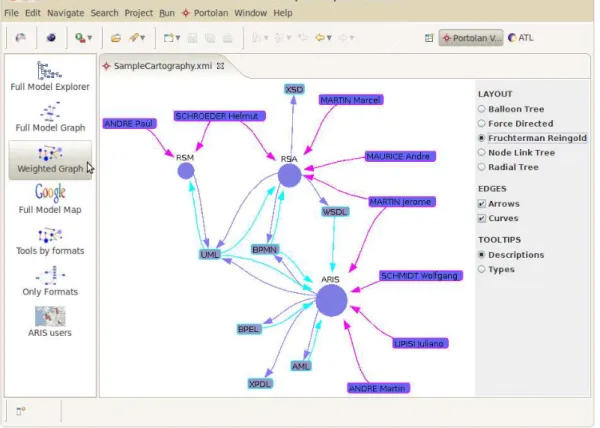
The most appropriate visualizations for this use case were the Prefuse-based graph viewers. After analyzing their requests, we used both generic and weighted graph views (see, in Fig. 8,
Figure 12: Business Cartography metamodel
the Decision-Maker perspective for an example of such a weighted graph), and predefined a new view definition which, based on the available information, automatically computes all possible links between all the tools by considering the formats they export and/or import. Computation was imple-mented by an ATL ExtractTools transformation.
By reducing the unforeseen impact of the change, this significantly facilitates the decisions about which tools to be added/replaced.
6.3
Plug Cartography in an Existing Metamodel: Eclipse B3 Build Models
Nowadays, complex software systems, such as the ones built on top of the Eclipse platform, are implemented by assembling components coming from different repositories. Designing build defi-nitions for this kind of systems is complex since all the dependencies between components must be taken into account.
Eclipse is proposing the new Eclipse B3 build tool for this task. This tool is a model-based tool and thus it defines a b3 metamodel (Fig. 13 on the left) to handle the build definition. Therefore, in order to offer designers with a visualization of all components in the build definition, we can connect the b3 metamodel with our cartography metamodel (Fig. 13 on the right) in order to benefit from the visualization capabilities of Portolan.
Once both metamodels are linked, and the underlying models have been translated via model transformations, a basic graph visualization shows up the complexity of the plugin dependencies. Using a grouping feature of the viewer, we could easily detect dependencies which target plug-ins on an inappropriate update site (colored zone of the graph in Fig. 14).
Figure 13:[Before|After] B3 metamodel
7
Related Work
Our approach relies on Model-Driven Engineering to provide visualization capabilities to every busi-ness domain that needs it. It offers the ability to assist in the different tasks required to transform raw user data into the corresponding graphical views by means of a (predefined set of) injectors, extractors and model transformations.
Up to now, research on this area has focused on the purely visualization aspects without consid-ering the whole cartography process.
Most generic visualization tools rely on an underlying technical library such as Prefuse[12], and force users to follow that input format for the data. This results in adhoc translation mechanisms between the domain data format and the visualization one. Some examples are the Bee/Hive visual-ization back-end[21] that relies on OQL and SQL queries; Gsee[10] dedicated to source-code explo-ration; SHriMP[22] for hierarchically structured information. On a higher level, Ma[18] proposed a tool to visualize the visualization process itself, allowing the definition of visual transformations that can then be executed. However, these transformations are already performed on the visualization it-self and thus, are not useful to adapt the domain data. Our approach provides a more homogeneous framework to develop reusable transformations.
Some approaches have introduced MDE techniques to deal with visualization problems at a higher abstraction level. Bull et al.[6] proposed a framework for view customizations. This frame-work relied on the creation of an explicit metamodel for every visualization paradigm or tool (tree view, graph view, charts, etc). Domokos, Varro and Varró[8] proposed a framework focused on the visualization of metamodels. Again, while useful, these approaches do not cover the full cartography process.
A more complex approach is S. Buck et al.[5] that proposed an automated approach based on model transformations but linked to a specific and simple visualization metamodel. B. Brodaric and J. Hastings[4] follow a similar approach but focused on geographical information systems. Other domain-specific systems are N. Abdat and Z. Alimazighi[1] with a metamodel with geographic items, F. Allilaire[2] for software cartography. Instead, in our case, the pivot cartography metamodel provides a clear separation of concerns between both data and visualization, so that designers can easily change one or the other reusing at least half of the work done.
8
Conclusions and further work
We have presented our cartography framework to manage the whole chain of tasks from data capture to visualization. Our approach takes advantage of MDE techniques to offer an integrated, generic and extensible environment to deal with graphical display of information for every specific domain. Our framework has been implemented, as the Portolan tool, on top of the Eclipse platform and has been validated in three different case studies.
As further work, we plan to enrich the Portolan framework with additional predefined visual-ization tools. Some advanced visualvisual-ization approaches, such as N. Henry MatrixExplorer[13] and NodeTrix[14], could help to deal with huge and dense graphs and give the users more handles on their data. We will also test Portolan in other scientific fields to see the benefits of applying our
approach on huge amounts of data. Working on clustering algorithms for models could be needed in this kind of scenario.
Acknowledgements
The present work is being supported by the French ANR IDM++ project.
References
[1] N. Abdat and Z. Alimazighi. GMTool: Geographic object-generating tool. In Second
Inter-national Conference on Research Challenges in Information Science, 2008. RCIS 2008, pages
459–464, 2008.
[2] F. Allilaire. Towards Traceability support in ATL with Obeo Traceability. In Proceedings of
1st International Workshop Model Transformation with ATL (MtATL 2009), pages 150–153,
July 8-9 2009.
[3] J. Bézivin, H. Bruneliere, F. Jouault, and I. Kurtev. Model engineering support for tool interop-erability. In Proceedings of the 4th Workshop in Software Model Engineering (WiSME 2005),
Montego Bay, Jamaica, volume 2, 2005.
[4] B. Brodaric and J. Hastings. An object model for geologic map information. In Advances
in Spatial Data Handling: 10th International Symposium on Spatial Data Handling, pages
55–68. Springer Verlag, 2002.
[5] S. Buckl, A. Ernst, J. Lankes, C. Schweda, and A. Wittenburg. Generating Visualizations of Enterprise Architectures using Model Transformations. EMISA 2007, page 33, 2007.
[6] R. Bull, M. Storey, J. Favre, and M. Litoiu. An architecture to support model driven software visualization. In Proceedings of the 14th International Conference on Program Comprehension
(ICPC′06), pages 100–106, 2006.
[7] M. Consens, F. Eigler, M. Hasan, A. Mendelzon, E. Noik, A. Ryman, and D. Vista. Architecture and applications of the Hy visualization system. IBM Systems J, 33:458–476, 1994.
[8] P. Domokos, D. Varro, and D. Varró. An Open Visualization Framework for Metamodel-Based Modeling Languages. In Proc. Supercomputing’93, pages 878–883. Citeseer, 2002.
[9] D. Dyer. Visualization: A dataflow toolkit for visualization. IEEE Computer Graphics and
Applications, pages 60–69, 1990.
[10] J. Favre. Gsee: a generic software exploration environment. In 9th International Workshop on
Program Comprehension, IWPC. Citeseer, 2001.
[11] J. Fekete. The InfoVis toolkit. In Information Visualization, 2004. INFOVIS 2004. IEEE
[12] J. Heer, S. Card, and J. Landay. Prefuse: a toolkit for interactive information visualization. In
Proceedings of the SIGCHI conference on Human factors in computing systems, pages 421–
430. ACM, 2005.
[13] N. Henry and J. Fekete. Matrixexplorer: a dual-representation system to explore social net-works. IEEE Transactions on Visualization and Computer Graphics, pages 677–684, 2006. [14] N. Henry, J. Fekete, and M. McGuffin. NodeTrix: a hybrid visualization of social networks.
Visualization and Computer Graphics, IEEE Transactions on, 13(6):1302–1309, 2007.
[15] R. Johnson and B. Woolf. The Type Object Pattern. Pattern Languages of Program Design, 3, 1997.
[16] F. Jouault, F. Allilaire, J. Bézivin, and I. Kurtev. ATL: A model transformation tool. Science of
Computer Programming, 72(1-2):31–39, 2008.
[17] I. Kurtev, J. Bézivin, F. Jouault, and P. Valduriez. Model-based DSL frameworks. In
Com-panion to the 21st ACM SIGPLAN symposium on Object-oriented programming systems, lan-guages, and applications, pages 602–616. ACM, 2006.
[18] K. Ma. Visualizing visualizations. User interfaces for managing and exploring scientific visu-alization data. Computer Graphics and Applications, IEEE, 20(5):16–19, 2002.
[19] F. Madiot. MoDisco, a Model-Driven Platform to Support Real Legacy Modernization Use Cases. Information Systems Transformation: Architecture-Driven Modernization Case Studies, page 365, 2010.
[20] A. Noack. Energy models for graph clustering. Journal of Graph Algorithms and Applications, 11(2):453–480, 2007.
[21] S. Reiss. Bee/hive: A software visualization back end. In IEEE Workshop on Software
Visual-ization, pages 44–48, 2001.
[22] M. Storey, C. Best, J. Michaud, D. Rayside, M. Litoiu, and M. Musen. SHriMP views: an inter-active environment for information visualization and navigation. In CHI’02 extended abstracts
on Human factors in computing systems, page 521. ACM, 2002.
[23] C. Upson, T. Faulhaber Jr, D. Kamins, D. Laidlaw, D. Schlegel, J. Vroom, R. Gurwitz, and A. Van Dam. The application visualization system: A computational environment for scientific visualization. Computer Graphics and Applications, IEEE, 9(4):30–42, 2002.
Unité de recherche INRIA Futurs : Parc Club Orsay Université - ZAC des Vignes 4, rue Jacques Monod - 91893 ORSAY Cedex (France)
Unité de recherche INRIA Lorraine : LORIA, Technopôle de Nancy-Brabois - Campus scientifique 615, rue du Jardin Botanique - BP 101 - 54602 Villers-lès-Nancy Cedex (France)
Unité de recherche INRIA Rhône-Alpes : 655, avenue de l’Europe - 38334 Montbonnot Saint-Ismier (France) Unité de recherche INRIA Rocquencourt : Domaine de Voluceau - Rocquencourt - BP 105 - 78153 Le Chesnay Cedex (France)