doi: 10.3389/fcvm.2018.00112
Edited by: Junjie Xiao, Shanghai University, China Reviewed by: Alexander Lauten, Charité Universitätsmedizin Berlin, Germany Monica Solbiati, Università degli Studi di Milano, Italy *Correspondence: Patrizio Lancellotti plancellotti@uliege.be
Specialty section: This article was submitted to General Cardiovascular Medicine, a section of the journal Frontiers in Cardiovascular Medicine Received: 21 April 2018 Accepted: 02 August 2018 Published: 22 August 2018 Citation: Nchimi A, Dibato JE, Davin L, Schoysman L, Oury C and Lancellotti P (2018) Predicting Disease Progression and Mortality in Aortic Stenosis: A Systematic Review of Imaging Biomarkers and Meta-Analysis. Front. Cardiovasc. Med. 5:112. doi: 10.3389/fcvm.2018.00112
Predicting Disease Progression and
Mortality in Aortic Stenosis: A
Systematic Review of Imaging
Biomarkers and Meta-Analysis
Alain Nchimi1,2, John E. Dibato1, Laurent Davin1, Laurent Schoysman3, Cécile Oury1and Patrizio Lancellotti1,4*
1GIGA Cardiovascular Sciences, Department of Cardiology, Heart Valve Clinic, CHU Sart Tilman, University of Liège Hospital, Liège, Belgium,2Department of Medical Imaging, Centre Hospitalier de Luxembourg, Liège, Luxembourg,3Department of Medical Imaging, CHU Sart Tilman, Liège, Belgium,4Gruppo Villa Maria Care and Research, Anthea Hospital, Bari, Italy
Background: Detecting among patients with aortic stenosis (AS) those who are likely to rapidly progress, yet potentially benefiting from prophylactic aortic valve replacement, is needed for improved patient care. The objective of this study was to evaluate the role of imaging biomarkers in predicting the progression to clinical symptoms and death in patients with AS.
Methods: We searched the Pubmed and the International Clinical Trials Registry
Platform databases for studies including patients with AS, and investigating imaging techniques, published in any language until Jan 1, 2018. Eligible sets of data include effect of imaging biomarkers relative to: (1) Overall mortality, (2) Cardiac mortality, and (3) Overall events (Symptom onset and Major Adverse Cardiovascular Events). Meta-analysis was used to examine associations between the imaging biomarkers and outcomes of AS using Random Effect models.
Results: Eight studies and 1,639 patients were included after systematic review. Four studies investigated aortic valve calcification (AVC) whereas the remaining investigated biomarkers provided by cardiac magnetic resonance (CMR). Four articles investigated the presence of midwall fibrosis on late-gadolinium enhancement imaging, three reported its extent (LGE%) and two, the myocardial extracellular volume (ECV). By decreasing strength of association, there were significant associations between cardiac mortality and LGE% [Relative Risk (RR) = 1.05, 95% Confidence Interval (CI) 1.01–1.10]; overall mortality and AVC (RR = 1.19, 95%CI: 1.05–1.36); overall events and ECV (RR = 1.68, 95%CI: 1.17–2.41); cardiac mortality and midwall fibrosis (RR = 2.88, 95%CI: 1.12–7.39).
Conclusion: AVC and myocardial fibrosis imaging biomarkers predict the outcomes in AS, and help understanding AS pathophysiology and setting therapeutic targets. Keywords: aortic stenosis, meta-analysis, imaging biomarker, myocardial fibrosis, remodeling, calcification
INTRODUCTION
Degenerative aortic stenosis (AS) is one of the most common valvular diseases, affecting up to 6% of subjects over 75 years
old in developed countries (1). AS progresses with time in such
a way that the only effective treatment is surgical or transcatheter aortic valve replacement (AVR). In the recent years, it has been growingly acknowledged that AS encompasses a wide spectrum of pathways in response to the progressive obstruction of the left ventricular (LV) outflow. These include first adaptive responses such as LV concentric hypertrophy that relieves the wall stress in response to LV overload, then maladaptive responses such as myocardial ischemia and fibrosis that eventually lead to
myocardial dysfunction and cardiac output failure (2, 3). The
concurrent progresses in computed tomography (CT), cardiac magnetic resonance imaging (CMR) and positron emission tomography (PET) have given rise to imaging biomarkers allowing quantification of the structural remodeling of both the
aortic valve and the underlying myocardium (4). On a clinical
view, the current indications for AVR are severe AS (peak aortic jet velocity ≥4 m/s, mean transvalvular pressure gradient
≥40 mm Hg, aortic valve area (AVA) ≤1.0 cm2 or ≤0.6 cm2/m2)
causing clinical symptoms, or a decreased LV ejection fraction
(<50%) (5,6). Nevertheless, intervening too late in the disease
course (i.e., when adverse remodeling and fibrosis processes have become irreversible) is associated with poor post-operative
outcomes (7). Even with severe AS, the symptoms may be difficult
to unmask in aged patients, as almost one half report no symptom
at the time of diagnosis (8). There is therefore a need to detect
from clinical, biological, and imaging tests, patients with AS who are likely to rapidly progress to symptoms, yet potentially benefiting from AVR. Several imaging biomarkers have been or are currently being considered at different levels of evidence to stratify the risk in asymptomatic severe AS. The objective of this study was to determine which imaging biomarkers (derived from CT and CMR) were associated with the prediction of AS progression to clinical symptoms and death.
METHODS
We carried out a systematic review in accordance with the PRISMA guidelines, following a protocol in accordance
with the PRISMA-P statement (9). The online free database
Medline (via PubMed) was searched for eligible articles. The date of the last search was January 1, 2018. The International Clinical Trials Registry Platform was searched for ongoing studies. The literature search was performed with assistance from an experienced librarian. The search strategy combined four sets of search terms (keywords), in accordance with the “Patient-Intervention-Control-Outcome” methodology. The first set of keywords defined AS (i.e.: aortic valve stenosis. . . ), the second defined imaging techniques (i.e.: Computed Tomography, Electron-Beam Tomography, Magnetic Resonance Imaging, Positron Emission Tomography . . . ), the third defined remodeling processes (i.e.: calcification, hypertrophy, fibrosis, ischemia. . . ), and the fourth defined the clinical outcomes [i.e.: death, mortality, cardiovascular
events (decompensation, edema, angina), progression, onset, survival. . . ]. All keyword searches were combined to subject heading searches when appropriate. The full search strategy is provided in the Supplementary Table 1. Only original papers, clinical trials and studies, controlled and observational trials, with available full-text in English were included. Studies were eligible if they included only adult patients with AS, and investigated at least one diagnostic imaging technique focusing on the calcific remodeling of the valve, myocardial microvascular obstruction, myocardial fibrosis. Studies that did not relate the imaging results to AS progression or mortality were not included. Reports of pilot studies describing fewer than five patients were excluded.
Data Extraction
Two reviewers with experience in cardiovascular imaging assessed in consensus all titles and abstracts for relevance and eligibility. The full text of potentially relevant articles was retrieved. If full text articles were not available, the corresponding authors were contacted. Reference lists from included articles were searched for other relevant articles. The reviewers extracted and processed the data in standardized extraction forms. Corresponding authors were contacted for additional information if data were unclear or incomplete. Items included the last name of the first author and year of publication, study design, objective, sample size, inclusion, and exclusion criteria, patient characteristics, AS grade, follow-up period, funding source, technical aspects of imaging modalities, methods of measurement, interpretation of imaging results, and quantitative imaging results, measure of effect sizes [as relative risk (RR)].
Risk of Bias Assessment
Study quality and risk of bias was assessed using Cochrane
Collaboration’s tool for assessing risk of bias (10). Ten specific
bias domains were used in the form of answering pre-specified questions about the methods reported by each study in relation to the risk domain, such that the conclusion is either “no” (“–”, indicating high risk of bias), “not reported” (“NR”, indicating unclear risk of bias), or “yes” (“+”, indicating low risk of bias).
Statistical Analysis
Three outcomes of AS were considered for this review: (1) Overall mortality, (2) Cardiac mortality, and (3) Overall events [Symptom onset and Major Adverse Cardiovascular Events (MACE)]. Meta-analyses were done using the metagen function
from the R package meta (11, 12). For each study considered,
measures of effect were represented as RR and its corresponding 95% CIs. Conversion of effect sizes were done using the
approach of Borenstein et al. (13) where RRs were not reported
directly. Biomarkers with more than one effect measures in a study were combined using fixed effect model. The strength of association of each biomarker with the outcomes were quantified by pooling the RRs provided by the original studies using either Fixed or Random effect models and the results are represented as forest plots. Statistical heterogeneity between studies was assessed using the I² and Tau². To investigate publication bias, funnel plots were produced in addition to the
use of Egger’s regression test. In order to rank biomarkers with respect to effects on outcomes, the average RRs and measures of variability were converted to odds ratios (ORs) using the formula at the Supplementary Information 1. These ORs were later on transformed to Hedges’ g, a common index of effect
size, as stated elsewhere (13). With the use of the
normal-normal hierarchical model (NNHM), a Bayesian random effect model was implemented using the bayesmeta package in R for evaluating the strength of association for each biomarker with the outcome. A normal prior was used for the overall mean whereas a half student-t was used as prior for the measure
of heterogeneity among the effect sizes of each biomarker. Posterior predictive P-values (PPPV) were computed using 1,000 Monte Carlo sampling. Then, sensitivity analysis for ranking of biomarker effects was done by fitting a consistency random effect network meta-analysis (NMA) assuming a common reference group for each biomarker effect. Hedges’ g was computed for each study separately before being combined in the NMA (Supplementary Figure 1). The appropriate NMA model was conducted in OpenBugs using 2 chains with different starting values and a burn-in of 50 k after 500 k iterations. Convergence of the model was assessed using history and density plots
(Supplementary Figures 3, 4). For each Marcov Chain Monte Carlo (MCMC) run, each biomarker is ranked using the absolute value of the Hedges’ g. Probabilities of being the first, second and up till the last are estimated and represented on a Cumulative probability plot. These probabilities are used to estimate the surface under the cumulative rank (SUCRA) curve which determined the strength of the biomarker with the outcome. All analyses were done using R studio (R version 3.4.2) and a p-value of <5% was considered statistically significant.
RESULTS
The search strategy identified 540 citations (Figure 1). After screening of titles and abstracts, twenty articles were selected for full-text review. After full-text review, one study was excluded because it didn’t report the patient status regarding
AS upon inclusion (14). Seven studies were excluded because
they used different endpoints than clinical outcome to investigate imaging results, or mixed (clinical and imaging) data to
determine the outcome of AS (15–21). One other study (22)
was excluded because it briefly reported the 5-year
follow-up of a cohort assessed previously by Dweck et al. (23). Five
studies were excluded as they report the outcomes of patients
regarding imaging results, after AVR (24–28). One study was
excluded because it was retrospective and evaluated only a
subset of patients with low-gradient and low-flow (29). Three
additional studies were found through cross-referencing (30–
32). Subsequently, eight articles were included in this systematic
review (Supplementary Table 2). All included studies were prospective and their sample sizes ranged from 34 to 794 patients, with a total number of 1,639 patients in this review.
The patient and AS characteristics are summarized in
Table 1. Four articles investigated aortic valve calcification (AVC)
with electron-beam CT (EBCT) (33) and conventional photon
multislice CT (MSCT) (30, 31, 34). Four studies investigated
LV myocardial fibrosis using late-gadolinium-enhancement
(LGE) CMR; all investigating midwall replacement fibrosis (23,
32, 35, 36). Three of these studies investigated replacement
fibrosis quantification (LGE%) (32, 35, 36), and two studies
evaluated interstitial fibrosis via the extracellular volume (ECV)
measurement (35, 36). Lastly, single CMR studies investigated
respectively the myocardial perfusion reserve (MPR) as a
marker of microvascular dysfunction in AS (36), and native
(unenhanced) T1 value as a marker of myocardial fibrosis
(32). Included articles reported patient cohorts from Europe,
United Kingdom, USA, Canada and South Korea. The overall findings of the risk of bias assessment were: a low risk of selection attrition and outcome reporting bias, and varied risk of detection and commercial bias as the outcome adjudication blinding was nearly systematically unreported, and some investigators related
to the industry in four studies (23, 32, 35,36). All the studies
recorded are of moderate-to-low risk of bias with overall quality of 50% or more (Supplementary Table 3).
Meta-analyses were restricted to the biomarkers that were reported in at least 2 studies. As listed in Table 2, there were
variations in study outcomes and studies with several outcomes TA
B L E 1 | P a tie n t d e m o g ra p h ic s a n d c h a ra c te ris tic s. R e fe re n c e s S tu d y d e s ig n F o ll o w -u p (y e a rs ) N A g e (y e a rs ) M a le n (% ) B A V (% ) A S g ra d e (% ) P e a k a o rt ic v e lo c it y (m/ s ) A V A (c m 2) P ma x (mmH g ) P me a n (mmH g ) M e ss ik a -Z e ito u n , e t a l. ( 3 3 ) P ro sp e c tiv e 2 1 0 0 7 0 5 8 (5 8 % ) 1 1 M o d e ra te = 7 1 S e ve re = 2 9 2 .8 1 .8 N R N R F e u c h tn e r, e t a l. ( 3 0 ) P ro sp e c tiv e 1 .5 3 4 7 0 .5 2 0 (6 7 % ) 0 N R N R N R 5 6 3 6 D w e c k, e t a l. ( 2 3 ) P ro sp e c tiv e 2 1 4 3 6 8 9 7 (6 8 % ) N R M o d e ra te = 4 0 S e ve re = 6 0 N R 0 .9 9 7 0 N R U ts u n o m iy a , e t a l. ( 3 1 ) P ro sp e c tiv e 2 .4 6 4 7 4 2 8 (4 4 % ) 0 M o d e ra te = 5 5 S e ve re = 4 5 3 .7 5 1 .1 4 N R 2 9 C la ve l, e t a l. ( 3 4 ) P ro sp e c tiv e 3 .1 7 9 4 7 3 5 2 0 (6 5 % ) N R M o d e ra te = 5 7 S e ve re = 4 3 3 .7 1 .1 0 N R 3 5 C h in , e t a l. ( 3 5 ) P ro sp e c tiv e 2 .9 2 0 3 6 9 1 1 5 (6 9 % ) N R M ild = 1 7 M o d e ra te = 2 2 S e ve re = 4 3 3 .8 1 .0 N R 3 5 S in g h , e t a l. ( 3 6 ) P ro sp e c tiv e 1 1 7 4 6 6 .2 1 3 3 (7 6 % ) N R M o d e ra te = 2 9 S e ve re = 7 1 3 .8 6 0 .5 7 N R 3 5 .4 L e e , e t a l. ( 3 2 ) P ro sp e c tiv e 2 .3 1 2 7 6 8 .8 6 3 (5 0 % ) N R M o d e ra te = 3 8 S e ve re = 6 2 4 .4 0 .8 2 N R 4 8 N , s a m pl e s iz e ; A S , a o rti c s te n o s is ; B A V , bi c u s pi d a or ti c va lv e ; A V A , a or ti c va lv e a re a ; PM a x , m a xi m a ltr a n s va lv u la r pr e s s u re gr a di e n t; PM e a n , m e a n tr a n s va lv u la r pr e s s u re gr a di e n t; N R , n ot re por te d; L G E, la te -ga dol in iu m e n h a n c e m e n t.
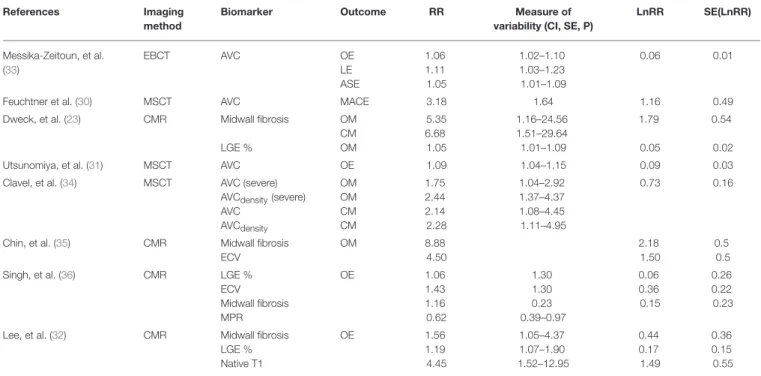
TABLE 2 | Associations between imaging biomarkers, effect size (Variability), and outcomes in AS.
References Imaging
method
Biomarker Outcome RR Measure of
variability (CI, SE, P)
LnRR SE(LnRR) Messika-Zeitoun, et al. (33) EBCT AVC OE LE ASE 1.06 1.11 1.05 1.02–1.10 1.03–1.23 1.01–1.09 0.06 0.01
Feuchtner et al. (30) MSCT AVC MACE 3.18 1.64 1.16 0.49
Dweck, et al. (23) CMR Midwall fibrosis LGE % OM CM OM 5.35 6.68 1.05 1.16–24.56 1.51–29.64 1.01–1.09 1.79 0.05 0.54 0.02
Utsunomiya, et al. (31) MSCT AVC OE 1.09 1.04–1.15 0.09 0.03
Clavel, et al. (34) MSCT AVC (severe) AVCdensity(severe)
AVC AVCdensity OM OM CM CM 1.75 2.44 2.14 2.28 1.04–2.92 1.37–4.37 1.08–4.45 1.11–4.95 0.73 0.16
Chin, et al. (35) CMR Midwall fibrosis ECV OM 8.88 4.50 2.18 1.50 0.5 0.5
Singh, et al. (36) CMR LGE %
ECV Midwall fibrosis MPR OE 1.06 1.43 1.16 0.62 1.30 1.30 0.23 0.39–0.97 0.06 0.36 0.15 0.26 0.22 0.23 Lee, et al. (32) CMR Midwall fibrosis
LGE % Native T1 OE 1.56 1.19 4.45 1.05–4.37 1.07–1.90 1.52–12.95 0.44 0.17 1.49 0.36 0.15 0.55
AVC, aortic valve calcification; EBCT, electron-beam computed tomography; MSCT, multisclice computed tomography; LGE, late-gadolinium enhancement; ECV, extracellular volume; MACE, major adverse clinical event; OM, overall mortality; OE, overall events; LE, late events; CM, cardiac mortality; ASE, aortic stenosis related-event; CI, confidence interval; RR, relative risk; SE, standard error; Ln, neperian logarithm.
for a biomarker was pooled into one using fixed effect model. The primary outcome was all-cause mortality in three studies
(23, 34, 35), and a softer endpoint including cardiac- or
AS-related mortality, MACE, AS-AS-related symptoms or AVR in the remaining. Results from the meta-analyses confirmed significant associations between AVC and Overall mortality (RR = 1.19, 95%CI: 1.05–1.36); Midwall Fibrosis and Cardiac mortality (RR = 2.88, 95%CI: 1.12–7.39), LGE percent and Cardiac mortality (RR = 1.05, 95%CI: 1.01–1.10); ECV and Overall events (RR = 1.68, 95%CI: 1.17–2.41) (Figure 2). For all the biomarkers, higher values are associated with higher risks of having outcomes of AS, but substantial inconsistency of effect
was observed for AVC, and midwall fibrosis with both I2
>75%. Because of the limited number of studies, assessment of and further correction for bias could not be sufficiently ascertained. Ranking of biomarkers in order of decreasing strength of association with the outcomes resulted in LGE% (PPPV <0.0001) being at the top and midwall fibrosis (PPPV = 0.456) at the bottom (Table 3). Similar rankings were observed using the SUCRA values from the NMA (Supplementary Figure 2).
DISCUSSION
This systematic review and meta-analysis showed significant associations between imaging biomarkers of aortic valve remodeling and myocardial fibrosis and clinical outcomes in patients with AS. Five years after receiving the diagnosis, approximately two-thirds of conservatively managed patients
with asymptomatic AS will develop symptoms, and 75% will have
either died or undergone AVR (37). During this time period, it is
questionable in how far they would not exhibit raised biomarkers of poor outcome before developing clinical symptoms, altered hemodynamic or performance status. Imaging biomarkers with prognostic value in AS are often correlated with hemodynamic and clinical performance. The aortic valve calcium (AVC) score for instance is recommended in the management of patients with AS, not as a prognostic factor, but to determine the likelihood of severe AS in case of low-gradient, low-flow and preserved LVEF
(6), due to its association to AS severity (16,34). The findings
of our analysis advocates for an additional prognostic use this score, as all four articles investigating AVC reported association with mortality; with an overall RR of 1.19, 95%CI: 1.05–1.36)
(30,31,33,34). Even though only the largest among these studies
(34) introduced AVCdensityto compensate for differences in aortic
annular area, there were little measurement bias, as a highly reproducible and standardized score was systematically reported
(16,17,38).
Similar risk stratification to AVC is expected from non-invasively assessed LV myocardial fibrosis, a fourfold potential courtesy of CMR using the effects of gadolinium-based contrast agents. These agents strongly decrease the T1 relaxation time of the tissues. As such, they can be used for track-bolus kinetics within the myocardium and assess resting and stress perfusion, thus MPR, which is potentially a marker of microvascular
dysfunction (36). Gadolinium-based contrast agents distribute
in the plasma and extracellular spaces, which means they do not enter normal cells. Upon equilibrium distribution (i.e.,
FIGURE 2 | Forest plots showing the average relative risks for the strength of association between imaging biomarkers and outcomes in AS. AVC, aortic valve calcification; LGE, late gadolinium enhancement; ECV, extracellular volume. (A) (AVC: I2=87.1, Tau2=0.01, n = 992). (B) (Midwall LGE: I2=84.1, Tau2=0.76, n =647). (C) (LGE %: I2=0, Tau2=0, n = 444). (D) (ECV: I2=77.7, Tau2=0.5, n = 377).
10–15 min after injection), imaging thus figure the replacement of lost cardiomyocyte by extracellular space expansion (fibrosis),
which precludes LV decompensation and arrhythmia (39–41).
The presence of midwall fibrosis on T1-weighted imaging is the second biomarker derivable from contrast-enhanced CMR. Recognizing midwall fibrosis on LGE is easy and reproducible, as only requested to differentiate from post-infarct scars that classically involves the subendocardium, and amyloid, which is uncommon. In this meta-analysis, there were contradictory findings regarding the value of midwall fibrosis as a marker of clinical outcome in AS, with overall, a moderate but significant association between midwall fibrosis and cardiac mortality (RR: 2.88; 95%CI: 1.12–7.39). The relative amount of midwall fibrosis similarly accounts for prognostic value, which represents another
biomarker provided by LGE. The method of quantification of midwall fibrosis depends on patient- and contrast-specific variables such as enhancement dynamics, CMR equipment and
the “density” of fibrosis (42). Various cutoffs to differentiate
fibrosis from the surrounding “normal” myocardium were reported across the series analyzed, including Full Width at Mid Height and Standard Deviations from the mean signal intensity
histogram. Although conflicting across the series (23, 36), the
percent of LGE was overall significantly associated with cardiac mortality in AS (RR:1.05; 95%CI: 1.01–1.09). A step further, assessing interstitial fibrosis necessitates more sophisticated imaging approaches aiming at establishing the T1 relaxation time mapping of the myocardium; the so-called relaxometry.
TABLE 3 | Rank of biomarkers according to posterior predictive p-value.
Biomarker RR 95 % CI Hedges’g 95% CrI PPPV Rank
AVC 1.19 1.05–1.36 0.08 0.01 to 0.13 0.010 2 Midwall fibrosis 2.88 1.12–7.39 0.11 −0.34 to 0.67 0.456 4 LGE% 1.05 1.01–1.10 0.016 0.01 to 0.02 <0.0001 1 ECV 1.68 1.17–2.41 0.15 −0.06 to 0.44 0.134 3
AVC, aortic valve calcification; MF, midwall fibrosis; LGE, late gadolinium enhancement; ECV, extracellular volume; RR, relative risk; CI, confidence interval; CrI, credible interval; PPPV, posterior predictive p-value.
T1 mapping and a mix of both have been investigated and validated against the extent of myocardial fibrosis on histology,
each with its own potential advantages and limitations (43). Of
these, ECV and derivatives (indexed to the body surface area) were reported in this meta-analysis. ECV represents the volume of distribution of the contrast agent within the myocardium, expressed as the difference of T1 relaxation time changes after contrast administration, corrected for the volume of distribution by using the hematocrit. ECV also showed significant prognostic effect in AS patients in our review (RR:1.68; 95%CI: 1.17–2.41).
Altogether place a special emphasis on the prognostic role of CMR in AS. However, substantial inconsistency of effect was observed for the biomarkers and the cut-offs for patient stratification varied across the cohorts. Valve calcification for instance is an active process independent from the skeletal
bone calcification (44), not only associated to local factors like
AS severity (15–17) or valve inflammation (45, 46), but also
distant influences in relationship with classical risk factors for
cardiovascular disease (47). As such, the mechanisms of initiation
and progression of this biomarker are neither fully elucidated nor totally predictable. This is epitomized by the fact that females have lower AVC than males even after correction for body surface
area, aortic annular area and other risk factors (48), and that
severe AS with low AVC is not uncommon (49). Likewise, there is
variability on a patient basis regarding both stimuli and responses to myocardial fibrosis. The investigations regarding myocardial fibrosis will need similar levels of standardization as for AVC, and a greater control for the confounders for AS-induced fibrosis or myocardial dysfunction, such as coronary artery disease or
myocardial steatosis (50–52). Further studies will be needed
to determine the appropriate normal value ranges of above-reported biomarkers and derivatives among subgroups by age, sex, ethnicity, and underlying risk factors and comorbidities. When accounting the current variability of these biomarkers for strength of effect using network meta-analysis, midwall fibrosis, and ECV were the weakest prognostic biomarkers (PPPV 0.456 and 0.134 respectively). This is unsurprising, as midwall fibrosis is too prevalent to make a contributive difference among patient groups, as being present in up to 62% of patients with severe AS
(23–25). On the other hand, ECV and its derivatives (including
unenhanced T1 values, and partition coefficient) (32, 53, 54)
that are potentially reversible and sensitive to earlier adverse remodeling show considerable overlaps between normal and
diseased individuals (35).
The association between imaging biomarkers and patient outcome in AS raises the question of a possible paradigm
shift in the management of AS. The efficacy of a biomarker-based management as compared to the current approach that relies mainly on clinical performance need to be tested by large randomized studies. Both approaches have nevertheless the potential to be complimentary. Considering this could help refining the risk assessment in severe AS where patients with good symptom/performance status and low level of relevant imaging biomarkers being at low-risk, needing no AVR, whereas those with altered symptom/performance status and high level of the same imaging biomarkers requiring AVR. Consequently, critically evaluating the benefits of AVR in intermediate-risk groups (i.e., patients with either altered symptom/performance status or raised imaging biomarker of poor prognosis) could be a major research issue in the near future.
LIMITATIONS
The aim of this review was to provide an overview of imaging biomarkers that could possibly predict clinical evolution in patients with AS. Our search revealed only a small number of studies, though there are other imaging biomarkers at earlier phases of their development. Some of these newer
techniques use radiotracers (46) and others evaluate longitudinal
or circumferential myocardial dysfunction (20,27,28), or wall
stresses flow and deformation pattern changes (55). Our findings
link imaging biomarkers with mortality, cardiac mortality or overall events. Nevertheless, AS-related events are often difficult to report and subject to bias. The proportion of patients with severe AS upon enrolment varies from 29 to 71 percent across the series (Table 2), indicating some potentially enriched cohorts, though the consecutive enrolment information missed in all but
two articles (23,33). Only one study evaluated potential selection
bias via evaluation of the events that occurred >1month after
enrolment (33). Most articles did not specify the blinding of
the endpoint adjudicator(s). While AVR was often reported in patients who did not experience symptoms, all-cause mortality, cardiac mortality, and symptoms account for other risks than the sole severity of AS. This was underscored in the study of Clavel et al. where the survival after AVR was improved only in patients
with high AVC (34).
Lastly, it should be acknowledged that: first, the prognostic value of imaging biomarkers does not necessary outperform clinical test exploring the same pathway when available. Indeed, the only study that evaluated the prognostic value of MPR as a marker of microvascular dysfunction reported a significant prediction for overall mortality (HR: 0.62; 95%CI: 0.39–0.97; p = 0.035), which was nevertheless not superior to that of
a positive exercise testing (36). The financial burden of risk
stratification using imaging biomarkers that uses sophisticated and costly imaging techniques could thus be reduced by developing more cost-efficient clinical or biological biomarkers
(19,56–59). Second, whereas the ideal biomarker for a disease
should be sensitive and consistent across age, gender and ethnic groups, the current imaging biomarkers are imperfect by nature, partly due to their specificity to only one of the pathophysiological processes. Indeed, AS is a complex disease process interplaying several pathways, placing emphasis on multi-biomarker prognosis.
In conclusion, AVC and myocardial fibrosis markers are significantly associated with outcomes in AS, and have the added potential to help the understanding of AS pathophysiology and setting therapeutic targets.
AUTHOR CONTRIBUTIONS
AN literature search, article search, data extraction, and manuscript writing. JD statistical analysis, manuscript writing,
revision, and summary. LD and LS literature search and manuscript revision. CO and PL study outline, revision, edition, and summary.
SUPPLEMENTARY MATERIAL
The Supplementary Material for this article can be found
online at: https://www.frontiersin.org/articles/10.3389/fcvm.
2018.00112/full#supplementary-material
REFERENCES
1. Nkomo VT, Gardin JM, Skelton TN, Gottdiener JS, Scott CG, Enriquez-Sarano M. Burden of valvular heart diseases: a population-based study. Lancet (2006) 368:1005–11. doi: 10.1016/S0140-6736(06)69208-8
2. Hein S, Arnon E, Kostin S, Schönburg M, Elsässer A, Polyakova V, et al. Progression from compensated hypertrophy to failure
in the pressure-overloaded human: heart structural deterioration
and compensatory mechanisms. Circulation (2003) 107:984–91.
doi: 10.1161/01.CIR.0000051865.66123.B7
3. Lancellotti P, Nchimi A. Coronary microvascular reserve and outcome in aortic stenosis: pathophysiological significance vs. clinical relevance. Eur Heart J. (2017) 38:1230–32. doi: 10.1093/eurheartj/ehw635
4. Chin CWL, Pawade TA, Newby DE, Dweck MR. Risk stratification in patients with aortic stenosis using novel imaging approaches. Circ Cardiovasc Imaging (2015) 8:e003421. doi: 10.1161/CIRCIMAGING.115.003421
5. Nishimura RA, Otto CM, Bonow RO, Carabello BA, Erwin JP, Guyton RA, et al. 2014 AHA/ACC guideline for the management of patients with valvular heart disease: executive summary :a report of the american college of cardiology/american heart association task force on practice guidelines. Circulation (2014) 129:2440–92. doi: 10.1161/CIR.0000000000000029 6. Baumgartner H (Chair), Hung J (co-chair), Bermejo J, Chambers JB,
Edvardsen T, Goldstein S, et al. Recommendations on the echocardiographic assessment of aortic valve stenosis: a focused update from the European association of cardiovascular imaging and the American Society of Echocardiography. Eur Hear J Cardiovasc Imaging (2017) 18:254–75. doi: 10.1093/ehjci/jew335
7. Lancellotti P, Magne J, Donal E, Davin L, O’Connor K, Rosca M, et al. Clinical outcome in asymptomatic severe aortic stenosis. J Am Coll Cardiol (2012) 59:235–43. doi: 10.1016/j.jacc.2011.08.072
8. Dulgheru R, Pibarot P, Sengupta PP, Piérard LA, Rosenhek R, Magne J, et al. Multimodality imaging strategies for the assessment of aortic stenosis: viewpoint of the heart valve clinic international database (HAVEC) group. Circ Cardiovasc Imaging (2016) 9:e004352. doi: 10.1161/CIRCIMAGING.115.004352
9. Moher D, Shamseer L, Clarke M, Ghersi D, Liberati A, Petticrew M, et al. Preferred reporting items for systematic review and meta-analysis protocols (PRISMA-P) 2015 statement. Syst Rev J. (2015) 4:1–9. doi: 10.1186/2046-4053-4-1
10. Higgins JPT, Altman DG, Gotzsche PC, Juni P, Moher D, Oxman AD, et al. The Cochrane Collaboration’s tool for assessing risk of bias in randomised trials. BMJ (2011) 343:d5928. doi: 10.1136/bmj.d5928
11. Cooper HM, Hedges LV. Research synthesis as a scientific enterprise. In: Handb Res Synth Meta-analysis (1994) p. 3–17. Available online at: https:// books.google.de/books?id=p-aFAwAAQBAJ
12. Paule RC, Mandel J. Consensus values and weighting factors. J Res Natl Bur Stand. (1982) 87:377–85. doi: 10.6028/jres.094.020
13. Borenstein M, Hedges L, Higgins J, Rothstein H. Introduction to Meta-Analysis. Chichester: Wiley & Sons (2009).
14. Blaha MJ, Budoff MJ, Rivera JJ, Khan AN, Santos RD, Shaw LJ, et al. Relation of aortic valve calcium detected by cardiac computed tomography to all-cause mortality. Am J Cardiol. (2010) 106:1787–91. doi: 10.1016/j.amjcard.2010.08.019
15. Nguyen V, Cimadevilla C, Estellat C, Codogno I, Huart V, Benessiano J, et al. Haemodynamic and anatomic progression of aortic stenosis. Heart (2015) 101:943–47. doi: 10.1136/heartjnl-2014-307154
16. Cueff C, Serfaty JM, Cimadevilla C, Laissy JP, Himbert D, Tubach F, et al. Measurement of aortic valve calcification using multislice computed tomography:correlation with haemodynamic severity of aortic stenosis and clinical implication for patients with low ejection fraction. Heart (2011) 97:721–26. doi: 10.1136/hrt.2010.198853
17. Cowell SJ, Newby DE, Burton J, White A, Northridge DB, Boon
NA, et al. Aortic valve calcification on computed tomography
predicts the severity of aortic stenosis. Clin Radiol. (2003) 58:712–16. doi: 10.1016/S0009-9260(03)00184-3
18. Dweck MR, Jenkins WSA, Vesey AT, Pringle MAH, Chin CWL, Malley TS, et al. 18F-Sodium Fluoride uptake is a marker of active calcification and disease progression in patients with aortic stenosis. Circ Cardiovasc Imaging (2014) 7:371–78. doi: 10.1161/CIRCIMAGING.113.001508
19. Chin CWL, Shah ASV, McAllister DA, Cowell SJ, Alam S, Langrish JP, et al. High-sensitivity troponin i concentrations are a marker of an advanced hypertrophic response and adverse outcomes in patients with aortic stenosis. Eur Heart J. (2014) 35:2312–21. doi: 10.1093/eurheartj/ehu189
20. Shah ASV, Chin CWL, Vassiliou V, Cowell SJ, Doris M, Kwok TC, et al. Left ventricular hypertrophy with strain and aortic stenosis. Circulation (2014) 130:1607–16. doi: 10.1161/CIRCULATIONAHA.114.011085
21. Chin CWL, Messika-Zeitoun D, Shah ASV, Lefevre G, Bailleul S, Yeung ENW, et al. A clinical risk score of myocardial fibrosis predicts adverse outcomes in aortic stenosis. Eur Heart J. (2016) 37:713–23. doi: 10.1093/eurheartj/ ehv525
22. Vassiliou VS, Perperoglou A, Raphael CE, Joshi S, Malley T, Everett R, et al. Midwall Fibrosis and 5-Year Outcome in Moderate and Severe Aortic Stenosis. J Am Coll Cardiol. (2017) 69:1755–56. doi: 10.1016/j.jacc.2017.01.034 23. Dweck MR, Joshi S, Murigu T, Alpendurada F, Jabbour A, Melina G, et al. Midwall fibrosis is an independent predictor of mortality in patients with aortic stenosis. J Am Coll Cardiol. (2011) 58: 1271–9. doi: 10.1016/j.jacc.2011.03.064
24. Azevedo CF, Nigri M, Higuchi ML, Pomerantzeff PM, Spina GS, Sampaio RO, et al. Prognostic significance of myocardial fibrosis quantification by histopathology and magnetic resonance imaging in patients with severe aortic valve disease. J Am Coll Cardiol. (2010) 56:278–87. doi: 10.1016/j.jacc.2009.12.074
25. Weidemann F, Herrmann S, Störk S, Niemann M, Frantz S,
Lange V, et al. Impact of myocardial fibrosis in patients with symptomatic severe aortic stenosis. Circulation (2009) 120:577–84. doi: 10.1161/CIRCULATIONAHA.108.847772
26. Barone-Rochette G, Piérard S, De Meester De Ravenstein C, Seldrum S, Melchior J, Maes F, Pouleur AC, et al. Prognostic significance of LGE by CMR in aortic stenosis patients undergoing valve replacement. J Am Coll Cardiol. (2014) 64:144–54. doi: 10.1016/j.jacc.2014.02.612
27. Musa T Al, Uddin A, Swoboda PP, Garg P, Fairbairn TA, Dobson LE, et al. Myocardial strain and symptom severity in severe aortic stenosis: insights from cardiovascular magnetic resonance. Quant Imaging Med Surg. (2017) 7:38–47. doi: 10.21037/qims.2017.02.05
28. Dahl JS, Videbaek L, Poulsen MK, Rudbaek TR, Pellikka PA, Moller JE, et al. Global strain in severe aortic valve stenosis: relation to clinical outcome
after aortic valve replacement. Circ Cardiovasc Imaging (2012) 5:613–20. doi: 10.1161/CIRCIMAGING.112.973834
29. Aksoy O, Cam A, Agarwal S, Ige M, Yousefzai R, Singh D, et al. Significance of aortic valve calcification in patients with low-gradient low-flow aortic stenosis. Clin Cardiol. (2014) 37:26–31. doi: 10.1002/clc.22212
30. Feuchtner G, Müller S, Grander W, Alber H, Bartel T, Friedrich G, et al. Aortic valve calcification as quantified with multislice computed tomography predicts short-term clinical outcome in patients with asymptomatic aortic stenosis. J Heart Valve Dis. (2006) 15:494–8.
31. Utsunomiya H, Yamamoto H, Kitagawa T, Kunita E, Urabe Y, Tsushima H, et al. Incremental prognostic value of cardiac computed tomography angiography in asymptomatic aortic stenosis: significance of aortic valve calcium score. Int J Cardiol. (2013) 168:5205–11. doi: 10.1016/j.ijcard.2013.07.235
32. Lee H, Park JB, Yoon YE, Park EA, Kim HK, Lee W, et al. Noncontrast Myocardial T1 mapping by cardiac magnetic resonance predicts outcome in patients with aortic stenosis. JACC Cardiovasc Imaging (2017) 11:974–83 doi: 10.1016/j.jcmg.2017.09.005
33. Messika-Zeitoun D, Aubry M-C, Detaint D, Bielak LF, Peyser P a, Sheedy PF, et al. Evaluation and clinical implications of aortic valve calcification measured by electron-beam computed tomography. Circulation (2004) 110:356–62. doi: 10.1161/01.CIR.0000135469.82545.D0
34. Clavel M-A, Pibarot P, Messika-Zeitoun D, Capoulade R, Malouf J, Aggarval S, et al. Impact of aortic valve calcification, as measured by MDCT, on survival in patients with aortic stenosis results of an international registry study. J Am Coll Cardiol. (2014) 64:1202–13. doi: 10.1016/j.jacc.2014.05.066
35. Chin CWL, Everett RJ, Kwiecinski J, Vesey AT, Yeung E, Esson G, et al. Myocardial Fibrosis and Cardiac Decompensation in Aortic Stenosis. JACC Cardiovasc Imaging (2017) 10:1320–33. doi: 10.1016/j.jcmg.2016.10.007 36. Singh A, Greenwood JP, Berry C, Dawson DK, Hogrefe K, Kelly DJ,
et al. Comparison of exercise testing and CMR measured myocardial perfusion reserve for predicting outcome in asymptomatic aortic stenosis: the Prognostic importance of MIcrovascular dysfunction in aortic stenosis (PRIMIDAS) study. Eur Heart J. (2017) 38:1222–29. doi: 10.1093/eurheartj/ehx001
37. Pellikka PA, Sarano ME, Nishimura RA, Malouf JF, Bailey KR, Scott CG, et al. Outcome of 622 adults with asymptomatic, hemodynamically significant aortic stenosis during prolonged follow-up. Circulation (2005) 111:3290–95. doi: 10.1161/CIRCULATIONAHA.104.495903
38. Agatston AS, Janowitz WR, Hildner FJ, Zusmer NR, Viamonte M, Detrano R. Quantification of coronary artery calcium using ultrafast computed tomography. J Am Coll Cardiol. (1990) 15:827–32. doi: 10.1016/0735-1097(90)90282-T
39. Flett AS, Sado DM, Quarta G, Mirabel M, Pellerin D, Herrey AS, et al. Diffuse myocardial fibrosis in severe aortic stenosis: an equilibrium contrast cardiovascular magnetic resonance study. Eur Heart J Cardiovasc Imaging (2012) 13:819–26. doi: 10.1093/ehjci/jes102
40. Flett AS, Hayward MP, Ashworth MT, Hansen MS, Taylor AM,
Elliott PM, et al. Equilibrium contrast cardiovascular magnetic
resonance for the measurement of diffuse myocardial fibrosis:
preliminary validation in humans. Circulation (2010) 122:138–44. doi: 10.1161/CIRCULATIONAHA.109.930636
41. Nazarian S. Is ventricular arrhythmia a possible mediator of the association between aortic stenosis-related midwall fibrosis and mortality? J Am Coll Cardiol. (2011) 58:1280–82. doi: 10.1016/j.jacc.2011.04.045
42. Flett AS, Hasleton J, Cook C, Hausenloy D, Quarta G, Ariti C, et al. Evaluation of techniques for the quantification of myocardial scar of differing etiology using cardiac magnetic resonance. JACC Cardiovasc Imaging (2011) 4:150–6. doi: 10.1016/j.jcmg.2010.11.015
43. Hamilton-Craig CR, Strudwick MW, Galloway GJ. T1 Mapping for Myocardial fibrosis by cardiac magnetic resonance relaxometry - a comprehensive technical review. Front Cardiovasc Med. (2016) 3:1–11. doi: 10.3389/fcvm.2016.00049
44. Dweck MR, Khaw HJ, Sng GKZ, Luo ELC, Baird A, Williams MC, et al. Aortic stenosis, atherosclerosis, and skeletal bone: Is there a common link with calcification and inflammation? Eur Heart J. (2013) 34:1567–74. doi: 10.1093/eurheartj/eht034
45. Marincheva-Savcheva G, Subramanian S, Qadir S, Figueroa A, Truong Q, Vijayakumar J, et al. Imaging of the aortic valve using fluorodeoxyglucose positron emission tomography: increased valvular fluorodeoxyglucose uptake in aortic stenosis. J Am Coll Cardiol. (2011) 57:2507–15. doi: 10.1016/j.jacc.2010.12.046
46. Dweck MR, Jones C, Joshi NV., Fletcher AM, Richardson H, White A, et al. Assessment of valvular calcification and inflammation by positron emission tomography in patients with aortic stenosis. Circulation (2012) 125:76–86. doi: 10.1161/CIRCULATIONAHA.111.051052
47. Thanassoulis G, Campbell CY, Owens DS, Smith JG, Smith AV, Peloso GM, et al. Genetic associations with valvular calcification and aortic stenosis. N Engl J Med. (2013) 368:503–12. doi: 10.1056/NEJMoa1109034
48. Aggarwal SR, Clavel M-A, Messika-Zeitoun D, Cueff C, Malouf J, Araoz PA, et al. Sex differences in aortic valve calcification measured by multidetector computed tomography in aortic stenosis. Circ Cardiovasc Imaging (2013) 6:40–7. doi: 10.1161/CIRCIMAGING.112.980052
49. Abramowitz Y, Jilaihawi H, Pibarot P, Chakravarty T, Kashif M, Kazuno Y, et al. Severe aortic stenosis with low aortic valve calcification: characteristics and outcome following transcatheter aortic valve implantation. Eur Heart J Cardiovasc Imaging (2017) 18:639–47. doi: 10.1093/ehjci/jex006
50. Mahmod M, Piechnik SK, Levelt E, Ferreira VM, Francis JM, Lewis A, et al. Adenosine stress native T1 mapping in severe aortic stenosis: evidence for a role of the intravascular compartment on myocardial T1 values. J Cardiovasc Magn Reson (2014) 16:92. doi: 10.1186/s12968-014-0092-y
51. Mancio J, Fontes-Carvalho R, Oliveira M, Caeiro D, Braga P, Bettencourt N, et al. Coronary artery disease and symptomatic severe aortic valve stenosis: clinical outcomes after transcatheter aortic valve implantation. Front Cardiovasc Med. (2015) 2:18. doi: 10.3389/fcvm.2015.00018
52. Kellman P, Bandettini WP, Mancini C, Hammer-Hansen S, Hansen MS, Arai AE. Characterization of myocardial T1-mapping bias caused by intramyocardial fat in inversion recovery and saturation recovery techniques. J Cardiovasc Magn Reson (2015) 17:33. doi: 10.1186/s12968-015-0136-y 53. Mewton N, Liu CY, Croisille P, Bluemke D, Lima J. Assessment of Myocardial
fibrosis with cardiac magnetic resonance. J Am Coll Cardiol. (2011) 57:891– 903. doi: 10.1016/j.jacc.2010.11.013.
54. Treibel TA, Kozor R, Schofield R, Benedetti G, Fontana M, Bhuva AN, et al. Reverse myocardial remodeling following valve replacement in patients with aortic stenosis. (2018) 71:860–871. doi: 10.1016/j.jacc.2017.12.035
55. van Ooij P, Markl M, Collins JD, Carr JC, Rigsby C, Bonow RO, et al. Aortic valve stenosis alters expression of regional aortic wall shear stress: New insights from a 4-dimensional flow magnetic resonance imaging study of 571 subjects. J Am Heart Assoc. (2017) 6:e005959. doi: 10.1161/JAHA.117.005959 56. Oury C, Servais L, Bouznad N, Hego A, Nchimi A, Lancellotti P. MicroRNAs
in valvular heart diseases: potential role as markers and actors of valvular and cardiac remodeling. Int J Mol Sci. (2016) 17:1120. doi: 10.3390/ijms17071120 57. Lancellotti P, Dulgheru R, Magne J, Henri C, Servais L, Bouznad N,
et al. Elevated plasma soluble sT2 is associated with heart failure symptoms and outcome in aortic stenosis. PLoS ONE (2015) 10:e0138940 doi: 10.1371/journal.pone.0138940
58. Jung C, Lichtenauer M, Figulla H-R, Wernly B, Goebel B, Foerster M, et al. Microparticles in patients undergoing transcatheter aortic valve implantation (TAVI). Heart Vessels (2017) 32:458–66. doi: 10.1007/s00380-016-0885-z 59. Wernly B, Lichtenauer M, Jirak P, Eder S, Reiter C, Kammler J, et al. Soluble
ST2 predicts 1-year outcome in patients undergoing transcatheter aortic valve implantation. Eur J Clin Invest. (2017) 47:149–57. doi: 10.1111/eci.12719 Conflict of Interest Statement: The authors declare that the research was conducted in the absence of any commercial or financial relationships that could be construed as a potential conflict of interest.
Copyright © 2018 Nchimi, Dibato, Davin, Schoysman, Oury and Lancellotti. This is an open-access article distributed under the terms of the Creative Commons Attribution License (CC BY). The use, distribution or reproduction in other forums is permitted, provided the original author(s) and the copyright owner(s) are credited and that the original publication in this journal is cited, in accordance with accepted academic practice. No use, distribution or reproduction is permitted which does not comply with these terms.