Personalized Large Scale Classification of
Public Tenders on Hadoop
Mathieu Dumoulin
Maîtrise en informatique
Québec, Canada
Résumé
Ce projet a été réalisé dans le cadre d’un partenariat entre Fujitsu Canada et Université Laval. Les besoins du projets ont été centrés sur une problématique d’affaire définie conjointement avec Fujitsu. Le projet consistait à classifier un corpus d’appels d’offres électroniques avec une approche orienté big data. L’objectif était d’identifier avec un très fort rappel les offres pertinentes au domaine d’affaire de l’entreprise. Après une séries d’expérimentations à petite échelle qui nous ont permise d’illustrer empiriquement (93% de rappel) l’efficacité de notre approche basé sur l’algorithme BNS (Bi-Normal Separation), nous avons implanté un système complet qui exploite l’infrastructure technologique big data Hadoop. Nos expérimentations sur le système complet démontrent qu’il est possible d’obtenir une performance de classifi-cation tout aussi efficace à grande échelle (91% de rappel) tout en exploitant les gains de performance rendus possible par l’architecture distribuée de Hadoop.
Abstract
This project was completed as part of an innovation partnership with Fujitsu Canada and Université Laval. The needs and objectives of the project were centered on a business problem defined jointly with Fujitsu. Our project aimed to classify a corpus of electronic public tenders based on state of the art Hadoop big data technology. The objective was to identify with high recall public tenders relevant to the IT services business of Fujitsu Canada. A small scale prototype based on the BNS algorithm (Bi-Normal Separation) was empirically shown to classify with high recall (93%) the public tender corpus. The prototype was then re-implemented on a full scale Hadoop cluster using Apache Pig for the data preparation pipeline and using Apache Mahout for classification. Our experimentation show that the large scale system not only maintains high recall (91%) on the classification task, but can readily take advantage of the massive scalability gains made possible by Hadoop’s distributed architecture.
Contents
Résumé iii
Abstract v
Contents vii
List of Tables xi
List of Figures xiii
Thanks xix
1 Introduction 1
1.1 The Age of Big Data . . . 1
1.2 The Fujitsu Innovation Center (FIC) . . . 3
1.3 Collaboration for Big Data Innovation . . . 3
1.4 The Business Problem . . . 4
1.5 Project Objectives . . . 7
1.6 Sieve as a Big Data Problem . . . 8
1.7 Organization of This Memoir . . . 8
2 Big Data and Apache Hadoop 11 2.1 Introduction . . . 11
2.2 History of Hadoop . . . 14
2.3 Hadoop: Technical Overview . . . 18
2.4 The Hadoop Ecosystem . . . 31
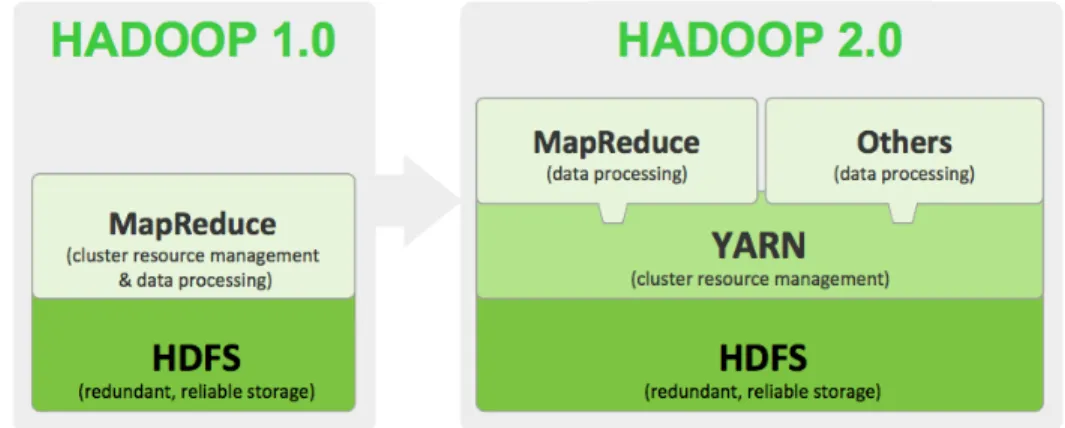
2.5 The Future of Hadoop is YARN . . . 37
2.6 Alternatives and Criticisms . . . 38
2.7 Conclusion . . . 40
3 Machine Learning 43 3.1 Artificial Intelligence and Machine learning . . . 43
3.2 Solving Problems with Machine Learning . . . 45
3.3 Supervised Machine Learning Fundamentals . . . 49
3.4 Supervised Learning Algorithms . . . 61
3.6 Machine Learning for Text Classification . . . 76
3.7 Scaling up Text Classification . . . 87
3.8 Conclusion . . . 91
4 Machine Learning, Hadoop and MapReduce 93 4.1 What Can Hadoop Do for Machine Learning . . . 93
4.2 MapReduce and Machine Learning in the Scientific Literature . . . 94
4.3 Mahout the Elephant Driver . . . 95
4.4 Machine Learning with Pig . . . 101
4.5 Conclusion . . . 102
5 Methodology - Process 103 6 Experimental Log: Machine Learning Problem 107 6.1 Business Understanding: The Problem Statement . . . 107
6.2 Data Understanding: The Sieve Corpus . . . 111
6.3 Data Preparation for the Prototype . . . 120
6.4 Modeling: Building the Prototype . . . 128
6.5 Evaluation of the Model . . . 132
6.6 Deployment . . . 136
6.7 Prototype: Final Review . . . 136
7 Experimental Log: Moving to the Large Scale with Hadoop 139 7.1 Business Understanding . . . 139
7.2 Data Understanding . . . 140
7.3 Data Preparation with Pig . . . 140
7.4 Modeling: Large Scale Classification with Mahout . . . 142
7.5 Evaluation of the Large-Scale Model . . . 144
7.6 Deployment: Using the Model in Production . . . 147
7.7 Large Scale Hadoop Prototype: Final Review . . . 148
8 Conclusion 149 8.1 Final Report . . . 149
8.2 Future Works . . . 151
8.3 Parting Words . . . 154
Bibliography 155 A Data Flow Diagrams 173 B Machine Learning 175 B.1 Advice on Work Flow for Applied Machine Learning . . . 175
B.2 Stop Words . . . 177
B.3 Grid Search Parameters . . . 177
C.1 Introduction . . . 179
C.2 Training . . . 179
C.3 Technical Advice on Hadoop Programming . . . 180
C.4 Conclusion . . . 184
D Code Listings 185 D.1 Language Detection Code . . . 185
List of Tables
3.1 A confusion matrix for a three class problem (classes A, B and C) . . . 71
6.1 The original sieve dataset had very few labeled notices . . . 112
6.2 The language of the notices of the original corpus are either in English, French or are bilingual . . . 112
6.3 The original sieve dataset notices are short but with extreme ranges in sizes . . . 113
6.4 Top 10 words by frequency for each of the original corpus categories (after re-moving stop words and punctuation, all words to lowercase) . . . 115
6.5 The original Sieve notices extracted from the MySQL database . . . 122
6.6 The first version of the dataset was very small. . . 122
6.7 The corpus evolved over the course of the project until its final version . . . 123
6.8 The Tf-Idf and BNS weights for the EMAIL_TAG is very low (final corpus). . . . 124
6.9 The original corpus vocabulary is reduced after stemming with the Porter stemmer.126 6.10 The final corpus vocabulary is also reduced from using the Porter stemmer. . . . 126
6.11 BNS improves the classification performance over Tf-Idf on the original corpus . 133 6.12 BNS improves the classification performance over Tf-Idf for the final corpus . . . 133
6.13 A selection of top words as scored by BNS . . . 133
6.14 Splitting not-relevant into spam and not-relevant helped the classification algo-rithm differentiate notices . . . 134
6.15 Final precision for spam detection . . . 135
6.16 Final classification results for both classification models . . . 137
7.1 Mahout classification of relevant vs. spam with Adaptive Logistic Regression . . 144
7.2 The BNS vectorization Pig script running time vs. Hadoop cluster size for a 1TB dataset . . . 147
List of Figures
2.1 The three main Hadoop distributions . . . 17
2.2 Map and Reduce, from input to output (source: ibm.com) . . . 21
2.3 How MapReduce Works (source: blog.pivotal.io) . . . 22
2.4 Mary and MapReduce: From Input to output (source: Alan Gates in Programming Pig) . . . 25
2.5 Mary and MapReduce: Shuffle and Reduce . . . 26
2.6 Wordcount solved with MapReduce whole system view (source: www.yuyellowpages.net) 27 2.7 Hadoop Job Architecture . . . 28
2.8 The HDFS Architecture (source: Apache Hadoop) . . . 29
2.9 Hadoop is at the center of a growing number of supporting components collec-tively called the Hadoop Ecosystem . . . 32
2.10 YARN adds an abstraction layer over HDFS (source:Hortonworks) . . . 37
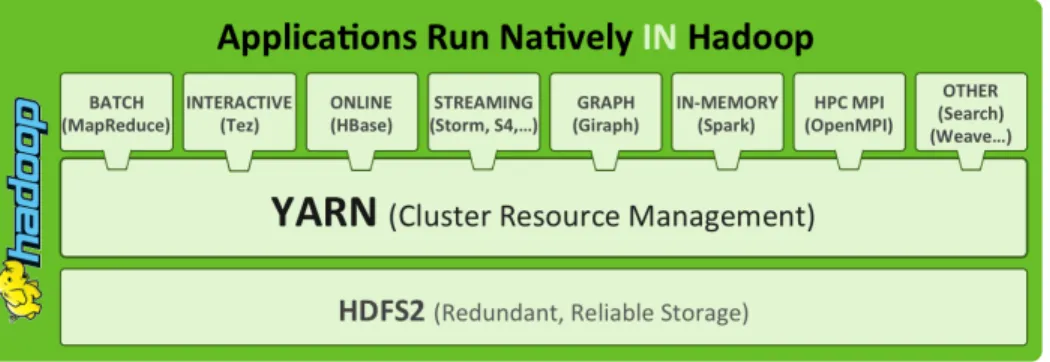
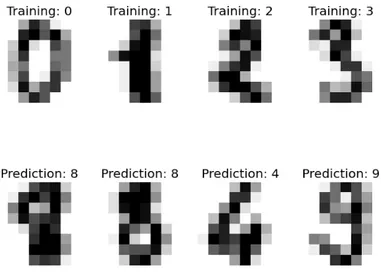
2.11 With YARN, MapReduce is one of many ways to process data in HDFS (source:Hortonworks) 38 3.1 Handwritten digits classification using machine learning (source: scikit-learn. org (Feb 2014)) . . . 44
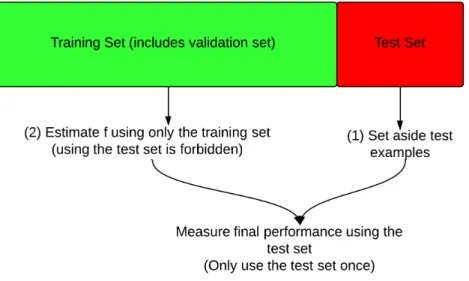
3.2 A high level view of the usual experimental process when using supervised ma-chine learning techniques (source: Leon Bottou) . . . 49
3.3 Cross Validation with 4 folds (source: Ruiz et al. . . 54
3.4 Flow diagram for supervised learning (source: Scikit-Learn) . . . 56
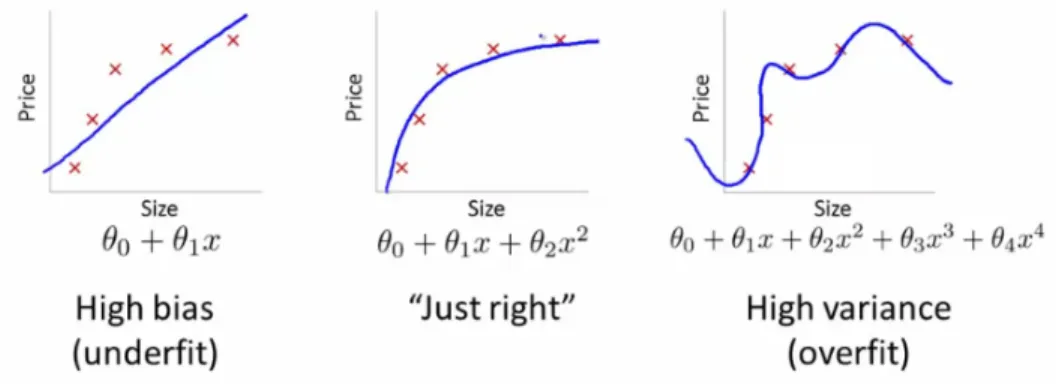
3.5 From underfitting to overfitting the model (source: Andrew Ng) . . . 57
3.6 Bias vs. Variance Tradeoff (source: Scott Fortmann-Roe) . . . 59
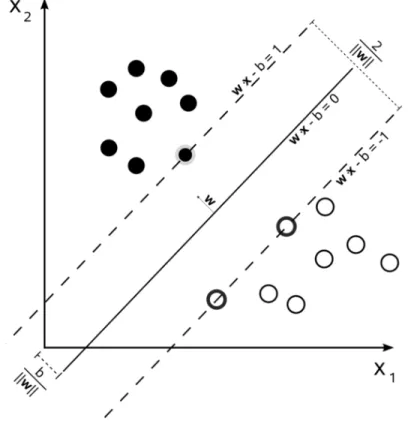
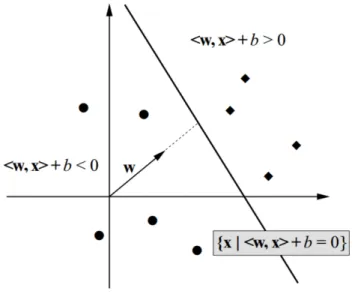
3.7 Maximal margins for SVM trained with the data shown. The points on the margins are called the support vectors (source: Wikipedia) . . . 62
3.8 The term w is a vector that describes a hyperplane with offset b from the origin (source: Wikipedia) . . . 63
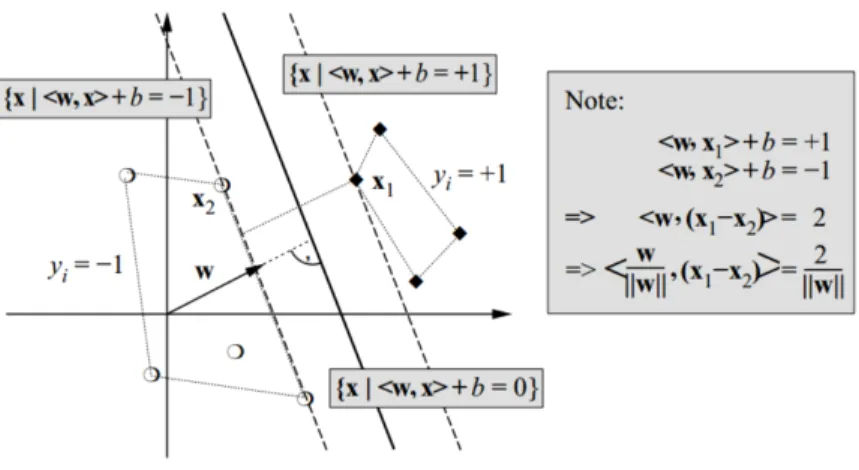
3.9 The margins are constructed from a linear combination of examples x. The sup-port vectors are those examples right on the margin. . . 64
3.10 When the data is not linearly separable, we must tolerate incorrectly classified examples, but with a penalty ξ. . . 65
3.11 The hinge loss owes its name to the graph, with a clear hinge at 1 . . . 66
3.12 The standard logistic function (source: Wikipedia) . . . 68
3.13 The decision boundary of logistic regression in two dimensions (source: Andrew Ng) . . . 68
3.15 Precision and Recall (source: University of Toronto) . . . 73
3.16 The learning curves can show problems of bias and variance (source: www.astroml. org) . . . 75
3.17 The ROC Curve helps to evaluate the performance of a classifier (made with R) . 76 3.18 Each document is represented as a vector in the vector space model (source: Wikipedia) . . . 79
3.19 The normal distribution (made with R) . . . 85
3.20 The cumulative inverse normal distribution (source: Pat Bartlein) . . . 85
3.21 All models perform the same on the same data, but more data improves perfor-mance (source: Xavier Amatriain) . . . 88
4.1 Distributing the parameter search using MapReduce . . . 95
4.2 Item-Item co-occurrence matrix common to recommender engines (source: Ted Dunning for MapR) . . . 98
4.3 Kmeans clustering in Mahout (source: Apache Mahout) . . . 98
4.4 The Stochastic Gradient Descent algorithm on the Iris dataset (source: Scikit-learn 100 4.5 Learning in parallel naturally leads to ensemble methods (source: Jeremy Lin) . . 102
5.1 Process diagram showing the relationship between the different phases of CRISP-DM (source: Wikipedia) . . . 104
6.1 Layout of tenders on merx.com . . . 108
6.2 The word count graph for the book Moby Dick shows a classical Zipf curve. (source: NLTK) . . . 114
6.3 The top 25 words by frequency for the relevant notices of the original corpus . . . 115
6.4 The top 25 words by frequency for the not relevant notices of the original corpus 116 6.5 etcML classification results for relevant vs. spam . . . 119
6.6 The data preparation step was an iterative process involving many round trips from the bash script to classification . . . 120
6.7 The full data preparation pipeline begins with the raw data and ends with vectors ready for use as inputs for the machine learning algorithms. . . 127
6.8 The first classification model for public tender notices was too simple. . . 128
6.9 New tenders will go through two classificators after pre-processing and vectoriza-tion. . . 129
6.10 The classification process from input to results . . . 131
6.11 The recall increases with the weight on relevant examples when training . . . 135
6.12 The cross-validated recall is best at a weight of 5 . . . 135
6.13 The ROC curve for relevant vs. spam . . . 137
7.1 For the Hadoop system, we replace Python with Pig . . . 141
7.2 The processing pipeline on Hadoop uses Pig to vectorize the text notices. . . 143
7.3 The recall improves with corpus size . . . 145
7.4 Comparing the prototype with Mahout’s SVM and SGD algorithms . . . 146
7.5 Executing the Hadoop solution’s pipeline . . . 148
D.1 Clean and normalize script part one . . . 187 D.2 Clean and normalize script part two . . . 188
To my parents and brothers, my directors François Laviolette and Luc Lamontagne as well as Andriy Burkov, Sébastien Paquet and Albert Craig of Fujitsu Canada who believed in me from the start.
To Shigemi and all my children who gave me purpose and motivation.
“Listening to the data is important, but so is experience and intuition. After all, what is intuition at its best but large amounts of data of all kinds filtered through a human brain rather than a math model?”
Thanks
This project would not have been possible without the generous support from many people and organisations.
From Université Laval, I thank my director François Laviolette and co-director Luc Lamon-tagne for their steadfast support, encouragement. They have been mentors and friends. I will prize the relationship we have built over the course of this project for the rest of my life. Also from Université Laval, I have to thank Mario Marchand who convinced me to choose to do my Master’s degree in Québec.
Special thanks go to Fujitsu Canada’s Albert Craig and Guy Michaud. Albert’s leadership and drive were contagious. I learned a lot from a business point of view from him. Guy’s input helped a lot at the beginning of the process. He was always patient and kind in equal parts. We would not have understood the problem as well without his help.
I also thank former members of the Fujitsu Innovation Center’s, Sébastien Paquet and Andriy Burkov, who initially believed in me.
Finally thanks to the Natural Sciences and Engineering Research Council of Canada and the Fonds de recherche du Québec – Nature et technologies as well as Fujitsu Canada for their financial support through the BMP Innovation scholarship program.
Chapter 1
Introduction
Big data is about building new analytic applications based on new types of data, in order to better serve your customers and drive a better competitive advantage - David McJannet, Hortonworks
1.1
The Age of Big Data
Since 2012, big data considerably matured. From 2006-2010, big data was on the bleeding edge of technology, mastered only by the technical wizards of the internet giants like Google, Yahoo and Facebook. Now, the tools and technologies have evolved to the point where large-scale data analytics (e.g. big data analytics) are in use at nearly all Fortune 500 companies, and in many internet startups too.
Big data is certainly a technological problem. In that sense, big data is about how to store and process massive amounts of information that can’t be handled by traditional relational databases.
More importantly, the true benefit of big data lies in the ability to gain new insights only possible through the analysis of massive datasets. In this sense, big data can make possible new kinds of data-driven decisions that be turned into a competitive advantage for companies, better outcomes for patients at hospitals or better services to citizens.
Google is one of the first companies to master big data. From its very foundation, Google’s big data processing mastery has served it as an unrivaled competitive advantage that has seen them out-compete rivals like Altavista, Yahoo and Microsoft in the web search and web advertising spaces.
Since then, other technological leaders such as Amazon, Facebook, Linkedin, Twitter and many others have followed building ever more innovative big data systems, scaling their rapidly expanding services to global scale at a previously unheard of speed.
There is an ever widening variety of potential applications that can benefit enormously from big data analytics. One such problem is large-scale unstructured data analytics, or text analyt-ics. In this case, the datasets are web pages, emails, reports and other textual documents. Current research often focuses on narrow aspects of text analytics as machine learning algo-rithms or improvements of the distributed processing system. There is very little published research showing all the working parts of a complete large-scale text analytics pipeline as it might be implemented in a real-world company. Furthermore, current research typically shows results based on toy or artificial datasets with limited real-world applicability.
There would be much to be learned from trying to solve a real big data business problem using a real-world dataset on Apache Hadoop, an emerging standard software infrastructure for big data processing.
This masters thesis presents the results of such a project, the result of an innovative partnership between Université Laval and the Fujitsu Innovation Center.
1.1.1
Initiating Big Data R&D at Université Laval and Fujitsu
Our project was the first project for both the Fujitsu Innovation Center as well as the Computer Science Department of Université Laval on big data based on Apache Hadoop. In fact, it marked the launch of the Big Data Laboratory initiative at Fujitsu Innovation Center. We are also the precursors to a proposed new research center on big data at Université Laval.
We successfully tackled two main challenges:
• Using machine learning, we brought a solution to a previously non-working prototype application developed internally at Fujitsu called Sieve.
• We built a fully functional Hadoop-based Text classification system based on that solu-tion so it could scale to fill the needs of a global enterprise as Fujitsu.
In the rest of this chapter, we will explain the context of our master’s project, starting with the Fujitsu Innovation Center. We will then explain how our project, funded by a BMP Innovation scholarship, fits within the FIC’s mission. Then, we will introduce the business problem that
led to the development of the Sieve application. Finally, we tie together the business problem with machine learning and big data, by showing how the business problem can scale globally for a large enterprise such as Fujitsu.
1.2
The Fujitsu Innovation Center (FIC)
Fujitsu is a leading Japanese information and communication technology (ICT) company offering a full range of technology products, solutions and services. Approximately 170,000 Fujitsu people support customers in more than 100 countries. Renowned for innovation in software and hardware applications, Fujitsu holds over 97,000 patents worldwide.
Fujitsu Innovation Center in Quebec City is one of Fujitsu’s newest laboratories, opening in November 2011. It’s a collaborative space where business partners and customers are invited to work with Fujitsu specialists. Together, they put new ideas into practice to build innovative business solutions.
The very first of its kind in Canada, the FIC is the results of significant investments by Fujitsu as well as Quebec’s Ministry of Economic Development, Innovation and Exports as part of the mobilizing ÉcoloTIC project, which stems from the Stratégie québécoise de la recherche et de l’innovation 2010-2013.
Fujitsu North-America (FNA) as well as Fujitsu Japan has shown interest in a project that could integrate Fujitsu’s server hardware, virtualization and cloud expertise and apply them to the emerging fields of big data and machine learning.
For the FIC, our project was a prime opportunity to explore the new space of big data from a technological point of view.
1.3
Collaboration for Big Data Innovation
This masters project, funded by the BMP Innovation scholarship, is a great fit with the mission of the FIC. It marks the launch of a Big Data research laboratory and brings together the expertise of Fujitsu scientists Andriy Burkov ph.D., Sebastien Paquet ph.D. and Guy Michaud ph.D. with two scientists of the Group d’Apprentissage Automatisé de Laval (GRAAL) Francois Laviolette and Luc Lamontagne. It also leverages the enterprise hardware resources available at Fujitsu’s Quebec City office.
The BMP Innovation Program
Offered jointly by NSERC and the FRQNT, the BMP Innovation program offers scholar-ships to students enrolled in a master’s or doctoral program and interested in undertaking research in natural sciences and engineering, through a university-business partnership.
This project was awarded a prize in the Young Innovator - BMP Innovation 2013 category by the Association pour le développement de la recherche et de l’innovation du Québec (ADRIQ) and the NSERC1.
Association pour le développement de la recherche et de l’innovation du Québec (ADRIQ)
For the past 35 years, the ADRIQ has led a vast business network that is both unique and influential to support technological innovation in Québec and foster partnerships between decision-makers. ADRIQ addresses and disseminates the key concerns and issues of the innovative companies and organizations it represents to develop favorable factors and conditions that are conductive to their success.
1.4
The Business Problem
1.4.1
Fujitsu Canada in early 2012
As we mentioned, this project is the result of a strategic decision by the Fujitsu Innovation Center to foster collaborative innovation by initiating a partnership project through the BMP Innovation scholarship program.
In early 2012, Fujitsu Canada was already interested in the big data field but had no experts in this new technology on staff. The staff scientists, already busy with their own R&D work proposed to use the BMP Innovation program to build up big data expertise. The potential customers for big data technology were the National Defence scientists of the Valcartier military base, large insurance companies of Quebec City and the Québec government. With the general research conditions settled, an existing business problem was chosen to solve using big data technology. This was an ongoing in-house project that had proven to be hard to solve using the existing enterprise programming skills of the Quebec City office of Fujitsu Canada. Specifically, the project’s goal was to automatically discover public tenders for government contracts relevant to Fujitsu’s IT consulting business. The tender discovery process can now be explained in some detail.
1
1.4.2
The Public Tender Bidding Process at Fujitsu
Fujitsu’s Quebec City office does IT consulting for business as well as for Canadian federal and provincial governmental organizations such as Revenue Quebec and Defence Research and Development Canada (DRDC) Valcartier. In most cases, Fujitsu wins governmental IT service contracts by bidding on public tenders. These tenders are found on web sites that provide electronic tendering services such as MERX (www.merx.com).
On a regular basis, these web sites must be manually checked for public tenders in the IT services field that Fujitsu might be interested to bid on. In fact, several Fujitsu managers go through the tenders looking for projects that are of special interest for their areas of expertise, such as defence R&D projects, GIS projects, IT integration projects and so on. Projects are selected based on the nature of the work; Fujitsu does only software IT services, but other factors also come into play such as whether the necessary skills are available among the IT consultants currently available to work, the project deadlines and project budget and so on. This fastidious work is an inefficient use of highly skilled IT experts’ time, so the decision was taken to try and build an in-house application that could help automate the process.
1.4.3
Automating the Discovery of Relevant Tenders with Sieve
The project was called Sieve and Guy Michaud was one of its leaders, serving as the target business user of the project. The project was developed from 2010 to 2012 through the combined efforts of various Fujitsu developers and several interns.
The project was fairly ambitious: crawl web sites, extract information, compare it with existing employee resumes and display a customized and ranked list of relevant public tenders to a user.
Lets examine each functionality in turn:
• Sieve gathers its data using a web crawler that automatically extracts the information from the public tender web pages of the Research and Development category from MERX and saves it in a relational database.
• The tender text content is compared with the resumes of Fujitsu’s Quebec City employee skills profiles (their consultant profiles) so as to identify relevant tenders.
• The user can give feedback to the system on whether a given public tender is in fact relevant or not with a “thumbs up” and “thumbs down” button next public tender in the list.
We were given a demonstration of Sieve, and all features listed above were indeed functioning correctly. But there was a problem with the lists of tenders that Sieve was showing to the users: the list was a seemingly randomized selection of public tenders, most of which had nothing to do with Fujitsu at all. This was a critical flaw that led to the project’s cancellation.
1.4.4
Why Sieve Failed
Ultimately, the Sieve project was abandoned. The main reason being that the application could not produce good results. Indeed, even on the very first page of results, the listing of public tenders consisted in large part of completely irrelevant tenders. Guy Michaud candidly said the results were useless for him. He was still gathering the information directly from the web sites. As explained in later sections, the application was showing poor precision (subsection 3.5.3).
Guy did not trust the application results at all for another critical reason: There was no guar-antee that all relevant notices would be displayed, regardless of ranking. This is problematic because if a Fujitsu manager doesn’t see a relevant public tender, then Fujitsu can’t bid for the contract, meaning a direct financial loss for the company. This, in turn is a problem of low recall (subsection 3.5.3).
In retrospect, we believe that Sieve failed because it was built as an IT project. Fujitsu tried to solve this problem by building a software application, and solving software application problems.
The real business value of the project, however, was showing a list of potentially relevant public tenders to a Fujitsu manager. That was the problem that should have been solved first. This is an important lesson that strongly influenced how we would approach our problem.
1.4.5
Sieve: The Starting Point of the Project
The business problem that Sieve attempted to solve is a real one at Fujitsu. Our project was an ideal chance to try and solve this problem with a new approach.
We believed that the ranking relevancy problem could be solved successfully using supervised machine learning techniques.
1.5
Project Objectives
Our project essentially comes down to trying to answer two questions:
1. Can we address Sieve’s shortcomings using machine Learning?
2. If such a solution can be found, could it be implemented as part of a full text processing pipeline on a Apache Hadoop cluster?
Each question will be treated in turn in this section.
1.5.1
Solve Sieve’s Problem with Machine Learning
As mentioned earlier, the fundamental problem of the Sieve prototype was that it didn’t produce a list of relevant results to its users. This is compounded by the issue of trust, as Fujitsu’s business user had no confidence that all relevant public tenders would be displayed in the first few pages. Since missing what would have been a relevant tender has a negative economic cost to Fujitsu, Sieve’s potential users could not rely on it for their work.
We decided to try and solve this problem using standard text classification techniques. The new solution would try and predict whether a public tender is relevant or not using the “notice” field of the public tender information.
The business requirements put special constraints on the machine learning prototype. Our business user wants to make sure that all possible relevant notices are displayed, even if it means that some irrelevant notices are displayed as well. In addition to tuning the classification for this requirement, we provided solid experimental metrics of classification performance to build trust in the system.
1.5.2
Make it Scalable with Hadoop
Here, the objectives of the project are much more technical in nature. Indeed, true to the innovation mandate of the FIC, our project would have to explore and prototype new emerging big data technologies.
Once we have a running machine learning prototype that can successfully identify potentially relevant public tenders, we would have to try and deploy this solution as a scalable, big data system.
Our target big data infrastructure would be Apache Hadoop, an increasingly popular open-source software framework for storage and large scale processing of data-sets on clusters of commodity hardware.
The goal is to learn to build a fully working large scale machine learning pipeline that can scale to work on a (hypothetical) large-scale collection of arbitrary text documents.
1.6
Sieve as a Big Data Problem
It’s important to clearly state that the specific business problem of public tender classification for Fujitsu’s Québec city office is not a Big Data problem. The problem is very specific and the data is not especially large by modern standards. Given the current state of the art in applied machine learning, the problem is easily handled by a single computer.
Our project is a proof of concept for Fujitsu, with the goal of exploring the big data space through the real world implementation of a working system solving a realistic problem. That being said, our final system is a fully functional large-scale, Hadoop text classification pipeline. It can serve as a starting point for a real production system. The business problem is real and relevant not just to Fujitsu’s Quebec City office but also to Fujitsu’s huge global consulting business.
The fact that our system could potentially serve the needs of such a large organization also gives us a legitimate reason to implement our solution to be highly scalable by using Apache Hadoop.
1.7
Organization of This Memoir
This work is divided into six sections. We start with background material on Hadoop, big data. Then we move on to machine learning and then to large-scale machine learning. A short chapter on methodology will finally be followed by an account of our experimental work and our results.
Specifically, chapter 2 is a high-level introduction to big data, focusing on Apache Hadoop and MapReduce (section 2.3). This will naturally lead to section 2.4 in which we discuss the
Hadoop ecosystem of emerging technologies that run on top of a Hadoop cluster. These tools provide more high level and specialized services that vastly simplify working with a Hadoop cluster.
The chapter 3 will be a high level introduction to Machine Learning. We focus on supervised methods (subsection 3.3.1), which we used for our experiments. In section 3.6, we focus on the problem of text classification.
We explain in subsection 3.6.1 how text can be modeled to be used as input by a supervised learning algorithm. One aspect of text modeling is called term weighting (subsection 3.6.2), where we had one of our critical breakthroughs, replacing the traditional tf-idf algorithm (section 3.6.2)by an alternative algorithm called Bi-Normal Separation (section 3.6.2). Then in subsection 3.6.3 we explain from a slightly more theoretical perspective the different machine learning classification algorithms we use in our experiments: SVM and a parallel version of Logistic Regression.
We discuss the important topic of large-scale text classification to close the chapter in sec-tion 3.7.
The following chapter brings together machine learning and Hadoop in chapter 4. We present Apache Mahout, a high performance Hadoop-based machine learning framework in sec-tion 4.3. We also discuss Apache Pig in subsecsec-tion 2.4.1. Pig is a high level scripting alternative to raw Java MapReduce development that has allowed us to dramatically reduce the amount of code needed to produce a fully functional text analytics system.
Before we can present our experimental results, we give a brief explanation of our method-ological approach through the data mining methodology called CRISP-DM in chapter 5. Now, all the pieces are set, and we can present our experimental process and results, broken down into two major development iterations: first in chapter 6, we developed a prototype that solves the machine learning problem of sorting public tenders as relevant or not relevant. This section is broken down following the CRISP-DM methodology, starting with an in-depth review of our understanding of the business problem in section 6.1, a detailed description of our dataset in section 6.2 and how the dataset was prepared for processing in section 6.3. We explain the construction of the prototype in section 6.4. The prototype applies state of the art machine learning techniques presented in chapter 3. Experimental results obtained using the prototype follow the model description in section 6.5.
Given a working proof-of-concept (or POC) prototype, we can now move on to implementing the same series of processing steps, but this time using Hadoop, running on a cluster of computers. The pipeline of the full-scale system was largely the same as the prototype. but the implementation could not have been more different. The main challenges and solutions are explained in section 7.6.
Again, for the large scale Hadoop system, we go through the steps of data preparation (sec-tion 7.3), modeling (sec(sec-tion 7.4) and evalua(sec-tion (sec(sec-tion 7.5).
For the evaluation of our large-scale system, we not only review the classification performance (subsection 7.5.1) but also give some indicators of the scaling performance (subsection 7.5.2). This master thesis will end with a final report on our large-scale text classification system in chapter 8. This final report (section 8.1) will briefly go over the salient points of our system and how our solution has reached the technical and business goals of the project.
We will end with a discussion of potentially fruitful avenues for further work on the system in the Future Works section in section 8.2.
Chapter 2
Big Data and Apache Hadoop
2.1
Introduction
2.1.1
What is Big Data
It seems like “Big Data” has become a catch-all buzz word in the enterprise IT space over the past two years. It’s a deceptive term however, since it implies that the data we already have is small, which is not exactly true. Another misconception is that the challenge with big data comes from its size alone. It’s certainly true that processing a dataset in the terabytes to petabytes range poses unique IT challenges in terms of storage and processing, but that’s certainly not the only one.
In short, the term big data refers to data that can’t be processed or analyzed using traditional processes or tools. We can understand that in the enterprise market, traditional processes might refer to software running on a single computer, no matter how powerful. For tools, it’s usually relational databases and SANs (Storage Area Network).
The modern mid-sized to global 500 company generates a wealth of data about their products, sales and customers. Typically, they will have some capabilities to analyze this data using business intelligence tools.
There are two problems these companies are facing with their data we will focus on: The volume of data they would like to analyze is increasing at a pace that is outgrowing what traditional relational databases and data warehousing systems can handle cost-effectively. There is a wealth of unstructured data (think emails, web pages and scanned documents as opposed to well formed data in an SQL table) that hold potentially valuable business insights that remains beyond their grasp.
Data is growing more and more rapidly and the rise of unstructured data accounting for 90% of the data today, the time has come for enterprises to re-evaluate their approach to data storage, management and analytics.
Even worse, much of our enterprise process exists as unstructured data, in the heads of workers and lacking any systematic approach for capture, management, communication, measurement and improvement.
While traditional systems remain necessary for specific workloads, the need to address the challenges posed by rising data volume, variety and velocity cost-effectively have created an opportunity for innovation. This framework for understanding the central challenges of big data was first presented in a 2001 Gartner research report by Doglas Laney ([Laney, 2001])1.
These “3 V’s” explain the need that has led to what we know today as big data with Apache Hadoop as its standard bearer.
Gartner’s 3 V’s of Big Data
Volume The increase in data volumes within enterprise systems is caused by transaction volumes and other traditional data types, as well as by new types of data. Too much volume is a storage issue, but too much data is also a massive analysis issue. Variety IT leaders have always had an issue translating large volumes of transactional
information into decisions — now there are more types of information to analyze — mainly coming from social media and mobile (context-aware). Variety includes tabular data (databases), hierarchical data, documents, e-mail, metering data, video, still images, audio, stock ticker data, financial transactions and more.
Velocity This involves streams of data, structured record creation, and availability for access and delivery. Velocity means both how fast data is being produced and how fast the data must be processed to meet demand.
2.1.2
Hadoop for Enterprise Big Data
The Hadoop platform was designed to solve problems where there is a lot of data, from terabytes to petabytes or more. The data can be a mixture of unstructured and structured data, and it doesn’t have to fit nicely into SQL tables.
Hadoop is for situations where you want to run analytics that are deep and computationally extensive, like clustering and targeting. Hadoop is especially suitable in situations where the
cost of a huge traditional server running a relational database becomes prohibitive compared with that of building a cluster of cheap commodity PCs. Furthermore, when the data is really huge, it may just be the only way of processing the data, regardless of cost.
The underlying ideas used to build Hadoop were invented by Google back in their earlier days as a very scalable platform to index the web, their core business. There was nothing on the market that would let them do that, so they built their own platform: MapReduce and the Google File System (GFS). Google’s innovations were incorporated into Nutch, an open source project, and Hadoop was later spun-off from that. Yahoo has played a key role developing Hadoop for enterprise applications.
Hadoop itself has two major components: the Hadoop Distributed File System (HDFS), modeled on GFS, and MapReduce. HDFS is where all the data is stored, MapReduce is the framework used to build applications that can process the data living in HDFS.
There is some confusion about MapReduce, mainly because it is both a Google framework and the algorithmic abstraction that Hadoop and other frameworks use to run parallel and/or distributed programs. From this point on, we will use Google MapReduce to refer to Google’s framework, and MapReduce to refer to the programming abstraction used in Hadoop. Hadoop is a batch-oriented, large-scale, distributed, data processing platform:
• batch-oriented refers to how hadoop processes data by running jobs, one at a time. Each job might take minutes to hours to complete. As such, by design, it is not suitable to answer ad-hoc queries (think SQL query on a RDBMS), or perform real-time or stream processing.
• Hadoop is best on large-scale, read-only datasets. The cost of starting a Hadoop job and Hadoop’s overhead is significant. This means unless there is a lot of data to process, think TB to PB, there are likely better alternatives.
• Hadoop is a distributed computing platform, meaning it stitches together tens to thou-sands of seperate computers to perform as one giant super-computer. It automatically splits up work to perform jobs as fast as possible, on as much data as possible.
• Data processing like analytics is at the heart of the type of problems Hadoop addresses. More on this below.
2.1.3
Use Cases
Hadoop is a good fit for problems that can easily be divided into a number of smaller pieces, which can thus be solved independently. The data is ideally (but not necessarily) in the form of lists, or just a huge chunk of raw information waiting to be processed — be it log files, geospatial data, astronomy data, bioinformatics data, or web pages to be indexed in search engines. Whatever it might be, it is a necessary condition that the final output must not depend on the order in which a lot of data needs to be processed.
The use of Hadoop is now in production in the largest enterprises and organisations for large-scale business intelligence, predictive analytics and data mining. It’s helped make possible the ultra fast growth of some of the most well known technology giants of today such as Yahoo, Facebook, LinkedIn and Twitter.
MapReduce and Hadoop is also present in the scientific litterature, with many applications in such fields as data mining [Cardosa et al., 2011] and bioinformatics [Han and Ong, 2012], among many others. We recommend Lee et al’s paper for a survey of Academic use of MapRe-duce in Lee et al. [2012] for a comprehensive first-look tour of the topic. The MapReMapRe-duce programming model was also implemented in C++, Haskell and python, as well as implemen-tations that run completely in memory2, on GPUs [He et al., 2008, Chen et al., 2012] and
recently in the cloud [Gunarathne et al., 2013, Palanisamy et al., 2011, Fazenda et al., 2012]. Also, Amazon Elastic MapReduce (EMR)3 has allowed this paradigm to gain much more
exposure than ever before, and made it a one-click process. Amazon hosts the Hadoop framework running on Amazon EC2 (Elastic Cloud Computing)4 and Amazon S3 (Simple
Storage Service)5. It has allowed MapReduce computations without the headache of setting up servers and clusters, making them available as a resource that can be easily rented out and charged for, on an hourly basis.
2.2
History of Hadoop
2.2.1
Google’s MapReduce Innovation
MapReduce is a framework, a pattern, and a programming paradigm that allows us to carry out computations over several terabytes of data in a matter of seconds. When it comes to
2 http://www.scaleoutsoftware.com/ 3 http://aws.amazon.com/elasticmapreduce 4 http://aws.amazon.com/ec2 5 http://aws.amazon.com/s3
massive-scale architecture and a huge amount of data, with built-in fault tolerance, there’s nothing better than this. But when we come to define MapReduce programming, it is basically just a combination of two functions — a map function and a reduce function. This shows not just the amount of simplicity exposed by the framework in terms of the efforts of the programmer, but also the sheer power and flexibility of the code that runs under the hood. It was Google that first introduced MapReduce as a framework. It is used to build indexes for Google Web searches! It handles many petabytes of data every day, where programs are executed on a large-scale cluster.
Dean and Ghemawat published the core ideas of MapReduce and the Google File System in two influential papers Dean and Ghemawat [2004], Ghemawat et al. [2003]. Later, Dean published another paper in the topic detailing his experience with the platform in Dean [2006]. Lastly, there was an updated version of the famous MapReduce paper by the original authors in Dean and Ghemawat [2008].
However, this should not push you into thinking that MapReduce is effective only for large datasets and data-intensive computations; what can be more important here is that program-mers without any experience with parallel and distributed systems can easily use distributed resources, with the help of MapReduce programming.
There is a difference between distributed computing and parallel computing. Although parallel computing is more of a modified form of distributed computing, parallel computing generally refers to a large number of processors sharing the same memory or the same disks, while distributed computing is increasingly referred to as a cluster of nodes, where each node is an independent unit with its own memory and disk.
These days, the computational power of carefully tuned and configured clusters of such com-puters can easily match, or even exceed, the performance of several supercomcom-puters that you might have heard of. Another advantage of using such clusters is that they scale horizontally, improving performance roughly in proportion with the number of computers in the cluster. This is a key benefit that has enabled Google to use cheap, commodity hardware to build up their system as they needed it.
MapReduce started life in 2003 as the solution for the future of Google’s web index, but quickly grew as Google’s engineers learned and made use of it’s capabilites. Now, it’s used by Google Analytics, Google Earth and Google Maps, among many of Google’s famous offerings. It could be said that Google grew to be the internet giant of today through the technical edge of the innovative MapReduce system and its successors.
2.2.2
Doug Cutting and Yahoo Create Hadoop
Hadoop finds its origins in the unlikely project of two developers, Doug Cutting and Mike Cafarella, to build a web-scale indexing system in Java in their spare time back in 2002. To make their vision a reality, Doug created Lucene, which is now the premier Java open-source information retrieval library.
The web, even at that time, far exceeded the processing and storage capabilities of most computers at the time. In 2002, according to Netcraft, there were already upwards of 30M registered domains and 15M live web sites6. Scaling to this kind of size would require a
sophisticated distributed architecture for storing such large amount of data. Drawing from Google’s 2003 paper describing the Google File System Ghemawat et al. [2003], Doug and Mike were quickly able to get a distributed storage component working.
All the while, the web was growing at an explosive rate. The indexable web had already reached around 11.5B pages by 2005-20067. Distributed storage was not enough, running
the indexer also required a lot more computational resources. In response, in 2004, they again turned to an exciting Google publication detailing their MapReduce system Dean and Ghemawat [2004], a distributed computing architecture featuring massive scalability, easy and general programming model and great robustness. They integrated the ideas from MapRe-duce and had a working implantation in 2005, where the major components of Nutch were implemented using MapReduce and running on their reimplementation of the GFS, which they called the Nutch Distributed File System (NDFS).
Yahoo, in 2006, interested by the technology’s potential, offered Doug Cutting the resources to develop the distributed computing component. It was split off from Nutch and renamed Hadoop, the name of Cutting’s young son’s yellow elephant stuffed animal8. From the start, Hadoop was developed as an open source project. It joined the Apache Foundation as an Incubator project and has been a top level project of the Apache foundation since 2008. Doug Cutting views the open-source nature of Hadoop (and Lucene/Nutch/Solr) as one of it’s core advantages9.
Work on Hadoop at Yahoo (Yahoo! at the time) progressed quickly, soon bocaming an essen-tial part of Yahoo’s data processing infrastructure. As an open source project, Hadoop was free to be used by anyone, and it was: some of its earliest adopters are notable companies
6
http://www.statisticbrain.com/total-number-of-websites/ (Feb 2014) 7
http://tinyurl.com/lb6p3zg
8Cutting has a gift for names, as another of his major contributions, Lucene, is named after his wife 9Visit http://www.cloudera.com and search for Doug Cutting’s 2012 Hadoop Word keynote video
such as the New York Times, Last.fm and Facebook. Now, Hadoop is at the center of the En-terprise Big Data movement now worth billions of dollars (TODO-> REFERENCE). Hadoop has spawned three major conferences (Hadoop World NY, Hadoop World Santa-Barbara and Hadoop Summit).
2.2.3
Apache Hadoop Today
Hadoop is now the go-to solution for data-driven companies as well as scientific researchers who want to store, process and analyze massive datasets.
Figure 2.1: The three main Hadoop distributions
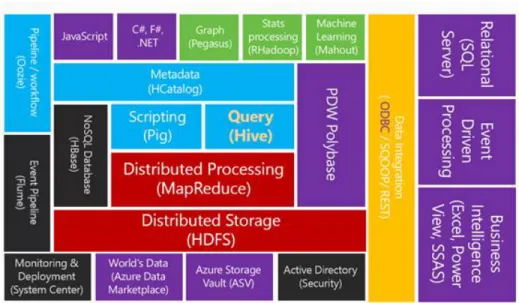
There are currently dozens of Hadoop related projects at the Apache Foundation. So much so that we now talk about the Hadoop Ecosystem (see section 2.4).
Installing and configuring a Hadoop cluster using only the Apache Hadoop JAR files can be a daunting task. Up to about 2008-2009 it was also the only way to install a Hadoop cluster. The process is error prone and requires expertise in Linux and networking (software and hardware) just to get a cluster up and running. Adding computers to a running cluster is also a difficult task.
Things have improved a lot in the last few short years. Hadoop is now available as part of tested packaged distributions from several companies. Building a Hadoop cluster using such distributions is now vastly simplified. These companies also provide enterprise grade support and training. Figure 2.1 shows the logos for the three main companies who make Hadoop distributions: Amazon, Cloudera, Hortonworks and MapR.
There are currently four major players building Hadoop distributions, which integrate the most important members of the Hadoop ecosystem into a well integrated and tested Enterprise-ready system:
Amazon While not strictly speaking a software distribution, Amazon’s Elastic MapReduce (EMR) is a major player that has lowered the bar to try out Hadoop cheaply and easily
with an 100% cloud based system that is well integrated with the equally popular S3 cloud storage.
Cloudera This is the biggest player right now. It’s where Doug Cutting works. They include proprietary innovations like a graphical administration console and Impala (a Google Big Query implementation) in their distribution.
Hortonworks Formed from a spinoff of Yahoo’s core team that implemented Hadoop. They are a major contributor to the Hadoop 2 (or YARN) effort, led by Arun Murthy. An important part of their Hortonworks Data Platform is that it’s 100% open source MapR Their distribution is focused on providing unique, and proprietary, architectural
im-provements. Their CTO is Ted Dunning, an important Mahout contributor and renouned machine learning expert.
Other major gobal IT companies are investing heavily in Apache Hadoop and big data tech-nologies like IBM, EMC and even Intel. As of the end of 2013, none of these alternative distributions have gained any market share. According to slides seen at Strat’s Hadoop World 2013 conference, the market share seems to be evenly split between open-source ’vanilla’ Hadoop, Cloudera’s CDH enterprise-oriented distribution and Hortonworks’ Hadoop Data Platform distribution. MapR, with 10%, holds the 4th place, and all other distributions to-gether are at less than 1%.
Moving forward, we expect the market share of Apache Hadoop to melt away, as Cloudera and Hortonworks battle it out as the premier, ’standard’ Hadoop for the enterprise. The market is in rapid evolution, and we can expect the next few years to evolve rapidly, making our prediction tentative at best.
2.3
Hadoop: Technical Overview
2.3.1
How Does a Hadoop Cluster Work?
Hadoop follows some very important principles in its goal of providing a robust and scalable platform for computation over very large data sets. Firstly, the system must manage itself, and heal itself automatically in the face of inevitable hardware failure. Secondly, its performance should increase linearly as nodes are added to the system. Thirdly, computation moves to the data and not the other way around. Fourthly, the system should be general enough to allow any algorithm to run on the system, and be reasonably simple to develop.
A Hadoop cluster is centrally and automatically managed. The distributed storage is managed in a master-worker architecture. The master is the NameNode, the workers are DataNodes. The programmer doesn’t have to do anything to manage the distributed storage in any way. The jobs are managed by the JobTracker and taskTrackers. The jobTracker automatically breaks down a job into tasks and assigns it to taskTrackers on individual nodes that actually perform the computation required by the task. The programmer does not have to explicitly do any kind of management of what portion of the code is executed where. Both storage and job management duties are performed by the framework independently of the algorithms and data that run on the cluster.
Hardware failure is an inescapable certainty when a cluster reaches a certain size, regardless of the reliability of that hardware. Indeed, with thousands of even the most reliable enterprise hard disk drives, we can expect several failures a week. These failures must be automatically and transparently managed by the framework. By transparent we mean that the developer does not need to factor in failures when developing their code. Jobs might be slowed down, but will eventually complete independently of nodes dropping out of the cluster. Even using commodity hardware, a Hadoop cluster, in aggregate, is very reliable. A Job is given strong guarantees that it will complete without loss of data, so long as there is at least one working node for all the blocks of the data for the application, and as long as there is at least one working node to perform work.
Linear scalability is the holy grail of scalable systems. It is also not possible in practice, as there is always some loss due to overhead. While Hadoop does suffer from this overhead problem (Ranger et al. [2007]), mostly due to communication between the workers and the master, it is still usable up to a cluster size of 4000 nodes with some gains of performance. This is the very definition of horizontal scaling at work.
A limiting factor for parallel performance is how much work can be done in parallel. As there will be some necessary data shuffled between nodes for all but the most embarrassingly parallel algorithm, network performance can quickly become a bottleneck. Distributed storage is not like a single hard disk! The data actually resides on real nodes. The idea is that instead of moving a large amount of data to a work node, it’s a lot more efficient to package the code up (in java, a jar archive) and ship it to the nodes with the data. This is a critical optimization that was copied from the MapReduce paper.
Hadoop uses the MapReduce programming model. MapReduce is a general programming model that enables programmers to write algorithms for a distributed cluster in a relatively simple and general way. While some might dispute how simple it is to formulate a known
algorithm in terms of the Map and reduce primitives, one must keep in mind the alternative of using MPI or other very low level libraries for distributed computing which have a level of complexity orders of magnitude greater.
2.3.2
Map and Reduce as Functional Programming Idioms
Functional Programming is a programming paradigm that uses the mathematical concept of a function as it’s core processing structure. This paradigm has a long history of use with such notable languages as Common Lisp and Scheme which are intimately linked to the very beginnings of the computing revolution of the 60’s and 70’s.
One of the main modern benefits of functional programming comes from the fact that change-able (mutchange-able) state is not allowed. This makes running complex computing on multi-processor or distributed clusters of computers much easier than the vastly more popular object-oriented programming paradigm (See chapter 13 in Spinellis and Gousios [2009]). One of the features of functional programming is called Higher Order Functions. This refers to a function taking another function as parameter and/or producing a new function as its output. Among various higher order functions we find map and reduce:
• Map: this function takes a list of elements and a transformation function as input, and returns a new list of elements where the new elements are the result of applying the transformation function on each of the original elements. Example: aList=[A,B,C,D] map(aList,toLower()) = [a,b,c,d]
• Reduce: Collect the elements of a list into a single value. In this case, the input is again, a list of elements, and a function that can combine the elements until there is only one left.
These concepts map10directly to Hadoop’s core processing approach, called MapReduce.
2.3.3
MapReduce: Parallel by Default
Hadoop is the name of a distributed computing framework. It has two major components: HDFS for distributed storage and MapReduce as a framework for performing distributed, parallel processing on potentially huge datasets stored on HDFS. Originating with a Google system of the same name, MapReduce implemented in C++, It is named for the two primitives available to the developer for expressing algorithms: Map and Reduce (see figure 2.2).
Figure 2.2: Map and Reduce, from input to output (source: ibm.com)
The Map step performs a computation on the entire input dataset, where each individual element takes the form of a key-value pair (Ex: line number as a key, the line of text as the value, in the case of a text file). It then emits (returns) 0 or more new key-value pairs (called intermediate data). The output may be of the same type as the input, or it can be different For example: Integer-Text to Integer-Integer in the case of the canonical Word Count.
The Reduce step combine all the intermediate key-value pairs emitted by the map operations and outputs 0 or more output key-value pairs. All intermediate keys of the same values are sent to the same reducer. The intermediate key-value pairs are automatically combined such that the reduce function’s input is actually a key and a list of all values with have that same key.
Let’s work through a complete, high-level example: The data is a list of all the cities and the city’s population for the country of Canada. The goal is to calculate the total population of each province. The map function reads the input as a key-value pair of <city:Text,population:Int>and performs a transformation to <province:Int,population:Int>. The processing required is to find the correct province for each city by some method (Google Map API, etc.). The reduce operation simply performs a sum of populations for each province, outputting the output key-value pair of <province:Text,population:Int>. In the case of Canada, it will output 10 key-value pairs, one for each Canadian province and it’s total population.
A MapReduce program can be seen as a 5-step parallel and distributed computation (see fig Figure 2.3)11. The step are as follows:
1. The data, in the HDFS distributed storage, is divided into splits (generally 64MB in size). Each split is assigned to a map task to a certain node of the cluster. Best effort is
11
Figure 2.3: How MapReduce Works (source: blog.pivotal.io)
made to assign the split to a map on the computer where the data is located to conserve bandwidth.
2. The map computation is performed on the split, one entry at a time. The map computa-tion has no informacomputa-tion on the other splits, the work is performed in parallel, limited by the hardware resources of the cluster.
3. The output of the map (called intermediate results) is sorted locally by its key and all data with the same key is sent to the same reducer. This step may require a lot of network bandwidth. The values with the same key are merged into an iterable list of values.
4. The reduce computation is performed on the list of values and a final key-value pair is emited.
5. Each reducer’s output is written back to HDFS, which will automatically start to repli-cate it to other nodes based on the replication factor (usually 3).
We will use the canonical WordCount example to illustrate MapReduce. WordCount is just as its name implies, an application that will output the list of words as their counts from some input text document. Note that for a much more detailed and complete WordCount example, we recommened the excellent Hadoop Tutorial on the Apache Hadoop web site12
12
The WordCount Example
Let’s walk through an example MapReduce application, WordCount, to get a flavor for how MapReduce works. WordCount is a simple application that counts the number of occurrences of each word in an input set
Before we begin, note that the WordCount example, while seemingly trivial, illustrates several key concepts for MapReduce programming. Unusually for a “toy” example. WordCount is a practical, real-life MapReduce algorithm. Counting items in a large-scale dataset is useful for statistics like averages and total counts. Wordcount is also a useful building block for more complex algorithms such as those used for this project.
Another reason the example is deceptive is because our example input is tiny, so we don’t need Hadoop to count its words at all! While this will be true for documents up to about 100M word in size, there is a point where simple naive techniques aren’t able to process the collection in a reasonable amount of time. As the size grows, the techniques necessary to get the counts will increase in complexity until nothing short of a cluster of computers will be able to perform the task. That’s when Hadoop will shine.
This will be our example document:
Mary had a little lamb, Little lamb, little lamb, Mary had a little lamb, Its fleece was white as snow
Here is the expected output for WordCount:
Mary 2
had 2
little 3 . . .
Let us now begin. Counting the words of a small document is a trivial task, and can be done in Python like so:
w o r d c o u n t = {}
# For e a c h word i n t h e f i l e , s p l i t on e m p t y c h a r f o r word i n t e x t f i l e . r e a d l i n e s ( ) . s p l i t ( " " ) : # C o u n t t h e word i f word i n w o r d c o u n t : w o r d c o u n t [ word ] += 1 e l s e : w o r d c o u n t [ word ] = 1 # p r i n t t h e word c o u n t s f o r word i n w o r d c o u n t : p r i n t ( word , w o r d c o u n t [ word ] )
So the solution is to read the text file, and for each line, split the line into tokens13. Each token
is added to a dictionary, increasing the associated count as appropriate.
We can now see how we can solve the problem using the MapReduce abstraction. After that, we can give the gory details for how Hadoop will process our WordCount job with the example input document.
WordCount as a MapReduce Job needs to be expressed in a sequence of map and reduce tasks, a high level view of which can be seen in the following figure 2.4.
Map algorithm (pseudo-code):
Map(Key: line num, value: line text) Tokenize the line
for each word emit(key: word, value: 1)
Reduce algorithm (pseudo-code):
Reduce(Key: word, iterator: list of 1) emit(key: word, value: sum of the list)
We need to split the data first, and one reasonable way to do that for a text document might be to split it line by line. Line by line input happens to be the default way text is handled by
13In this example we split on the empty character, but it could be easily done very smartly using NLTK (http://nltk.org)
Hadoop. Each worker nod now has a bunch of (word/1) pairs stored on the local disk. There is a combiner step now, which can perform a pre-grouping of the intermediate results available on each node, which is programmatically configurable by the user. Without going too much into details, this is often the same as the Reduce code and defining it is optional. This process can be seen in Figure 2.4.
Figure 2.4: Mary and MapReduce: From Input to output (source: Alan Gates in Programming Pig)
Next, the pairs (word,1) will be shuffled and sorted so that all the pairs with the same key are sent to the same reducer. This step will require sending data on the network as pairs are shuffled as it were from the node where they were emitted to the node where the reduce task will be run (possibly on the same node). The node where each task is run is defined by the Namenode based on what nodes have open reduce slots. As slower workers tend to lag behind, reduce tasks often start before all map tasks are finished, as data is ready to process and nodes are free to perform the work.
The reduce node then merges the data into an iterable list and sends it as input to the reduce function. The algorithm for the reduce operation is trivial, just sum the list of 1 values and emit that. This is illustrated in Figure 2.5. Although not for the Mary example, the whole process is shown from start to finish in Figure 2.6.
Figure 2.5: Mary and MapReduce: Shuffle and Reduce
The Hadoop framework will write the output of the reduce operation to a file on the distributed storage, and report to the user that the task is done. Good work, Hadoop!
2.3.4
MapReduce Jobs in More Detail
We will go into some additional details but only to a point. Anybody who wishes to go further we refer to the one true, authoritative reference on Hadoop, Tom White’s brilliantly written Hadoop Definitive Guide 3rd Edition (White [2012]).
First, some terminology. A MapReduce job is a unit of work that the client wants to be per-formed: it consists of the input data, the MapReduce program, and configuration information. Hadoop runs the job by dividing it into tasks, of which there are two types: map tasks and reduce tasks.
There are two types of nodes that control the job execution process: a jobtracker and a number of tasktrackers. The jobtracker coordinates all the jobs run on the system by scheduling tasks to run on tasktrackers.
Tasktrackers run tasks and send progress reports to the jobtracker, which keeps a record of the overall progress of each job. If a task fails, the jobtracker can reschedule it on a different tasktracker. Hadoop divides the input to a MapReduce job into fixed-size pieces called input splits, or just splits. Hadoop creates one map task for each split, which runs the user defined
Figure 2.6: Wordcount solved with MapReduce whole system view (source: www.yuyellowpages.net)
map function for each record in the split. Each split will map with HDFS blocks, which are by default 64MB in size.
1. Job Submission The WordCount code is packaged as a Jar and sumitted to the cluster. The JobTacker is now in control, the user will wait for completion (success or failure with a report of various counters). The jobtracker assigns a new job ID and computes the input splits for the job. The jobtracker needs to know what data the task needs and where it is located on the cluster. Resources needed for the job like the job Jar file, libraries and config files are copied over to all the nodes that will perform work on the job.
2. Job Initialization The job is now added to a queue and will be scheduled by a job scheduler. This is where the job tasks will be computed. Computing the map operations
Figure 2.7: Hadoop Job Architecture
is just a matter of counting the splits, one map per split. The number of reduce tasks is simply a property of the job, and a good rule of thumb is about one reduce per node. Tasks are assigned IDs.
3. Task assignment JobTracker assigns tasks to taskTrackers. It checks up on their progress by polling them in a process called a “heartbeat” method. This checks if the tasktracker is alive and making progress on the task. This allows the jobTracker to know if a task is failed or if a node goes down. In such a case, the task will be reassigned to another tasktracker. Tasks are assigned so that the taskTracker of the machine where the data split is located will be preferred. This is following the principle of moving computation to data. A single machine can have many map and reduce slots and may perform many tasks in separate threads. This depends on the cluster configuration and depends on the hardware running the cluster.
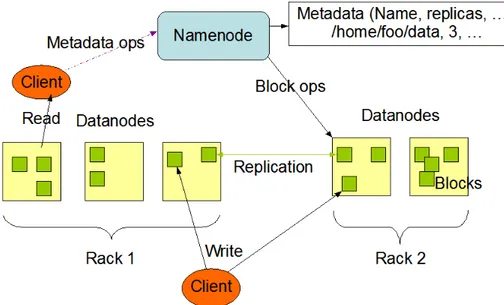
Figure 2.8: The HDFS Architecture (source: Apache Hadoop)
4. Task execution Each task is run in a separate JVM. Progress is communicated back to the tasktracker by a separate thread. These status updates can be displayed as a job status with an estimated completion rate. Map task estimate is based on the data processed and the data yet to be processed on the split, the reduce estimation is more difficult and so in practice is not really all that meaningful beyond knowing it’s running and is not done yet.
5. Job Completion Intermediate results for maps are stored on the local hard drive. The results of reduce tasks are stored on the distributed storage.
2.3.5
The Hadoop Distributed File System (HDFS)
The Hadoop Distributed File System (HDFS)14is a distributed file system designed to run on commodity hardware. HDFS is optimized for applications that have large data sets and is an implementation of the ideas and techniques described in the Google File System (GFS) paper Ghemawat et al. [2003]. HDFS is very robust through replication and is designed to run on low-cost hardware, scaling horizontally. It exposes a single, POSIX-style file system to users. How is it possible to build a highly fault-tolerant file system using hardware with compara-tively bad reliability? The trick is to factor in hardware failure in the design from the very start.
14