HAL Id: hal-02395677
https://hal.telecom-paris.fr/hal-02395677
Submitted on 5 Dec 2019
HAL is a multi-disciplinary open access
archive for the deposit and dissemination of
sci-entific research documents, whether they are
pub-lished or not. The documents may come from
teaching and research institutions in France or
abroad, or from public or private research centers.
L’archive ouverte pluridisciplinaire HAL, est
destinée au dépôt et à la diffusion de documents
scientifiques de niveau recherche, publiés ou non,
émanant des établissements d’enseignement et de
recherche français ou étrangers, des laboratoires
publics ou privés.
Feature selection for an improved Parkinson’s disease
identification based on handwriting
Catherine Taleb, Laurence Likforman-Sulem, Maha Khachab, Chafic Mokbel
To cite this version:
Catherine Taleb, Laurence Likforman-Sulem, Maha Khachab, Chafic Mokbel. Feature selection for
an improved Parkinson’s disease identification based on handwriting. 2017 1st International
Work-shop on Arabic Script Analysis and Recognition (ASAR 2017), Apr 2017, Nancy, France. pp.52-56,
�10.1109/ASAR.2017.8067759�. �hal-02395677�
Feature Selection for an Improved Parkinson‟s
Disease Identification Based on Handwriting
Catherine Taleb (1)(2), Laurence Likforman-Sulem (2), Maha Khachab (1), Chafic Mokbel (1)
(1) University of Balamand, Balamand, El-Koura, Lebanon
(2) Institut Mines-Telecom/Telecom ParisTech & Université Paris-Saclay, Paris, France
Abstract- Parkinson’s disease (PD) is a neurological disorder associated with a progressive decline in motor skills, speech, and cognitive processes. Since the diagnosis of Parkinson’s disease is difficult, researchers have worked to develop a support tool based on algorithms to differentiate healthy controls from PD patients. Online handwriting analysis is one of the methods that can be used to diagnose PD. The aim of this study is to find a subset of handwriting features suitable for efficiently identifying subjects with PD. Data was taken from PDMultiMC database collected in Lebanon, and consisting of 16 medicated PD patients and 16 age matched controls. Seven handwriting tasks were collected such as copying patterns, copying words in Arabic, and writing full names. For each task kinematic and spatio-temporal, pressure, energy, entropy, and intrinsic features were extracted. Feature selection was done in two stages, the first stage selected a subset using statistical analysis, and the second step select the most relevant features of this subset, by a suboptimal approach. The selected features were fed to a support vector machine classifier with RBF kernel, whose aim is to identify the subjects suffering from PD. The accuracy of the classification of PD was as high as 96.875%, with sensitivity and specificity equal to 93.75 % and 100%. The results as well as the selected features suggest that handwriting can be a valuable marker as a diagnosis tool.
Keywords—PDMultiMC database, Parkinson’s disease (PD), SVM, radial basis function kernel (RBF kernel), handwriting.
I. INTRODUCTION
Parkinson‟s disease (PD) is a neurological disorder associated with a progressive decline in motor precision and sensorimotor integration stemming presumably from a disorder of the basal ganglia [3]. Parkinson‟s disease is associated with the breaking up or the dying of dopaminergic neurons [2]. About 70% of patients with PD manifest a tremor that is most prominent in hands and fingers along with stiffness in the muscles, slowness of movements and lack of coordination while performing routine activities [2]. The cause for the dopamine depletion is not yet totally elucidated; it could arise from genetic factors, internal or external toxins, and/or the generation of free radicals. Age has been determined to be an additional factor as well [2]. The characteristic symptoms of PD can be divided into motor and non-motor symptoms. Motor symptoms include tremor, slowness of movement, muscle rigidity, gait and posture disturbances, and speech and swallowing difficulties. Non-motor symptoms include disturbances in sleep, sensation, mood (depression, apathy, anxiety, obsessive-compulsive, psychotic), as well as autonomic and cognitive (memory, attention, abstract thinking, problem solving, language and visual-perceptual abilities) disturbances. Diagnosis of PD is difficult [2], and no blood test is yet available to confirm with certainty the neurological exam
performed by the physician. Neurological testing (MMSE [13], and UPDRS [12]) and brain scans are routinely used to determine the diagnosis [2] . These methods are, however, expensive and need a high level of professional expertise [2]. This difficulty in diagnosis has led researchers to develop decision support tools based on algorithms to differentiate healthy controls from individuals with (PD) [1]. Some studies have indicated that handwriting can be used to diagnose PD [5], especially by detecting micrographia. However analyzing micrographia only is not enough, since micrographia only occurs in 30% to 60% of PD cases [4]. This has also motivated several researchers to investigate kinematic aspects of movement including speed, acceleration or stroke duration. However, kinematic features did not assess tremor, randomness, and hidden irregularities [4]. In this study, we use advanced handwriting markers based on entropy, energy and intrinsic measures of handwriting in order to diagnose PD. To achieve this goal we make use of our Parkinson multimodal database called PDMultiMC which includes handwritings and speech samples, and eye movements recordings collected from Parkinson‟s disease patients in two phases (medication on, and medication off), and from control subjects. In this work we focus on handwriting analysis, thus we analyze the seven handwriting tasks recorded for each of the 32 subjects. The PDMultiMC handwriting database includes samples in Arabic, which makes this database the first database dedicated to PD recognition which includes Arabic-script writers. The paper is organized as follows. A description of the present dataset and the methods used for feature extraction are presented in section II and III respectively. Section IV and V provide feature selection method and classifier used. Finally, section VI and VII, present the numerical results obtained and the conclusions.
II. PDMultiMC DATABASE
The PDMultiMC Parkinson handwriting dataset consists of 32 subjects, 16 PD (12 male/4 female) and 16 controls (5 male/11 female). PD patients were selected from those attending an experienced neurologist at Saint George Hospital University of Balamand Medical Center (Beirut, Lebanon). The control group is comprised of healthy subjects matched for age, years of education, and hand dominance. PD patients were examined in their “on-state” (1 hour after taking their regular dose of dopaminergic
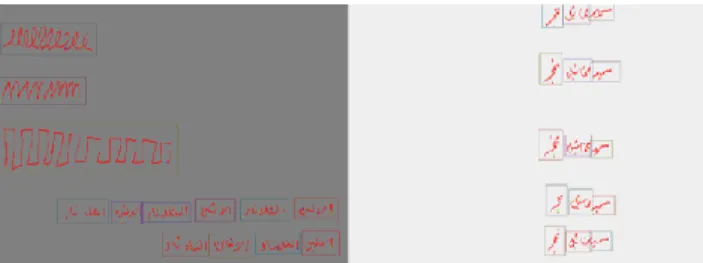
medication), and “off-state” (no dopaminergic medication). Age, gender, years of education, Unified Parkinson‟s Disease Rating Scale-PartI, II and III [12], mini mental state exam [13], daily Levodopa dose, H&Y stage of the disease [14], and disease duration are provided for each subject. In this study, we are working with PD in the medication “on- state” and healthy subjects (controls). Each subject was asked to complete seven handwriting tasks according to the prepared template. Handwriting signals were acquired using the digitizing tablet Wacom Intuos 5. Spatial displacement (x, y positions), pen pressure, time stamp, pen status and pen-tip angle (altitude, azimuth) measurements were collected from the tablet by using a dedicated application we implemented. The online data was saved for each subject. In addition, an offline image of the handwriting sample was saved in order to be used for the segmentation. A completed task sheet is shown in Figure 1. The handwriting template was composed of two parts: partI is the free writing, where subjects were asked to write their name and family name in their familiar language1 5 times
with their own speed and size each time on a different line. In the copying task, 3 different patterns with “Monday” and “Tuesday” words in 3 different languages are printed on the left of the sheet paper placed on the tablet. Subjects were asked to start copying the patterns and proceed from left to right until they completed 10 cycles, then copied the 2 days of the week 5 times consecutively with their familiar language. The seven tasks are described below:
Task 1:
Repetitive
-cursive letter (letterl
) Task 2: triangular waveTask 3: rectangular wave
Task 4: Repetitive “Monday” word; Task 5: Repetitive “Tuesday” word; Task 6: Repetitive subject‟s name; Task 7: Repetitive subject‟s last name;
The offline images were segmented into word and pattern in order to calculate different features related to words or patterns existing in the segment. The GEDI tool [20] was used for this purpose. The output data file of this tool is an XML file that contain the characteristics of each segment (position, width, height, and content), and subject‟s information. In order to get the online data for each segment, another application was written that returns the online data of each segment.
For tasks 4 to 7, features are extracted for each word segment separately and the mean of all the segments‟ features is calculated per task.
1
mostly in Arabic but also in French or in English, depending on the familiar language of each subject.
Figure 1. Handwriting samples (in red). Extracted segments are enclosed in blue boxes.
III. FEATURE EXTRACTION
Traditional measurement methods to process handwriting signals are used for feature extraction [10]. Features extracted can be either a single value or a sequence of values extracted through time [10]. In case there is a resulting sequence; 5 basic functional features are computed to represent it (mean, median, standard deviation, 1st percentile, and 99th percentile) [4]. Extracted features on handwriting are
separated into 5 groups: kinematic features, stroke features, pressure features, entropy and energy features, and intrinsic features [4]. A popular approach for PD detection from handwriting consists in extracting various kinematic features on strokes. A stroke is defined as a continuous line [10]. A stroke can be one of two types: „on-paper‟ stroke, or „in-air‟ stroke, which is a stroke that the pen creates when it does not touch the paper [10]. In this work only on-paper strokes were considered using the pen-status measurements [4]. Moving on to pressure features, the pressure of each stroke starts with rising edge, continues with slowly varying main part and ends with falling edge [4].The digital representation of handwriting as a based time series is the result of several interacting mechanisms like tremor, or irregular muscle contractions that introduce randomness to the movement during handwriting [6]. This randomness can‟t be analyzed by kinematic measures. That‟s why it‟s important to study also the entropy and the energy features [10]. In addition, the nonstationary signals have statistical properties that vary as a function of time and should be analyzed differently than stationary data [9]. We can decompose them into Intrinsic Mode Functions (IMFs) [10]. The reason for using only the first two IMFs is that in practice the first few IMFs contain only time-varying high spectral components representing the noise which is believed to reflect the presence of PD [9]. The noise in the signal seems to corresponds to tremor or jerk and therefore to identify the presence of the disease. List of computed features is provided in Table 1, where single value features are denoted as s and vector features are denoted as v. The intrinsic features are the same as the entropy and energy features but applied to the first and second IMFs of both horizontal and vertical positions. Entropy reflects the quantity of information existing in the signals. It is assumed that PD signals contains in addition to text information the information related to the disease which would permit to identify the PD. For Shannon entropy, P(X) is probability
density function computed using kernel density estimation with a Gaussian kernel [15], [23]. In order to calculate the signal to noise ratio an estimation of noise variance must be done. The noise variance Ɲ(𝑠[𝑛]) is estimated using Robust smoothing [8]. For task1, task2, and task3 the number of loops differ from subject to another. Entropy and intrinsic features depend on the amount of information existing in the data. In order to get more accurate features, each cursive repetitive task is divided into loops, and all the loops are overlaid together. Entropy and intrinsic features are calculated for the new xposition data.
IV. FEATURE SELECTION
The set of features obtained is large while the database includes limited number of samples which suggests an existing risk of falling in a curse of dimensionality. Feature selection is therefore used to reduce the dimensionality of the input data by removing the irrelevant features [6]. We propose two-stage feature selection approaches, one stage are based on statistical tests, and the other relies on a classifier.
Feature selection based on statistical tests
The first stage consists in a statistical analysis of the data that selects a small subset of features identified as necessary and sufficient to describe the target concept [6]. Before deciding which test should be used, a normality test, the Shapiro-Wilk test [16], [24] was applied on the whole database features in order to decide whether features were normally distributed [7]. For features that were normally distributed multiple independent t-test [16] were used for each feature separately, and for features that were not normally distributed, Mann-Whitney tests [18] were used. The objective of the statistical test is to determine if the sets of extracted features are significantly different for PD and healthy subjects. Features that passed the statistical test with a probability less than the significance level were kept [19]. In our study, various values between 0 and 1 of significance level were tried and the one with the best classification accuracy was picked. The application of feature selection method reduced the total number of features (for the seven tasks) from 1323 to 290 features. After extracting features for each task, the “all tasks” features are calculated by getting the mean of the features of all the seven tasks followed by a 2 stages feature selection technique. The first stage used statistical tests (t-test or Mann-Whitney test) as described before. The second stage of feature selection was applied to the selected features in the first stage. Most of the relevant features were selected by using a suboptimal approach as described in the following.
Feature selection based on SVM classifier
The set of selected features by statistical tests is still large. This set can be further reduced to a smaller subset of features that are necessary and sufficient to describe the target concept. A suboptimal incremental approach has been used for this purpose. Each feature resulting from the statistical
tests is used alone to classify a cross- validation set. The feature providing the highest classification performance is first selected. To this one, features are added incrementally to the selected features set by selecting, at every iteration, the one yielding the highest classification performance. The iterations stop when no more increase in performance is observed.
V. SUPPORT VECTOR MACHINE
In our study, the SVM classifier was used in order to classify the task samples into two classes (PD, healthy) [4] . A small introduction to SVM can be found in [4]. Before applying the SVM, feature scaling to the range [-1,+1] was done in order to avoid features in greater numeric ranges dominating those in smaller numeric ranges [11]. After that, we selected the RBF kernel model because the number of extracted features is not very large, which means mapping data to a higher dimensional space will improve the performance [11]. The SVM nonlinear mapping to higher dimensional space would improve the performance [11]. However, using RBF kernel showed satisfying performance. There are two parameters for RBF kernel: C and ɤ. In order to identify the best parameters, a grid search was applied on C and ɤ [11]. Exponentially growing sequences of C and ɤ were used. Various pairs of (C,ɤ) values were tried and the one with the best cross-validation accuracy was picked [11]. Due to the small data we worked on, we used the 4-fold cross validation that divide the dataset into 4 subsets of equal size (8 subjects per subset), and sequentially one subset was tested using the classifier trained on the remaining 3 subsets. The total accuracy is obtained by calculating the mean of all the folds accuracies.
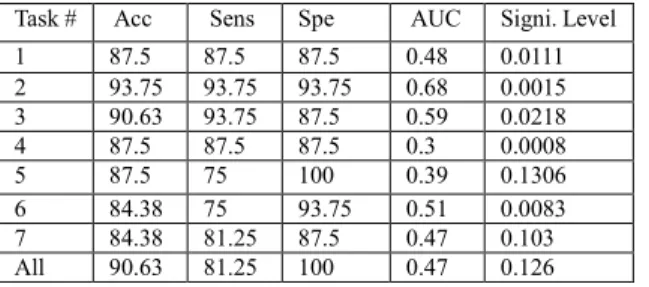
VI. NUMERICAL RESULTS AND DISCUSSIONS The prediction performance was evaluated in term of the accuracy, sensitivity, specificity, and area under curve (AUC) of receiving operator characteristic (ROC) defined in [6], [21], [25]. Prediction performance was considered for the seven handwriting tasks separately. The numerical results achieved by the SVM classifier with 4 folds cross-validation are provided in Table 2. The features were selected by applying the statistical test, the 90.63% accuracy for “all tasks” was achieved using 86 features. Every feature was used separately as an input to the SVM classifier in order to evaluate its classification accuracy as described in partIV. The results showed that the highest classification accuracy of a single feature is 87.5%. One possible approach to determine the most relevant features consists in a progressive increment in the size of the feature vector by adding, at each iteration, the feature that would maximally increase the performance of the system. This is a suboptimal approach that provides a kind of benchmark of the relevance of the features in the desired task. Starting from the feature with the highest classification accuracy, the classification accuracy is computed as the number of features is increased.
Table 1. Extracted Features Description
Feature Class Feature (s)/(v) Description
Kinematic and temporal features Horizontal and vertical velocity v Velocity in horizontal direction and velocity in vertical direction [6] Horizontal and vertical acceleration v Acceleration in horizontal direction and vertical direction [6] Horizontal and vertical jerk v Jerk in horizontal and vertical direction [6]
Velocity v Rate at which the position of a pen changes with time [6] Acceleration v Rate at which the velocity of a pen changes with time [6] Jerk v Rate at which the acceleration of a pen changes with time [6] Movement time(on surface) s Time spent on surface during writing [6]
Stroke Features Stroke speed v Trajectory during stroke divided by stroke duration [6] Stroke time v Stroke duration [6]
Stroke height v Is the difference between the maximum y position and the minimum y position in a stroke [6]
Stroke width v Is the difference between the maximum x position and the minimum x position in a stroke [6]
NCV v the number of changes in the velocity per stroke [6] NCA v the number of changes in the acceleration per stroke [6] Pressure features calculated for
each of the 3 parts of the pressure function ( rising edge, main part, falling edge)
NCP v number of changes in velocity pressure per stroke [4] Correlation coefficient between
pressure and horizontal velocity and acceleration
v Correlation between stroke pressure and stroke horizontal velocity and acceleration [4]
Correlation coefficient between pressure and vertical velocity and acceleration
v Correlation between stroke pressure and stroke vertical velocity and acceleration [4]
Entropy and energy features H(X) and H(Y) s Shannon entropy of x and y position [6]
HR,n(X) and HR,n(Y) s Renyi entropy second and third order of x and y position [6]
CE(X(n)) and CE(Y(n)) s Conventional energy of x and y position [6]
TKE1(X(n)) and TKE1(Y(n)) s First order Teager-Kaiser energy of x and y position [6]
SNRCE(X) and SNRCE(Y) s Signal to noise ratio calculated from the conventional energy [6] SNRTKE(X) and SNRTKE(Y) s Signal to noise ratio calculated from the teager-kaiser energy [6]
Table 2. Accuracy of PD classification
Task # Acc Sens Spe AUC Signi. Level 1 87.5 87.5 87.5 0.48 0.0111 2 93.75 93.75 93.75 0.68 0.0015 3 90.63 93.75 87.5 0.59 0.0218 4 87.5 87.5 87.5 0.3 0.0008 5 87.5 75 100 0.39 0.1306 6 84.38 75 93.75 0.51 0.0083 7 84.38 81.25 87.5 0.47 0.103 All 90.63 81.25 100 0.47 0.126
The results are presented in Figure 2. In order to get the results presented in Figure 2, first, the feature with the highest accuracy (total accuracy from 4-folds cross validation) separately was selected. Then features are added one by one incrementally till we get n=86 features. The highest classification accuracy was 96.875% for N=12 features. The results are presented in Table 3. It‟s clear that a smaller subset of features gave better classification accuracy. This indicates clearly that some of the features disturb the performance of the prediction system, mainly because of the curse of dimensionality, a critical factor in this particular case where a limited amount of training data is available.
Figure 2.Classification accuracy based on possible combination of features selected
Finally, the selected features providing the best performance are defined as the correlation between the pressure and the kinematic features. The features with the highest relevance come mainly from two tasks: task 2(triangular wave) and task 3 (rectangular wave). These two tasks are considered long and somehow complex. Copying these cursive tasks probably requires higher cognitive effort and reveals the effect of disease on handwriting. 0 10 20 30 40 50 60 70 80 90 80 82 84 86 88 90 92 94 96 98
Number of features included in SVM classifier
A
cc
ur
ac
Table 3. Table of Comparison
Performance 1 stage Feature
selection 2 stages Feature selection Accuracy (%) 90.625 96.875 Sensitivity (%) 81.25 93.75 Specificity (%) 100 100 AUC 0.4727 0.5938 VII. CONCLUSION
Seven different handwriting tasks were used for Parkinson‟s disease identification using a database collected from Arabic-script writers. Kinematic, stroke, pressure, entropy, and intrinsic features were extracted from each of the seven handwriting tasks. The results showed that handwriting can be a tool for PD diagnosis with a 97% prediction performance when a combination of features related to the correlation between kinematic and pressure is used. From a clinical point of view, the acceleration and stroke size are regulated by the motor control mechanism of the wrist and finger movement, a mechanism that is inaccurate or absent in PD [22]. In addition, the pressure features can provide additional information that is not captured in kinematic features [22] ,hence the importance to demonstrate the correlation between kinematic and pressure features [22]. However, many factors that influence handwriting exist and can affect classification decision. In this work, patients with PD performed the handwriting tasks under medication. Medication can have side effects upon the movements of patients which can then influence the classification process. Further studies on patients without medication should be performed to confirm the conclusions drawn in this study.
ACKNOWLEDGMENT
This study has been approved by the institutional review board (IRB) of the University of Balamand and Saint George Hospital University Medical Center.
REFERENCES
[1] A. Tsanas, M. A. Little, P. E. McSharry, J. Spielman, and L. O. Ramig, "Novel speech signal processing Algorithms for high-accuracy classification of Parkinson‟s disease," IEEE Transactions on Biomedical Engineering, vol. 59, no. 5, pp. 1264–1271, May 2012.
[2] R. K. Sharma and A. K. Gupta, "Voice analysis for Telediagnosis of Parkinson disease using artificial neural networks and support vector machines," International Journal of Intelligent Systems and Applications, vol. 7, no. 6, pp. 41–47, May 2015.
[3] J. R. Williamson et al., "Segment-dependent dynamics in predicting Parkinson‟s disease," ResearchGate, 2015.
[4] P. Drotar, J. Mekyska, Z. Smekal, I. Rektorova, L. Masarova, and M. Faundez-Zanuy, “Contribution of different handwriting modalities to differential diagnosis of Parkinson's Disease,” 2015 IEEE International
Symposium on Medical Measurements and Applications (MeMeA) Proceedings, 2015.
[5] A. A. Spadoto, R. C. Guido, F. L. Carnevali, A. F. Pagnin, A. X. Falcao, and J. P. Papa, “Improving Parkinson's disease identification through evolutionary-based feature selection,” 2011 Annual International
Conference of the IEEE Engineering in Medicine and Biology Society, 2011.
[6] P. Drotar, J. Mekyska, I. Rektorova, L. Masarova, Z. Smekal, and M. Faundez-Zanuy, "Decision support framework for Parkinson‟s disease based on novel handwriting markers," IEEE Transactions on Neural Systems and
Rehabilitation Engineering, pp. 1–1, 2015.
[7] E. J. Smits et al., "Standardized handwriting to assess Bradykinesia, Micrographia and tremor in Parkinson‟s disease," PLoS ONE, vol. 9, no. 5, p. e97614, May 2014.
[8] D. Garcia, "Robust smoothing of gridded data in one and higher dimensions with missing values," Computational Statistics & Data Analysis, vol. 54, no. 4, pp. 1167–1178, Apr. 2010
[9] D. N. Kaslovsky and F. G. Meyer, “Noise Corruption Of Empirical Mode Decomposition And Its Effect On Instantaneous Frequency,” Advances in
Adaptive Data Analysis, vol. 02, no. 03, pp. 373–396, 2010.
[10] P. Drotar, J. Mekyska, I. Rektorova, L. Masarova, Z. Smekal, and M. Faundez-Zanuy, “A new modality for quantitative evaluation of Parkinson's disease: In-air movement,” 13th IEEE International Conference on
BioInformatics and BioEngineering, 2013.
[11] C.-W. Hsu, C.-C. Chang, and C.-J. Lin, “A Practical Guide to Support Vector Classification”, National Taiwan University, 2003.
[12] S. Fahn et al., “ Unified Parkinson‟s disease rating scale “, 2006. [Online]. Available: http://img.medscape.com/fullsize/701/816/58977_UPDRS.pdf. [Accessed: 14-Dec-2016].
[13] L. Kurlowicz, and M. Wallace, “the mini mental state examination (MMSE)”, 1999 . [Online]. Available:http://geriatricsrotation.uchicago.edu/PGY1/documents/MMSE.p df. [Accessed: 14-Dec-2016].
[14] R. Bhidayasiri and D. Tarsy, "Parkinson‟S Disease: Hoehn And Yahr Scale". Movement Disorders: A Video Atlas. New York: Springer, 2012. pp. 4-5.
[15] P. Breheny, “kernel density estimation”, University of Kentucky,2012. [16] S. S. Shapiro and R. S. Francia, “An Approximate Analysis of Variance Test
for Normality,” Journal of the American Statistical Association, vol. 67, no. 337, pp. 215–216, 1972.
[17] W. Trochim, “The T-Test.” 2006. [Online]. Available: http://socialresearchmethods.net/kb/stat_t.php. [Accessed: 14-Dec-2016]. [18] R. Shier, “Statistics: 2.3 The Mann-Whitney U Test,” 2004. [Online].
Available:http://www.statstutor.ac.uk/resources/uploaded/mannwhitney.pdf.[ Accessed: 14-Dec-2016].
[19] M. Paret, “Alphas, P-Values, and Confidence Intervals, Oh My! | Minitab,”
Minitab, Jan-1970. [Online]. Available:
http://blog.minitab.com/blog/michelle-paret/alphas-p-values-confidence-intervals-oh-my. [Accessed: 14-Dec-2016].
[20] D. Doermann, E. Zotkina, and H. Li, "GEDI–A Groundtruthing environment for document images," ResearchGate, 2010.
[21] A. Rakotomamonjy, “Support Vector Machines and Area Under ROC curve”, 2004. [Online]. Available: http://citeseerx.ist.psu.edu/viewdoc/download?doi=10.1.1.78.2010&rep=rep 1&type=pdf. [Accessed: 14-Dec-2016].
[22] Drotár, P., Mekyska, J., Rektorová, I., Masarová, L., Smékal, Z., & Faundez-Zanuy, M. (2016). Evaluation of handwriting kinematics and pressure for differential diagnosis of Parkinson‟s disease. Artificial
Intelligence in Medicine, 67, 39–46. doi:10.1016/j.artmed.2016.01.004
[23] “Kernel density estimation”. [Online]. Available: http://lo.ferrara.free.fr/KernelHansen.pdf. [Accessed: 14-Dec-2016]. [24] “The shapiro-wilk and related tests for normality”, 2015. [Online].
Available: https://math.mit.edu/~rmd/465/shapiro.pdf. [Accessed: 14-Dec-2016].