HAL Id: hal-00947178
https://hal.inria.fr/hal-00947178
Submitted on 14 Feb 2014
HAL is a multi-disciplinary open access
archive for the deposit and dissemination of
sci-entific research documents, whether they are
pub-lished or not. The documents may come from
teaching and research institutions in France or
abroad, or from public or private research centers.
L’archive ouverte pluridisciplinaire HAL, est
destinée au dépôt et à la diffusion de documents
scientifiques de niveau recherche, publiés ou non,
émanant des établissements d’enseignement et de
recherche français ou étrangers, des laboratoires
publics ou privés.
A Unified Approach To Collaborative Data Visualization
Afshin Moin
To cite this version:
Afshin Moin. A Unified Approach To Collaborative Data Visualization. [Research Report] 2014, pp.7.
�hal-00947178�
A Unified Approach To Collaborative Data Visualization
∗Afshin Moin
INRIA Nancy Grand Est, France [email protected]
Much efforts have lately been concentrated on increasing the pre-cision of recommendations following the Netflix Prize competition. Recently, many researchers and industries have noted that other fac-tors like adequate presentation of the results can add more utility to a recommender system than slight improvement in the precision. In this paper, we suggest a methodology for user-friendly representa-tion of recommendarepresenta-tions to the end users. Our scheme unifies the two objectives of prediction and visualization in the core of a unique approach. Users and items are first embedded into a high dimen-sional latent feature space according to a predictor function, partic-ularly designated to meet visualization requirements. The data is then projected into a 2-dimensional space by Curvilinear Compo-nent Analysis (CCA). CCA draws personalized Item Maps (PIMs) representing a small subset of items to the active user. The intra-item semantic correlations are preserved in PIMs which is inherited from the clustering property of the high-dimensional embedding space. Our prediction function and the projection method are both non-linear to increase the clarity of the maps and to limit the effect of projection error. The algorithms are tested on three versions of the MovieLens dataset and the Netflix dataset to show they com-bine good accuracy with satisfactory visual properties. Moreover, a novel offline methodology is suggested to measure the quality of PIMs.
1 INTRODUCTION
Collaborative Filtering (CF) [24, 17, 25, 9] is the prevalent ap-proach to Recommender Systems (RS). It extracts relevant items by tracing the similarities between the past behavior of users. Fol-lowing the Netflix Prize competition [2], most works on CF concen-trated on improving the prediction precision [22, 25, 26]. Neverthe-less, precision is not the only determining factor for the success of RSs. It is also important that results are represented as informa-tive as possible because their careless presentation wastes efforts made to enhance precision. Most often, recommendations are pre-sented in the form of a ranked list. Users have multiple interests, and are likely to change their preferences over time [28, 22, 21]. In the same way, one user account may delegate several persons, each having different taste and needs. Though, ranked lists do not unveil the correlation between items unless the user knows them a priori. This issue limits the benefit of recommender systems as it prevents the users from making a correct selection based on their current needs.
In this paper, we suggest a Matrix Factorization-like (MF) rec-ommendation algorithm combined with a non-linear projection technique arranging the results of CF in the form of 2-dimensional maps. This latter is a better alternative to ranked lists as it ar-ranges items based on their similarity. Of course, other solutions like showing the content information of items may also be consid-ered. However, it requires expensive gathering and involved clean-ing tasks which companies try to avoid. In addition, interpreta-∗For all references to this report, please cite the conference version in
SAC2014.
tion of a visual map is more convenient and quite intuitive. MF RSs [10, 1] embed users and items in a latent feature space. Miss-ing ratMiss-ings are then estimated through the inner product of user and item coordinates. MF has been noted on passing to have the prop-erty of putting similar items close to each other in the latent fea-ture space [23]. Nevertheless, there are two barriers against their application to draw 2-dimensional maps. First of all, the existing predictor functions are not apt for visualization purposes. Namely, users link intuitively the relevance between users and items to their Euclidean distance on the map. However, the existing predictors, generally variants of the inner product of vectors, need other infor-mation (e.x. the angle between user and item coordinates vector). Secondly, MF approaches need more than 2 dimensions to reach their optimal precision. Consequently, proper projection methods must be picked up preserving as much information as possible.
Our approach is composed of two phases: the embedding phase and the projection phase. The first phase embeds users and items into a high dimensional space based on a predictor aimed at meeting visualization requirements. This predictor is a decreasing function of the Euclidean distance between the corresponding user and item. In the second phase, data is projected from the high dimensional space into a 2-dimensional map. Our design goal is to make special emphasis on the interpretability of results for the end user such that interesting items are easily distinguishable from uninteresting ones. Moreover, the quality of the maps must be as prone as possible to the inevitable projection error. To achieve these goals, we rely on a non-linear prediction function for the embedding phase; Non-relevant items get further from users with a rate larger than linear. This improves the separation of relevant items from irrelevant ones. Furthermore, they are less probable to appear close to the user as a result of projection error during the projection phase .
Our projection method relies on the assumption that far away items are less probable to be compared. Hence when necessary, preservation of close distances must be preferred over preservation of long ones. Such projection can not be done using classic lin-ear projection methods like MDS. We use Curvilinlin-ear Component Analysis (CCA) as our projection technique. Preferring the con-servation of short distances to long ones, not only does this non-linear projection method covers the effects of the projection from the eye of the user, but also lends itself well to our non-linear predic-tion funcpredic-tion that places irrelevant items much further than relevant ones. The original CCA approach is altered to give more weight to preservation of distances w.r.t the active user. We call the resulting map personalized Item Maps (PIMs). All PIMs are presented with the same visual parameters such that comparison between PIMs of different users is meaningful. PIMs represent a number of items to a specific user. They are helpful in applications like visual recom-mendation or in scenarios where users need a visual comparison of a number of items. In a PIM, items are placed around the active user such that their relevance decreases with their distance from her.
The prediction precision of our approach is validated by running experiments on the three versions of the MovieLens dataset and the Netflix dataset. The quality of the resulting map is evaluated using a novel offline methodology which is another contribution of this paper. This method measures the inconsistency of PIMs, that is, the cases when an item with a lower predicted score lies closer to the user than a more relevant item.
2 RELATEDWORKS
Two common approaches to CF are neighborhood-based meth-ods [24, 17, 25, 9] and Matrix Factorization (MF) [18, 22, 27, 20]. The latter, being less complex and more exact, leverages the whole ratings to embed users and items in a latent feature space. We con-centrate on this method and suggest a variant creating an embedding suitable for visual representation of CF data.
Visualization of high dimensional datasets has an important role in their understanding. Many information visualization solutions have been suggested to this problem. A very common approach is to model the information as a graph such that nodes represent data points and edges represent relations between them. Classic graph drawing algorithms like Spring Embedder [11] and Spring electrical model [12], or more recent methods like Maxent stress model [14] and FlexGD [19], can consequently be used for their visualization. In the same line of work, [13] suggest a method for visualizing graphs and clusters in the form of a geographical map. Interpretation of such maps is easy and intuitive for the users.
Graph drawing has also been applied to the context of collab-orative filtering in [29]. The data is modeled as a bipartite graph with vertices representing users and items and edges representing the interactions. Graph drawing algorithms are aimed at generation of readable graph layouts based on a number of predetermined aes-thetic criteria. Therefore, the resulting visualizations are readable and pleasing. However, the same criteria prevent them from hav-ing enough predictive capability, a property which is central in this paper. In particular, they offer no prediction function according to which a quantitative item score can be estimated for a user.
Some other works like [6, 4] suggest other visualization strate-gies for CF which are radically different from visualization on a map. In [6], the NEAR panel is suggested to manage digital col-lections. A graphical user interface is designed in the form of a hierarchical browser. This interface shows the latent similarities between items to the end user in a visual manner. [4] is a visual interactive recommender system which is also context aware.
In the context of neighborhood-based CF, classical Multi Di-mensional Scaling (MDS) [7, 3] is directly applicable. Namely, a symmetric matrix of item-item dissimilarities is computed. A user-specific list of top-k relevant items is then visualized through MDS. This method has the drawback of not mapping a user together with her recommended items, as similarity is only defined between items or users but not between a user and an item. Furthermore, these item-item dissimilarities are computed based on measures like co-sine or Pearson correlation. These measure are local and do not leverage the whole dataset as our approach does. In other words, MF and neighborhood-based approach reveal different types of cor-relation within data (global vs. local). Our experiments shows that there is almost no correlation between cosine and Pearson similarity of items and their relative position in an MF map.
[5] presents Latent Markov Embedding (LME) to generate vi-sual music playlists for users. This machine learning algorithm models the problem of playlist generation as a regularized max-imum likelihood embedding of Markov chains in the Euclidean space. Their approach is similar to language modeling techniques for speech recognition and modeling. It lends itself well to se-quence prediction problems. However, its application to non-binary rating estimation is not straightforward.
The advantages of collaborative filtering via Euclidean Embed-ding is also discussed in [20]. Their prediction function includes an item-dependent feature. Hence, the distance between a user and an item is not the only determining factor for computation of rec-ommendations. Consequently, it happens occasionally that items with higher predictions lie further from a user because of having a smaller item-dependent feature. The projection applied in [20] is MDS.
Our work is original in applying a non-linear prediction function
u
p qi
j
q
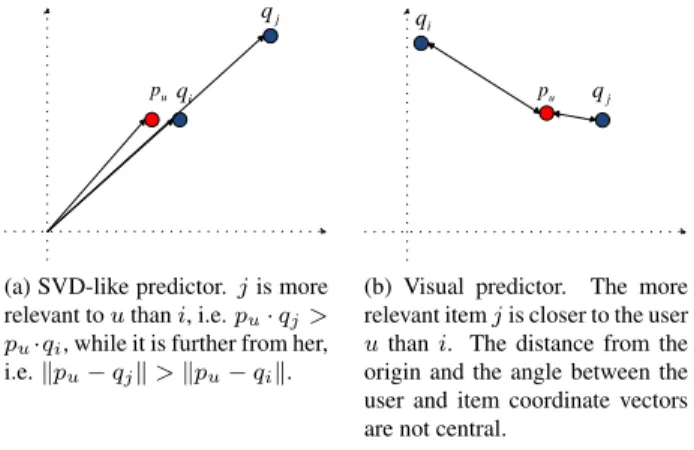
(a) SVD-like predictor. j is more relevant to u than i, i.e. pu· qj>
pu·qi, while it is further from her,
i.e. kpu− qjk > kpu− qik. j q i q u p
(b) Visual predictor. The more relevant item j is closer to the user u than i. The distance from the origin and the angle between the user and item coordinate vectors are not central.
Figure 1: The comparison between the suitability of the inner product and the Euclidean distance for visual prediction.
allowing for easier separation of relevant and non-relevant items, whose results are consequently passed to a proper non-linear pro-jection method, i.e. CCA. This propro-jection method improves the quality of the resulting maps and decreases the influential visual er-rors. In particular, we will see in the experiments that the quality of maps generated by CCA outperforms considerably the quality of those issued by MDS. As far as we know, such a combination of non-linear embedding and projection techniques have not been used in CF so far. Meanwhile, our validation methodology is a novel way for quantitative measuring of the quality of the recom-mendation maps.
3 MATRIXFACTORIZATION FOR VISUALPREDICTION
Singular Value Decomposition (SVD) [15] is the most common MF approach to CF. SVD is computable if all matrix entries are known. In CF however, the majority of ratings are missing. A common al-ternative, known as the SVD-like approach, is to estimate the latent features through minimizing a regularized cost function:
min X
p∗,q∗,r∗∈R
(rui− pu· qi)2+ λ(kpuk2+ kqik2),
where pu= (xu(1), · · · , xu(k)) and qi= (yi(1), · · · , yi(k)) are the latent features of user u and item i in an embedding space of k dimensions. The first term strives to minimize the prediction error over the observed ratings. Since the goal is to predict future ratings, the second terms is added to avoid overfitting the observed ratings. λ is called the regularization factor. This function is minimized using the stochastic gradient descent method. Users and items are moved iteratively by a step length γ in the opposite direction of the gradient until the change of user and item coordinates is negligible. At each iteration, coordinates are updated as:
(
pu← pu+ γ(euipu− λqi) qi← qi+ γ(euiqi− λpu)
,
where eui = ˆrui− ruiis the prediction error of item i for user u. λ and γ are optimized by cross validation on a smaller subset of the ratings. This approach is very similar in the spirit to MF ap-proaches, as it embeds users and items in a low dimensional feature space. Despite, since it is not formulated in the form of a classic SVD, we refer to it as an SVD-like approach.
3.1 Basic Visual Predictor
The original SVD-like approach is not suitable for visualization purposes. The inner product function, used in the SVD-like ap-proach, is a function of the magnitude of the vectors and the angle between them. Consequently, it can place a less relevant item closer to a user than a more relevant one. This presentation is mislead-ing because users intuitively interpret closer items as more relevant. More specifically, the inner product between the coordinates vector of a user, say pu, and a far item, say qj, may be a larger value than the inner product of puand the coordinates vector of a nearby item, say qi. Such a problem does not arise, if the predictions are purely a function of the Euclidean distance, as the relevance between a user and an item is computed directly from their distance. Figure 1 illustrates why the inner product function does not conform with visualization requirements, while the visual predictor based on the Euclidean distance does.
Now, we come to the definition of the visual predictor. Let ˆrui= f (kpu− qik) be the predicted rating of user u for item i. We set an inverse relation between the distance of an item from a user and the respective predicted value. The objective estimation function is then: ˆ rui= 1 1 αkpu− qik + β . (1)
The cost function to minimize is: min X
p∗,q∗,r∗
(rui− ˆrui)2+ λ(kpuk2+ kqik2).
The minimization is done using stochastic gradient descent. Coor-dinates are updated at each iteration as:
( pu← pu− γ(eui4(qi− pu) + λpu) qi← qi− γ(eui4(pu− qi) + λqi) , 4 = rˆ 2 ui αkpu− qik .
α and β are found by cross validation.
3.2 Improved Visual Predictor
The precision of the visual predictor is worse than the SVD-like approach. To improve the results, we set α and β as user-specific variables. This helps modeling users’ behavior in finer levels, giv-ing users and items higher degrees of freedom to take position in the embedding space. The prediction function becomes:
ˆ rui= 1 1 αukpu− qik + βu . The regularized cost function is:
min X
p∗,q∗,r∗,α∗,β∗
(rui− ˆrui)2+ λ(kpuk2+ kqik2+ α2u+ β 2 u).
The coordinates are updated using the following equations: pu← pu− γ(eui4(qi− pu) + λpu) qi← qi− γ(eui4(pu− qi) + λqi) , 4 = rˆ 2 ui αukpu−qik. αu← αu+ γα(eui4/αu− λαu) βu← max{βu− γβ(euirˆ2ui+ λβu), βumin}
We observed during the experiments that the algorithm needs dif-ferent step lengths for α and β to achieve optimal performance. We set γα = 9γ and γβ = γ/29. We also observed that for a few users βubecomes negative. In order to prevent it, we set a min-imum value βumin > 0 for βu. This is a necessary condition for unification of the scale of PIMs in Section 4.
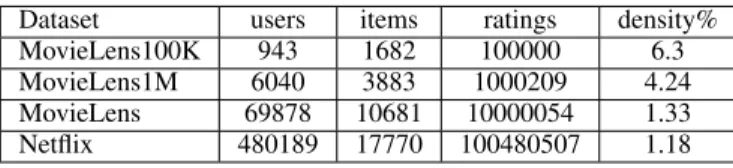
Dataset users items ratings density% MovieLens100K 943 1682 100000 6.3 MovieLens1M 6040 3883 1000209 4.24 MovieLens 69878 10681 10000054 1.33 Netflix 480189 17770 100480507 1.18
Table 1: Properties of the datasets
We compare different predictors on the MovieLens and Netflix datasets. These are standard datasets used in many reaseach works. Table 1 summarizes some properties of the datasets. MovieLens dataset is provided by GroupLens team in three versions [16]. Each user has rated at least 20 movies. The algorithm is trained on 95% of the data. Predictions are made on the remaining 5%. To form the training and test sets, we have split each user profile into 20 uniform regular slices. 19 slices are chosen as the training profile, while the remaining one serves as the test profile. This way, we as-sure there is at least one rating in each user’s test profile. The Net-flix data set was made public for the NetNet-flix Prize competition [2]. The dataset includes 100, 480, 507 ratings. 1, 480, 300 of the same ratings were provided as the probe set for test purposes. We trained our algorithm on all ratings, after having discarded those included in the probe set. The predictions are made on the probe set. Both MovieLens and Netflix are based on a 5-star rating scheme, that is, users rate movies between 1 and 5 stars. While the real ratings are integers, the predictions need not be. In our algorithm, pre-dicted ratings are real numbers. We compare the performance of different predictors using the Root Mean Square Error defined as RMSE =
r P
rui∈RT est(ˆrui−rui)2
|RT est| , where RT estis the set of
rat-ings in the test set. The parameters of all algorithms are well tuned to have a fare comparison. It is seen that the precision improves with the number of dimensions up to some threshold. After that, the error increments because the data is not enough to train extra dimensions. In other words, the larger the dataset, the more dimen-sions can be trained.
The results are summarized in Figure (2). For the small dataset of MovieLens100K, precision gets worse because the data is not enough to train the new variables. However, interestingly, it is almost as precise as the SVD-like approach for larger datasets. The difference in precision is always less than 0.01, being 0.0096, 0.0032 and 0.0057 for MovieLens1M, MovieLens and Netflix, re-spectively. This allows for visual representation of the results with-out considerable loss in precision.
4 PERSONALIZEDITEMMAP
Our final objective is to build Personalized Item Maps (PIMs). One possible solution is to take a desired set of items with a user and apply classical MDS. This approach has been used in [20]) for ex-ample. Though, no quantitative evaluation of the resulting maps is provided. It is a well-known fact that classical MDS is equivalent to PCA provided the data to be projected contains distances, which is the case in our application. PCA is a linear mapping preserving the distances as much as possible, but giving the same weight to all distances. We observed during simulations that only in a few cases does PCA show acceptable performance. For the majority of the users, it disturbs so much the original distances that they no more conform to the predicted ratings.
In order to increase the quality of PIMs to an acceptable level, compromises should be made in favor of preserving more impor-tant distances. We use Curvilinear Component Analysis (CCA) [8] being a non-linear mapping technique prioritizing preservation of shorter distances over longer ones. In other words, CCA gives pri-ority to the preservation of local topology. This property of CCA is also in line with the hyperbolic relation we set in Section 3
be-(a) MovieLens100K (b) MovieLens1M (c) MovieLens (d) Netflix Figure 2: RMSE of various approaches on different datasets.
tween the predicted ratings and the Euclidean distance, as such re-lation emphasizes further closeness of relevant items. CCA starts from projecting long distances, and overriding them by shorter ones whenever compromises must be made. We have slightly altered the original CCA approach to give more weight to the preservation of distances w.r.t. the active user. The user is the central entity for whom the map is prepared. Hence the conformance between the recommended item scores and their distance from the user is more important than preserving the distance between two items.
The customized cost function of CCA to be minimized is: E =1 2 X i X j6=i (Xij− Yij)2F (Yij, λy), where F (Yij, λy) = ( 1 if Yij≤ λy 0 if Yij> λy .
Xijand Yijare the distances in the original and the output space, respectively. i and j may refer either to an item or to the active user. We use the principal components as the initial distribution of the points. F (Yij, λy) is the step function discarding all distances larger than λy in the output space. λy is decreased per cycle in order to prioritize shorter distances in the output space over longer ones.
The cost function can be minimized using the usual stochastic gradient descent approach. However, the complexity of each itera-tion cycle would be as O(n2). To decrease the complexity, a differ-ent procedure was proposed in [8]. Instead of moving every point according to the influence of all other points, one random point is fixed. Other points are moved with respect to the fixed point, but without consideration of the mutual influence between them. This approach reduces the complexity of each cycle to O(n). The cost may occasionally increase in each cycle, but it decreases in aver-age. If F (Yij, λy) is the step function, the movement of each point j w.r.t the fixed point i is:
∆yj(i) = α(t)F (Yij, λy)(Xij− Yij) yj− yi
Yij
∀i 6= j. λyis decreased per cycle, starting with λ0and ending with λtmax:
λy(t) = λ0( λtmax
λ0
)t/tmax.
For each user we set λtmax = ¯du, where ¯du = αu(¯r1u − βu) is the target distance corresponding to the average rating of user u. An item is relevant if its distance from the active user is less than
¯
du. Setting λtmax = ¯duensures that items within some relevant
distance from the user on the output space are not discarded until
the end of the execution. In our experiments, we set λ0 = 2.0. The algorithm is run a number of cycles on the active user and the selected items, denoted by Qt. In order to give more weight to the preservation of the distances w.r.t the active user, whenever the fixed point is an item, the algorithm is run one extra time on the active user with probability 0.2. This strategy can also be validated from a game theoretical point of view. Namely, each point of the data moves the others in the goal of aligning their position in the output space with their original distances from it. Since the algorithm is run in average 0.2 |Qt| times more on the active user, compromises are made to her benefit.
Application of user specific parameters to the visual predictor leads to different interpretations of distance in PIMs. It would be nice that all PIMs are represented in the same scale such that users can compare their PIMs with each other. To unify the scale of PIMs, we first set the origin to the position of the active user (pu = 0), and reassign all the item coordinates in the translated coordinate system. We look for a transformation such that the predictions are made with the same α and β for all users:
ˆ rscaledui = 1 1 α qscaled i + β . Setting ˆrunscaled ui = ˆrscaledui , we obtain: q scaled i = α αu q unscaled i + α(βu− β).
Since the Euclidean distance is non-negative, kqscaledi k ≥ 0. This condition is satisfied for all users if β ≤ βumin. The above equation is then held if:
qiscaled= α αu qunscaledi + qunscaled i qunscaled i α(βu− β).
In our experiments we set α = 2.5 and β = βumin= 0.05. Figure 3 compares the PIM of an anonymous MovieLens user projected once from an improved visual predictor latent feature space and once more from an SVD-like latent feature space. We project from a 20-dimensional improved visual predictor latent fea-ture space and a 10-dimensional SVD-like latent feafea-ture space as 10 and 20 dimensions correspond to the best performance the respec-tive algorithm. Shown in the figures, are the movies in the user’s test profile together with a number of movies previously rated by her. Scores of the test items are predictions computed in the high dimensional feature space. Notice we would like the predicted rat-ing to be a decreasrat-ing function of the distance in the visual latent feature space. Then, the consistency between the predicted ratings and the distance of the user from the corresponding item on the vi-sual predictor PIM is a measure of how much the original distances
user unknown items
She’s the One
League of Their Own, A Friday Blues Brothers 2000 Birdcage, The St. Elmo’s Fire Sixteen Candles Willy Wonka 2.68 3.69 3.09 1.77 3.14 3.26 4.13 4.31 known items Clerks Milk Money
Desperately Seeking Susan Threesome
Muppet Christmas Carol, The Fantasia
Blind Date
American in Paris, An
(a) Improved visual predictor PIM projected from 20-dimensional latent feature space.
user unknown items
She’s the One
League of Their Own, A Friday
Blues Brothers 2000
Birdcage, The St. Elmo’s Fire
Sixteen Candles
Willy Wonka the Chocolate Factory 2.51 3.68 3.15 1.79 3.23 2.7 3.78 4.04 known items Clerks Milk Money
Desperately Seeking Susan
Threesome
Muppet Christmas Carol, The
Fantasia Blind Date
American in Paris, An
(b) SVD-like PIM projected from 10-dimensional latent feature space.
Figure 3: PIM of an anonymous MovieLens user.
User Movie 1 Movie 2 Movie 4 Movie 3
Figure 4: The area of visual importance for a typical user around Movie 1.
have been preserved. It is seen in the PIM generated from the vi-suallatent feature space (Figure 3a) that more relevant items are closer to the user than less relevant ones. The semantic correlation between items is preserved in a very good level. The movies Friday and Clerks on the top of the map are both comedies. In the same way, St. Elmo’s Fire and ThreeSome are movies for teenagers with a background of romance and comedy. An American in Paris and Willy Wonka & the Chocolate Factoryare both musicals. This map can help the user choose a movie similar to one of her previous fa-vorites based on her mood in the time of selection. In contrast to the PIM of the improved visual predictor, it is seen in Figure 3b that the PIM projected from the SVD-like latent feature space does not place more relevant items closer to the user in general. PIMs are also useful in offering diverse recommendations to a user. Di-verse recommendations entice users to go through new experiences in their consuming behavior. If the user views a cluster of recom-mended items on her PIM, none of which is known to her, she is encouraged to try them.
One way to validate PIMs is through user studies. This method would need a number of users to test different methods of presen-tation and report on their quality. However, arranging such sur-veys for a large group of users is not straightforward unless for large industries. As a result, we suggest a novel offline validation
methodology for evaluation of the quality of PIMs. Our method is based on a set of assumptions about the behavior users are likely to show when they encounter a map of products. We assume they are more likely to complain about the inconsistency between the rec-ommended scores of two items and their distance from the active user provided that (1) those items are close on the map, (2) they are about the same radial line from the user. If none of these is true, we ignore the inconsistency between the recommendations and the distances, as such items are less likely to be compared. Namely, they are in very different regions of the map; It is therefore less nat-ural for the users to compare them. In addition, they are deemed to be different types of product due to the clustering property of the embedding space. With these assumptions in mind, we define a region around each item where the items within are more likely to be compared. This region is the union of a circular area around the item and a conical area whose apex is on the user and who contains the item. We call this area Au(i) for the PIM of user u. Figure 4 shows Au(1) for a typical user and Movie 1 in her map. In our simulations, the radius of the circle is set to 0.2 times the length of the drawing area and the internal angle of the cone is 30 degrees.
For two items, say i and j which are in the area of importance of each other, there exists an inconsistency in the map if kqi− puk > kqj− puk, but ˆrui> ˆrui, or vice versa. We measure the quality of a PIM for user u with the number of inconsistencies and the mean value of error per inconsistency, defined as:
M Eu= 1 |E| X i∈P IM (u) X j∈Au(i) kqi− puk kqj− puk ˆ rui ˆ ruj ,
where |E| is the number of inconsistencies in the map and M E stands for Mean Error.
We compare the quality of maps generated with 5 methods
com-EucEmbed Euclidean embedding in [20]
SVD-PCA SVD-like approach, projection with PCA Vis-PCA suggested visual predictor, projection with PCA SVD-CCA SVD-like approach, projection with CCA Vis-CCA suggested visual predictor, projection with CCA
Table 2: Recommendation methods for generation of visual recom-mendation maps.
# of errors / user mean error EucEmbed 6.9219 1.9875 SVD-PCA 7.4881 2.0239 Vis-PCA 7.5500 2.1554 SVD-CCA 7.0276 1.7050 Vis-CCA 5.8013 1.5670
Table 3: The quality of PIMs of different recommendation maps.
bining MF approaches with different projection techniques. Ta-ble 2 summarizes these methods. The prediction function suggested in [20] is ˆrui= µ + bu+ bi− kpu− qik2, where µ is the average rating of the dataset and buand biare user and item dependant vari-ables respectively. The latter is indeed what leaves the door open for less relevant items to lie closer to a user than more relevant ones. We report the results on the Movielens 10 million ratings dataset. The results for other datasets were similar. The map of each user contains the 5% of her total ratings corresponding to her test profile together with another 5% of known items shown to the user for the means of comparison (see Figure 3). Table 3 shows the results of the experiments for 10000 Movielens user maps. It is seen that the suggested visual predictor method has the fewest number of incon-sistencies per user and the smallest mean error per inconsistency compared to other methods. The reason behind this quality is the special shape of our predictor function which is optimally coupled with the compromising property of CCA in preserving more impor-tant (short) distances. Furthermore, CCA always outperforms PCA in terms of average number of errors per user and mean error.
5 CONCLUSION
We studied visual representation of CF data. Our approach estab-lishes an inverse relation between the relevance of data points and their distance in the Euclidean space. The projection method pre-serves the short distances and violates longer ones if tradeoff is inevitable. This results in a decrease in the number of those in-consistencies which are more likely to confuse the users. In this paper, we also presented an evaluation method for measuring the quality of recommendation maps. Our approach has fewer incon-sistencies and smaller error compared to the maps generated using classical SVD-like approach. Usually, visualization techniques are likely to sacrifice precision for readability. This work presents a unified approach capitalizing on high precision of the MF approach with user-friendly representation of the results. Relating the cor-relation of data points to their distance in a high dimensional Eu-clidean space, our methodology provides a framework for using the existing projection techniques in the context of CF. Experiments on the three versions of the MovieLens dataset and the Netflix dataset show that the visual predictor has almost the same precision as the inner product predictor. The beauty of this approach is its capability in revealing latent information which are hard to understand even if one is disposed of the content information. Indeed, presented maps are the result of the collective wisdom of a huge number of users, sometimes being more promising than sniffing into tones of expert generated information. Our approach is also a solution to alleviate the explainability issues of MF. It is important for a recommender system to be able to explain the reason behind its recommenda-tions. The neighborhood-based approach has the advantage of good explainability as it recommends based on the items/users already known to the active user. On the contrary, explaining the results of MF approach is more challenging, although this latter outper-forms its neighborhood-based counterpart. The clustering property of visual maps and their distance interpretability are helpful in pro-viding explanations and gaining the users’ confidence. The running time of the MF approach is about half an hour on the Netflix dataset. Fortunately, the algorithm is run offline. It is recomputed with some
frequency (for example daily or weekly). On the contrary, running times of the projection algorithm is very short. Consequently, it can be run on demand.
6 ACKNOWLEDEGMENTS
This work is supported partially by the ERC Starting Grant GOSS-PLE number 204742. It was started and partly conducted at INRIA Rennes Bretagne Atlantique where the author was a Ph.D. student. I am grateful to Prof. Anne-Marie Kermarrec and Dr. Claudia Ignat for all the support they devoted to this work.
REFERENCES
[1] R. Bell, Y. Koren, and C. Volinsky. Modeling relationships at mul-tiple scales to improve accuracy of large recommender systems. In SIGKDD, pages 95–104, 2007.
[2] J. Bennett and S. Lanning. The netflix prize. In KDD Cup and Work-shop, 2007.
[3] I. Borg and P. J. F. Groenen. Modern Multidimensional Scaling: The-ory and Applications (Springer Series in Statistics). Springer, 2005. [4] S. Bostandjiev, J. O’Donovan, and T. H¨ollerer. Tasteweights: a
vi-sual interactive hybrid recommender system. In ACM conference on Recommender systems, pages 35–42, 2012.
[5] S. Chen, J. L. Moore, D. Turnbull, and T. Joachims. Playlist prediction via metric embedding. In SIGKDD, pages 714–722, 2012.
[6] V. Chen, C. Qian, and R. Woodbury. Visualizing collaborative filtering in digital collections. In Information Visualization (IV), pages 203 – 210, 2007.
[7] T. F. Cox and M. Cox. Multidimensional Scaling, Second Edition. Chapman and Hall/CRC, 2000.
[8] P. Demartines and J. Herault. Curvilinear component analysis: a self-organizing neural network for nonlinear mapping of data sets. Neural Networks, IEEE Transactions on, pages 148 –154, 1997.
[9] M. Deshpande and G. Karypis. Item based top-n recommendation algorithms. ACM Transactions on Information Systems, pages 143– 177, 2004.
[10] P. Drineas, I. Kerenidis, and P. Raghavan. Competitive recommen-dation systems. In ACM symposium on Theory of computing, pages 82–90, 2002.
[11] P. Eades. A heuristic for graph drawing. In Congressus Numerantium, pages 149–160, 1984.
[12] T. M. Fruchterman and E. M. Reingold. Graph drawing by force-directed placement. In Software-Practice and Experience, pages 1129–1164, 1991.
[13] E. Gansner, Y. Hu, S. Kobourov, and C. Volinsky. Putting recom-mendations on the map: visualizing clusters and relations. In ACM conference on Recommender systems, pages 345–348, 2009. [14] E. R. Gansner, Y. Hu, and S. North. A maxent-stress model for graph
layout. IEEE Transactions on Visualization and Computer Graphics, pages 927–940, 2013.
[15] G. H. Golub and C. F. Van Loan. Matrix computations (3rd ed.). Johns Hopkins University Press, 1996.
[16] U. o. M. GroupLens. MovieLens Datasets, 2010. http://www. grouplens.org/node/73#attachments.
[17] J. L. Herlocker, J. A. Konstan, A. Borchers, and J. Riedl. An algorith-mic framework for performing collaborative filtering. In ACM SIGIR, pages 230–237, 1999.
[18] T. Hofmann. Latent semantic models for collaborative filtering. ACM Trans. Inf. Syst., 22(1):89–115, 2004.
[19] A.-M. Kermarrec and A. Moin. Flexgd: A flexible force-directed model for graph drawing. In Visualization Symposium (PacificVis), 2013 IEEE Pacific, pages 217–224, 2013.
[20] M. Khoshneshin and W. N. Street. Collaborative filtering via eu-clidean embedding. In ACM conference on Recommender systems, 2010.
[21] J. Z. Kolter and M. A. Maloof. Dynamic weighted majority: An en-semble method for drifting concepts. J. Mach. Learn. Res., pages 2755–2790, 2007.
[22] Y. Koren. Collaborative filtering with temporal dynamics. In Proc. of the 15th ACM SIGKDD, pages 447–456, 2009.
[23] Y. Koren, R. Bell, and C. Volinsky. Matrix factorization techniques for recommender systems. Computer, pages 30–37, 2009.
[24] G. Linden, B. Smith, and J. York. Amazon.com recommendations: item-to-item collaborative filtering. In Internet Computing, IEEE, pages 76–80, 2003.
[25] R. M. Bell and Y. Koren. Scalable collaborative filtering with jointly derived neighborhood interpolation weights. In IEEE International Conference on Data Mining, pages 43–52, 2007.
[26] R. Salakhutdinov and A. Mnih. Probabilistic matrix factorization. In Advances in Neural Information Processing Systems, 2007. [27] R. Salakhutdinov, A. Mnih, and G. Hinton. Restricted boltzmann
ma-chines for collaborative filtering. In international conference on Ma-chine learning, pages 791–798, 2007.
[28] G. Widmer and M. Kubat. Learning in the presence of concept drift and hidden contexts. Mach. Learn., pages 69–101, 1996.
[29] R. Xiong, M. A. Smith, and S. M. Drucker. Visualizations of collabo-rative information for end-users. Technical report, Microsoft, 1999.