HAL Id: hal-01154824
https://hal.archives-ouvertes.fr/hal-01154824
Submitted on 24 May 2015
HAL is a multi-disciplinary open access
archive for the deposit and dissemination of
sci-entific research documents, whether they are
pub-lished or not. The documents may come from
teaching and research institutions in France or
abroad, or from public or private research centers.
L’archive ouverte pluridisciplinaire HAL, est
destinée au dépôt et à la diffusion de documents
scientifiques de niveau recherche, publiés ou non,
émanant des établissements d’enseignement et de
recherche français ou étrangers, des laboratoires
publics ou privés.
Classification and Comparative Analysis of Inter-Cell
Interference Coordination Techniques in LTE Networks
Mohamed Aboulhassan, Mohamad Yassin, Samer Lahoud, Marc Ibrahim,
Dany Mezher, Bernard Cousin, Essam Sourour
To cite this version:
Mohamed Aboulhassan, Mohamad Yassin, Samer Lahoud, Marc Ibrahim, Dany Mezher, et al..
Clas-sification and Comparative Analysis of Inter-Cell Interference Coordination Techniques in LTE
Networks. IFIP 7th Int. Conf. New Technologies, Mobility, and Security, Jul 2015, Paris, France. pp.1
-6, �10.1109/NTMS.2015.7266476.�. �hal-01154824�
Classification and Comparative Analysis of
Inter-Cell Interference Coordination Techniques
in LTE Networks
Mohamed A. AboulHassan
∗, Mohamad Yassin
†‡, Samer Lahoud
‡, Marc Ibrahim
†, Dany Mezher
†,
Bernard Cousin
‡, Essam A. Sourour
§∗Pharos University, Faculty of Engineering, Electrical Engineering Department, Alexandria, Egypt †Saint-Joseph University, ESIB, Campus des Sciences et Technologies, Mar Roukoz, Lebanon
‡University of Rennes 1, IRISA, Campus de Beaulieu, 35042 Rennes, France §Alexandria University, Department of Electrical Engineering, 21544 Alexandria, Egypt
Emails: {[email protected]},{[email protected]}
Abstract—Frequency reuse-1 model is required to satisfy the exponential increase of data demands in mobile net-works, such as the Long Term Evolution (LTE) of Universal Mobile Terrestrial radio access System (UMTS). However, the simultaneous usage of the same frequency resources in adjacent LTE cells creates inter-cell interference problems, that mainly affect cell-edge users. Inter-Cell Interference Coordination (ICIC) techniques are proposed to avoid the negative impact of interference on system performance. They establish restrictions on resource usage, such as Fractional Frequency Reuse (FFR), and on power allocation such as Soft Frequency Reuse (SFR). In this paper, we classify the existing ICIC techniques, and investigate the performance of reuse-1, reuse-3, FFR, and SFR schemes under various user distributions, and for various network loads. Performance of cell-center and cell-edge users are inspected, as well as the overall spectral efficiency. System level simulations show the advantages and limitations of each of the examined techniques compared to frequency reuse-1 model under different network loads and user distributions, which helps us to determine the most suitable ICIC technique to be used. Index Terms—Inter-Cell Interference Coordination, 3GPP LTE, reuse-3 model, FFR, SFR, spectral efficiency.
I. INTRODUCTION
Orthogonal Frequency Division Multiple Access (OFDMA) is the multiple access technique chosen by the Third Generation Partnership Project (3GPP) for the downlink of the radio interface in Long Term Evolution (LTE) networks [1]. Data is transmitted on a large number of parallel, narrow-band subcarriers, and the smallest resource unit that could be allocated for a User Equipment (UE) is called Resource Block (RB). Since subcarriers are orthogonal, intra-cell interference is eliminated; however, Inter-Cell Interference (ICI) remains the major problem for multiuser OFDMA networks such as LTE. It limits system performance and reduces the achievable throughput, especially for UEs located at the edge of the cell. ICI is caused by collisions [2] between RBs that are simultaneously used in adjacent cells, according to frequency reuse-1 model.
Dense frequency reuse scheme aims at improving sys-tem capacity by increasing the number of available RBs in each cell. It is a necessity for mobile network operators seeking to fulfill the huge data demands, due to the prolif-eration of mobile applications and the exponential increase
in the number of connected devices. Therefore, Inter-Cell Interference Coordination (ICIC) techniques are required to avoid the negative impact of ICI on system performance, without largely sacrificing spectral efficiency. ICIC aims at mitigating Signal-to-Interference and Noise Ratio (SINR) degradation by applying cell specific preferences for dif-ferent RB subsets, or by employing reduced power for colliding RBs [3].
Operators of the Global System for Mobile commu-nications (GSM) exploit the cellular concept along with frequency reuse-N [4] model, in order to use the same frequency resources in several distant cells without hav-ing restrictive interference problems. Although it largely reduces ICI, frequency reuse-N model has a negative impact on spectral efficiency, and consequently on system capacity. Only N1 of the available spectrum is used in each cell. Multiuser OFDMA networks require the usage of ICIC techniques that restrict the usage of parts of the spectrum through a frequency reuse factor larger than one for cell-edge UEs [5]. Such schemes succeed in improving SINR, but they reduce spectral efficiency since frequency bands available in each cell become smaller. Therefore, ICIC consists in managing the trade-off between SINR and spectral efficiency, through restrictions on RB scheduling, power allocation, or both.
Fractional Frequency Reuse (FFR) is a compromise between reuse-1 and reuse-N models. Each cell is divided into cell-center and cell-edge zones, where frequency reuse-1 model is used in the cell-center zone, while a higher frequency reuse factor is used in cell-edge zone. The available spectrum is divided into two sub-bands: the first one is permanently used in cell-center zones, while the second sub-band is used according to frequency reuse-N model in the edge zones. Consequently, SINR for cell-edge UEs is improved [6], since they operate on disjoint spectrum. One disadvantage of FFR is that a portion of the available spectrum is permanently unused in each cell. Soft Frequency Reuse (SFR) performs radio resource man-agement along with power allocation in order to mitigate ICI. In each cell, the available spectrum is divided into a cell-edge band, where RBs are allocated the maximum transmission power, and a cell-center band, where RBs are allocated a lower transmission power, in order to reduce
the resulting interference at the neighboring cells. In [7], we introduced a non-cooperative ICIC algorithm, and we investigated its performance compared to other techniques. However, state-of-the-art techniques are not evaluated for different network loads and for other per-formance parameters such as energy efficiency and UE satisfaction. In this paper, we describe and classify the existing ICIC techniques for multiuser OFDMA networks such as LTE. More specifically, we study the performance of reuse-1, reuse-3, FFR, and SFR schemes under uniform and non-uniform UE distributions. We focus particularly on spectral efficiency and fairness index for each of the compared techniques. We also investigate their impact on the achievable throughput under various UE distributions and network loads. A MATLAB-based LTE downlink system level simulator [8] is chosen as the simulation platform for our comparisons. An efficient ICIC technique succeeds in improving UE throughput without reducing spectral efficiency.
The remainder of this paper is organized as follows: in section II we describe FFR and SFR schemes, then we classify the existing ICIC approaches. System model of the LTE network is given in section III, while simula-tion environment and simulator parameters are explained in section IV. In section V, simulation results for the compared ICIC approaches under various conditions are presented and discussed. Concluding remarks are given in section VI.
II. RELATEDWORK
Frequency reuse-N model in GSM networks allows the usage of the same spectrum, several times within the network. For instance, in a cluster of three adjacent GSM cells, the available spectrum is divided into three sub-bands, and each cell operates on a disjoint part of spectrum. Moreover, the same radio channels are used on the same carrier frequency to cover different areas that are separated from one another by sufficient distances so that co-channel interference is almost eliminated [9]. Nevertheless, this scheme reduces spectral efficiency, since only one sub-band is used in each cell.
FFR and SFR are introduced to mitigate ICI in mul-tiuser OFDMA [10] networks such as LTE. The former applies restrictions on RB usage, while the latter adjusts transmission power allocated for each frequency sub-band. These two schemes divide each LTE cell into two zones: cell-center zone and cell-edge zone. UEs classification between the different zones is either made according to the distance that separates them from the serving base station, or according to their wideband SINR. When distance is chosen, the optimal cell-center region radius is approxi-mately equal to 23 of the overall cell radius [11]. However, distance-based classification is not accurate, since we might find cell-center UEs characterized by low SINR values, due to ICI and shadow fading problems. These UEs should be protected from ICI problems, as well as UEs located at cell border, and having low SINR (caused by propagation loss and interference). For these reasons, we divide each cell into two zones: one containing UEs characterized by Good Radio conditions (GR UEs); this zone is commonly known as cell-center zone. The second
contains UEs experiencing high ICI, thus characterized by Bad Radio conditions (BR UEs); this zone is commonly known as cell-edge zone. A GR UE is characterized by wideband SINR higher than a predefined SINRthreshold,
while BR UEs have their wideband SINR lower than this threshold. Another advantage for SINR-based classifica-tion is that it does not require any informaclassifica-tion about geographical positions of UEs.
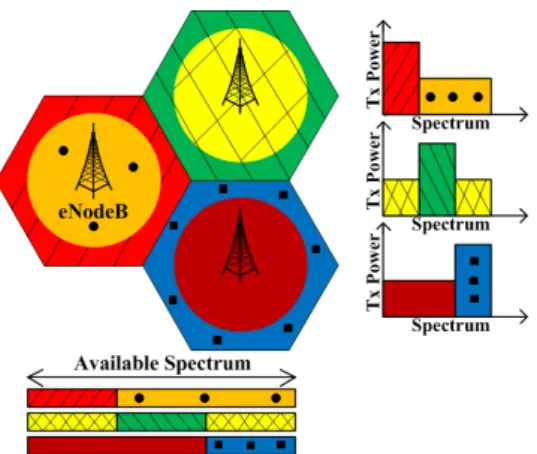
FFR and SFR techniques are illustrated in Fig. 1(a) and Fig. 1(b) respectively. FFR divides the available spectrum into a few non-overlapping frequency sub-bands [12]. GR and BR UEs of the same cell operate on different sub-bands, and BR UEs of the neighboring cells within the same cluster also operate on non-overlapping sub-bands. When SFR is applied, a portion of the available spectrum is permanently allocated the maximum downlink transmission power, while the remaining RBs are used with a lower transmission power. GR UEs have access to the low power frequency sub-band, while BR UEs use RBs from the high power frequency subset. SFR adopts reuse-1 model, and it protects BR UEs by reducing the transmission power allocated to the interfering RBs in the GR zones of the neighboring cells.
FFR and SFR techniques are compared with reuse-1 model in [13], where network throughput, spectral ef-ficiency, and cell-edge UEs SINR are discussed. It has also been proved that SFR balances the requirements of interference reduction and resource efficiency. However, only uniform UE distributions are considered in typical OFDMA deployment. In [14], authors introduced an adap-tive SFR technique that dynamically adjusts RB and power allocation in order to improve system capacity. It is a dis-tributed technique that requires an exhaustive search until a stable SFR pattern is found. The proposed technique is compared to traditional frequency reuse schemes under different traffic load scenarios to emphasize the dynamic aspect of the proposed technique. However, authors did not consider non-uniform UE distributions within the network. We should also mention several contributions that tried to improve FFR and SFR performance, such as [15, 16], in a distributed or cooperative manner. Authors in [17] introduce a heuristic power control algorithm to reduce ICI; another technique proposed in [18] performs power allocation according to SINR level for each RB. ICIC techniques are classified into frequency reuse-based, such as reuse-3, FFR, and SFR, autonomous techniques, where each cell makes its own interference mitigation decisions, independently of the other cells. Cooperative techniques make use of the communications between adjacent LTE cells over X2 interface, in order to adjust RB alloca-tion, power allocaalloca-tion, or both in a collaborative man-ner. Several works surveyed the existing ICIC techniques and classified them according to cell cooperation and frequency reuse such as [3, 19]. However, some of them only report qualitative comparisons of the existing ICIC techniques. Others perform simulations under uniform UE distributions and ordinary network scenarios. In our work, we investigate several interference mitigation techniques under various UE distributions, and we show the impact of each technique on throughput distribution and throughput fairness among all the active UEs. These evaluations allow
(a) FFR scheme (b) SFR scheme
Fig. 1: FFR and SFR schemes TABLE I: SINR-MCS-Data Rate Mapping Table
Minimum SINR Modulation and Coding Scheme (MCS) Data Rate (kbit/s) 1.7 QPSK(1/2) 168 3.7 QPSK(2/3) 224 4.5 QPSK(3/4) 252 7.2 16QAM(1/2) 336 9.5 16QAM(2/3) 448 10.7 16QAM(3/4) 504 14.8 64QAM(2/3) 672 16.1 64QAM(3/4) 756
us to draw conclusions on the efficiency of each technique for each of the simulated scenarios.
III. SYSTEMMODEL
A. Deployment Model
Our system model consists of seven adjacent Macro Base Stations (MBS). MBS coverage is modeled as a sec-torized hexagonal layout, where each site consists of three adjacent sectors. Each sector is served by an eNodeB that has its own scheduler, bandwidth, and power allocation policy. When reuse-1 model is used, the entire bandwidth is available in all the cells, while reuse-3 allows the usage of one third of the available spectrum in each cell. FFR applies restrictions on RB usage in each zone, and SFR adjusts transmission power allocation over RBs used by GR and BR UEs.
B. SINR-Data rate mapping
The value of achievable data rate that corresponds to the SINR value can be obtained from Table I [20]. C. UE distribution
We consider UE distribution between cell zones as an essential parameter in our simulations, since it has an important impact on UE throughput and on system performance. UEs are classified into GR and BR UEs according to their mean SINR over the available RBs. GR UEs are the ones characterized by relatively high SINR values in comparison with other UEs. SINR degradation
is mainly due to signal path loss, as well as interfering signals received from the neighboring base stations. UEs geographical positions and UE distribution between cell zones have a great impact on ICI, and consequently on system throughput. We simulate scenarios where UEs are uniformly distributed between GR and BR zones, as well as other scenarios characterized by non-homogeneous UE distributions. For instance, the majority of active UEs are either in GR zone or in BR zone.
IV. SIMULATIONENVIRONMENT
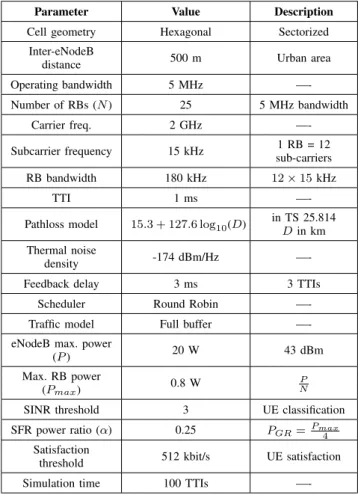
System level simulator used in our work is a MATLAB based simulator [21] developed by Vienna University of Technology. Reuse-1 model along with homogeneous power allocation are included in the original version of the simulator. FFR scheme is handled as a scheduling policy, where the scheduler of each eNodeB has restrictions on RB allocation for UEs in each zone. We adjusted the original code of the simulator so that non-homogeneous power allocation would be supported. We also made the necessary modifications to implement reuse-3 model and SFR technique. Simulation parameters for the LTE network are given in Table II.
As mentioned earlier in this paper, cell geometry is hexagonal, and each site consists of three adjacent sec-tors, where each sector is served by an eNodeB. Inter-eNodeB distance equals 500 m, which corresponds to an LTE network deployed in an urban area. In each cell, 25 RBs are available, since the operating bandwidth equals 5 MHz. However, traffic model is full buffer i.e., all the available RBs are permanently allocated for the active UEs in the network. UE scheduling is performed every one millisecond. Path loss model is the one defined by 3GPP in TS 25.814, and feedback reception at eNodeBs is delayed by three milliseconds. When homogeneous power allocation is used, the maximum downlink transmission power is allocated for each RB. However, SFR reduces the transmission power allocated for RBs used by GR UEs. SINRthreshold is a predefined parameter, used to classify
active UEs into GR and BR UEs. It can be adjusted by mobile network operators according to network load and UE satisfaction. Uniform and non-uniform UE distribu-tions are considered in our simuladistribu-tions, and reuse-1 model
TABLE II: Simulation Parameters
Parameter Value Description Cell geometry Hexagonal Sectorized
Inter-eNodeB
distance 500 m Urban area Operating bandwidth 5 MHz —-Number of RBs (N ) 25 5 MHz bandwidth Carrier freq. 2 GHz —-Subcarrier frequency 15 kHz 1 RB = 12 sub-carriers RB bandwidth 180 kHz 12 × 15 kHz TTI 1 ms
—-Pathloss model 15.3 + 127.6 log10(D) in TS 25.814D in km
Thermal noise
density -174 dBm/Hz —-Feedback delay 3 ms 3 TTIs
Scheduler Round Robin —-Traffic model Full buffer —-eNodeB max. power
(P ) 20 W 43 dBm Max. RB power
(Pmax) 0.8 W
P N
SINR threshold 3 UE classification SFR power ratio (α) 0.25 PGR=Pmax4
Satisfaction
threshold 512 kbit/s UE satisfaction Simulation time 100 TTIs
—-is compared to reuse-3, FFR, and SFR schemes. V. SIMULATIONRESULTS ANDANALYSIS
A. Performance Metrics
1) Spectral Efficiency: This metric reflects the effi-ciency of spectrum usage in terms of the achievable throughput using the available bandwidth. It is calculated as follows: Spectral efficiency = K P k=1 Rk [bit/s] Total spectrum [Hz], (1) where K denotes the set of active UEs in the network, and Rk is the mean throughput achieved by UE k.
2) UE throughput: We aim to find how much through-put for each zone is modified; thus, we study the impact of addressed ICIC techniques on UE throughput in each GR and BR zones, as well as mean throughput per UE.
3) Fairness index: Fairness indicates how much re-sources are distributes among users. Jain’s fairness index [22] is a good measure for fairness and can be given as:
J(R1, R2, ..., RK) = ( K P k=1 Rk)2 K. K P k=1 R2k , (2)
where J rates the fairness of a set of throughput values; K is the number of UEs, and Rk is the mean throughput
of UE k. Jain’s fairness index ranges from N1 (worst case) to 1 (best case). It reaches its maximum value
when all UEs receive the same throughput. An efficient ICIC technique reduces the gap between GR and BR UEs throughputs, and increases Jain’s fairness index.
4) UE satisfaction: It is the minimum throughput value required to guarantee an acceptable quality of service. A UE is considered satisfied if his average throughput is higher than satisfaction threshold.
The percentage of unsatisfied UEs among all the active UEs in the network is another parameter for performance comparison. An ICIC technique is better than other tech-niques when it shows the lowest percentage of unsatisfied UEs.
5) Throughput Cumulative Distribution Function (CDF): Empirical CDF for different values of throughput for each ICIC technique are calculated.
B. Results
1) Mean Throughput per Zone: The simulated network consists of seven adjacent LTE cells with 10 UEs randomly placed in each cell. Mean throughput for GR and BR zones as well as mean throughput per UE are calculated for 100 simulation runs, and mean results are shown in Fig. 2.
GR users BR users All users 0 0.1 0.2 0.3 0.4 0.5 0.6 0.7 0.8
Mean Throughput [Mbit/s]
Reuse−1 Reuse−3 FFR SFR
Fig. 2: Mean Throughput per GR, BR, and all UEs It is noticed that FFR technique improves BR UEs throughput, in comparison to reuse-1, reuse-3 and SFR techniques. It prohibits the usage of the same sub-band not only in adjacent BR zones, but also in any other GR zone of the considered cluster. Although ICI is minimized for BR UEs, available spectrum for GR zones become smaller, thus FFR reduces the average throughput per UE when compared to reuse-1 model.
Reuse-3 aggravates the disadvantage of FFR, where each cell is assigned only 1/3 of available bandwidth. Thus, mean throughput per UE reaches its lowest value with reuse-3 model. No plot is available for GR UEs with reuse-3 scheme, since all the active UEs are considered as BR UEs when reuse-3 model is applied. SFR tech-nique improves BR UEs throughput without reducing mean throughput per UE for the entire network. Indeed, the power allocation strategy applied by SFR mitigates ICI for BR UEs. Thus, it maximizes the usage of the available spectrum in all network cells, and reduces ICI simultaneously.
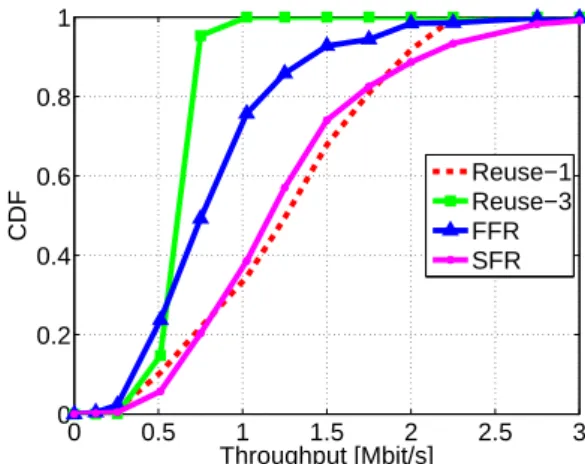
2) Throughput Cumulative Distribution Function: Em-pirical CDF for the compared techniques is calculated for
the same simulation scenario. These values allow us to study throughput distribution among active UEs in the network as illustrated in Fig. 3.
0 0.5 1 1.5 2 2.5 3 0 0.2 0.4 0.6 0.8 1 Throughput [Mbit/s] CDF Reuse−1 Reuse−3 FFR SFR
Fig. 3: Throughput cumulative distribution function It is shown that throughput CDF of reuse-3 model is the first technique to reach the maximum. Although ICI is mitigated, the amount of available RBs in each cell is not enough to guarantee high data rates for UEs. FFR CDF throughput function is improved in comparison with reuse-3; however, it is also faster than reuse-1 CDF in reaching the maximum. For SFR, the number of UEs suffering bad quality of service is reduced. For relatively low throughput values (less than 1 Mbit/s) throughput CDF for SFR is the lowest curve; thus, it shows the lowest percentage of UEs served with low throughputs. Moreover, SFR curve is the last one to reach its maximum (at 3 Mbit/s approximately). When SFR is applied, we make use of all the available spectrum in each cell, and BR UEs have access to the portion of bandwidth with less ICI. Consequently, the achievable throughput increases, and BR UEs throughput is improved.
3) UE Satisfaction Versus Network Load: The percent-age of unsatisfied UEs for each technique is compared and presented in Fig. 4 for different number of UEs per cell. For each scenario, simulations are repeated 100 times. Satisfaction throughput threshold is set to 512 kbit/s. If the average throughput of a UE is higher than this threshold, it is considered as satisfied; otherwise, this UE is considered as an unsatisfied UE. 0 5 10 15 20 0 20 40 60 80 100
Nb of UEs per eNodeB
% of unsatisfied UEs
Reuse−1 Reuse−3 FFR SFR
Fig. 4: UE satisfaction versus network load
We notice that reuse-3 technique shows the lowest per-centage of unsatisfied UEs for low network loads. When each cell is using a disjoint part of spectrum, ICI problems are eliminated. However, the percentage of unsatisfied UEs becomes the highest among all the compared techniques when the network load increases. Only one third of the available spectrum is used in each cell; thus, network capacity and UE satisfaction are reduced when network load increases.
Despite of the power reduction over RBs allocated for GR UEs, SFR shows approximately the same percentage of unsatisfied UEs as for reuse-1 model. The power allocation strategy reduces ICI, especially for BR users, and GR throughput loss is compensated. Compared to reuse-1 model, FFR increases the percentage of unsatisfied UEs, due to restrictions on RB usage between network cells. A portion of the available spectrum is not allowed to be used in each cell. When network load increases, FFR performance becomes better than reuse-3 model. It is a compromise between reuse-1 model (in cell-center zone) and reuse-3 model (in cell-edge zone).
4) Fairness Index Versus UE Distribution: We then study UEs throughput fairness index when the percentage of GR UEs in the network changes. For each UE distribu-tion, simulations are repeated 100 times, and the obtained results are illustrated in Fig. 5.
20 30 40 50 60 70 80 0.4 0.5 0.6 0.7 0.8 0.9 1 % of GR users Fairness index Reuse−1 Reuse−3 FFR SFR
Fig. 5: Fairness index versus percentage of GR UEs Reuse-3 model shows the highest throughput fairness index among all the studied techniques. In fact, ICI is eliminated, and the achievable throughput is approximately the same for all UEs. For reuse-1 model, BR UEs suffer from ICI, which has a negative impact on their throughput, while GR UEs achieve higher throughputs. Thus, it shows a lower fairness index. The static RB and power distri-butions between BR and GR zones, applied in FFR and SFR, are not adequate for all UE distributions, especially when the majority of active UEs are not homogeneously distributed between cell zones. Although they succeed in reducing ICI, FFR and SFR do not improve throughput fairness among all UEs for these particular scenarios, because restrictions made on RB usage between cell zones are not adjusted according to UE demands. Nevertheless, FFR improves Jain’s fairness index in comparison with reuse-1 model when 55% to 65% of UEs are GR UEs. Thus, FFR tuning parameters should be adjusted according
to network load and UE distribution between the different zones.
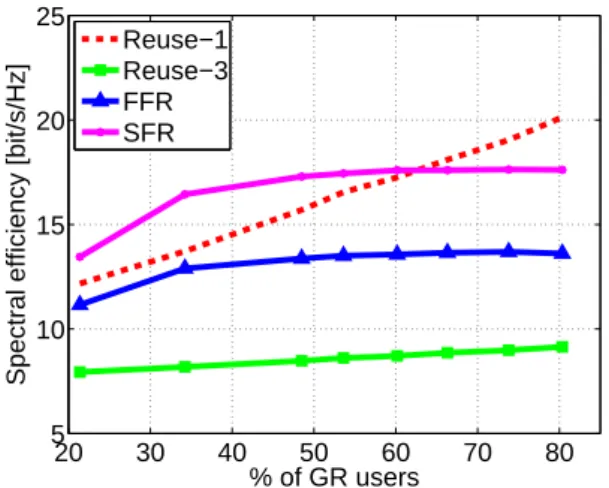
5) Spectral efficiency versus UE distribution: The im-pact of UE distribution on spectral efficiency is then studied for the compared ICIC techniques, and simulation results are reported in Fig. 6.
20 30 40 50 60 70 80 5 10 15 20 25 % of GR users
Spectral efficiency [bit/s/Hz]
Reuse−1 Reuse−3 FFR SFR
Fig. 6: Spectral efficiency versus percentage of GR UEs It can be noticed that SFR shows the highest spectral efficiency, as it utilizes entire available spectrum in every cell, while imposing constrains on power allocation for RBs available in each zone. Therefore, it succeeds in reducing ICI while increasing spectral efficiency for all UE distributions, except the case where the majority of UEs are GR UEs: in this case, reuse-1 model is better since it achieves higher throughputs without the need to reduce downlink transmission power. Restrictions on RB usage make reuse-3 technique the one with the lowest spectral efficiency: in a cluster of three adjacent cells, only one third of the available spectrum is used in each cell. FFR is a compromise between reuse-1 and reuse-3 models, since reuse-1 model is used in GR zones, while reuse-3 model is used for BR zones. Thus, spectral efficiency curve for FFR is located between the curves of reuse-1 and reuse-3 schemes.
VI. CONCLUSION
In this paper, the performance of several ICIC tech-niques, such as reuse-3 model, FFR, and SFR, is analyzed. System-level simulations are performed under uniform and non-uniform UE distributions to compare their per-formance with that of reuse-1 model. Mean throughput per zone, throughput fairness index, UE satisfaction, and spectral efficiency are investigated under uniform and non-uniform UE distributions. SFR shows the highest spectral efficiency for approximately all UE distributions, unless the majority of UEs have good radio conditions. In this case, the usage of reuse-1 model is better. Reuse-3 outperforms all the other techniques in terms of UE satisfaction and throughput fairness, only when network load is relatively low. However, it permanently shows the lowest spectral efficiency. FFR technique is a compromise between reuse-1 and reuse-3 models. Moreover, FFR and SFR require interventions from mobile network operator to adjust RB and power distribution between cell zones according to UE distribution and throughput demands.
REFERENCES
[1] 3GPP, “Physical Layer Aspects for Evolved Universal Terrestrial Radio Access (UTRA) (Release 7),” 3GPP TR 25.814 V7.1.0, Tech. Rep., 2006.
[2] R. Bosisio and U. Spagnolini, “Interference Coordination Versus Interference Randomization in Multicell 3GPP LTE System,” in IEEE 2008 Wireless Communications and Networking Conference, March 2008, pp. 824–829.
[3] G. Fodor, C. Koutsimanis, A. Rcz, N. Reider, A. Simonsson, and W. Mller, “Intercell Interference Coordination in OFDMA Networks and in the 3GPP Long Term Evolution System,” Journal of Communications, vol. 4, 2009.
[4] J. Denes and A. Keedwell, “Frequency Allocation for a Mobile Radio Telephone System,” IEEE Transactions on Communications, vol. 36, no. 6, pp. 765–767, June 1988.
[5] D. Astely, E. Dahlman, A. Furuskar, Y. Jading, M. Lindstrom, and S. Parkvall, “LTE: The Evolution of Mobile Broadband,” IEEE Communications Magazine, vol. 47, no. 4, pp. 44–51, April 2009. [6] G. Boudreau, J. Panicker, N. Guo, R. Chang, N. Wang, and S. Vrzic, “Interference Coordination and Cancellation for 4G Networks,” IEEE Communications Magazine, vol. 47, no. 4, pp. 74–81, 2009. [7] M. Yassin, S. Lahoud, M. Ibrahim, K. Khawam, D. Mezher, and B. Cousin, “Non-Cooperative Inter-Cell Interference Coordination Technique for Increasing Throughput Fairness in LTE Networks,” in IEEE 81st Vehicular Technology Conference, Glasgow, May 2015. [8] LTE Downlink System Level Simulator. Vienna University of Technology. [Online]. Available: http://www.nt.tuwien.ac.at/research/mobile-communications/ltedownlink-system-level-simulator/
[9] V. Donald, “Advanced Mobile Phone Service: The Cellular Con-cept,” The Bell System Technical Journal, vol. 58, no. 1, pp. 15–41, January 1979.
[10] L. Hanzo, J. Akhtman, L. Wang, and M. Jiang, MIMO-OFDM for LTE, WiFi and WIMAX: Coherent Versus non-Coherent and Cooperative Turbo-Transceivers, Wiley, Ed. Chichester, UK: Wiley-IEEE Press, October 2010.
[11] M. Assaad, “Optimal Fractional Frequency Reuse (FFR) in Mul-ticellular OFDMA System,” in IEEE 68th Vehicular Technology Conference, September 2008, pp. 1–5.
[12] K. Yang, “Interference Management in LTE Wireless Networks [Industry Perspectives],” IEEE Wireless Communications, vol. 19, no. 3, pp. 8–9, June 2012.
[13] T. Novlan, J. Andrews, I. Sohn, R. Ganti, and A. Ghosh, “Compar-ison of Fractional Frequency Reuse Approaches in the OFDMA Cellular Downlink,” in IEEE 2010 Global Telecommunications Conference, December 2010, pp. 1–5.
[14] M. Qian, W. Hardjawana, Y. Li, B. Vucetic, X. Yang, and J. Shi, “Adaptive Soft Frequency Reuse Scheme for Wireless Cellular Networks,” IEEE Transactions on Vehicular Technology, vol. PP, no. 99, pp. 1–1, 2014.
[15] D. Gonzalez, M. Garcia-Lozano, S. Ruiz Boque, and D. S. Lee, “Optimization of Soft Frequency Reuse for Irregular LTE Macro-cellular Networks,” IEEE Transactions on Wireless Communica-tions, vol. 12, no. 5, pp. 2410–2423, May 2013.
[16] D. Lee, G. Li, and S. Tang, “Inter-Cell Interference Coordination for LTE Systems,” in IEEE 2012 Global Communications Confer-ence, December 2012, pp. 4828–4833.
[17] M. Yassin, S. Lahoud, M. Ibrahim, and K. Khawam, “A Downlink Power Control Heuristic Algorithm for LTE Networks,” in 21st International Conference on Telecommunications, May 2014, pp. 323–327.
[18] M. Aboul Hassan, E. Sourour, and S. Shaaban, “Novel Resource Allocation Algorithm for Improving Reuse One Scheme Perfor-mance in LTE Networks,” in 21st International Conference on Telecommunications, May 2014, pp. 166–170.
[19] A. Hamza, S. Khalifa, H. Hamza, and K. Elsayed, “A survey on inter-cell interference coordination techniques in ofdma-based cel-lular networks,” Communications Surveys Tutorials, IEEE, vol. 15, no. 4, pp. 1642–1670, 2013.
[20] H. Ramli, R. Basukala, K. Sandrasegaran, and R. Patachaianand, “Performance of well known packet scheduling algorithms in the downlink 3GPP LTE system,” in IEEE 9th Malaysia International Conference on Communications, December 2009, pp. 815–820. [21] J. Ikuno, M. Wrulich, and M. Rupp, “System Level Simulation of
LTE Networks,” in IEEE 71st Vehicular Technology Conference, May 2010, pp. 1–5.
[22] R. K. Jain, D. W. Chiu, and W. R. Hawe, “A Quantitative Measure of Fairness and Discrimination for Resource Allocation and Shared Computer System,” Digital Equipment Corporation, Tech. Rep., 1984.