O
pen
A
rchive
T
OULOUSE
A
rchive
O
uverte (
OATAO
)
OATAO is an open access repository that collects the work of Toulouse researchers and
makes it freely available over the web where possible.
This is an author-deposited version published in :
http://oatao.univ-toulouse.fr/
Eprints ID : 11687
To link to this article : URL :
http://www.irit.fr/recherches/ICS/events/conferences/ataccs/ataccs2 011/ATACCS2011-proceedings.pdf
To cite this version :
Pizziol, Sergio and Dehais, Frédéric and Tessier, Catherine Towards human operator “state” assessment. (2011) In: 1st International Conference on Application and Theory of Automation in Command and Control Systems, 26 May 2011 - 27 May 2011 (Barcelone, Spain).Any correspondance concerning this service should be sent to the repository
administrator:
[email protected]
Towards human operator “state” assessment
Sergio Pizziol*/**– Frédéric Dehais**– Catherine Tessier*
*ONERA, 2 avenue Edouard Belin, F-31055 Toulouse Cedex 4[email protected], [email protected] **ISAE, 10 avenue Edouard Belin, F-31055 Toulouse Cedex 4
ABSTRACT
This paper focuses on an approach to estimate the symbolic “state” and detect the attentional tunneling of a human operator in the frame of a human-robot mission. The symbolic “state” results from a fuzzy aggregation of the operator's gaze position and heart rate.
Keywords
Human operator state, Authority conflict, Situation awareness, Attentional tunneling, Eye tracker, Heart rate.
INTRODUCTION
We consider an heterogeneous system in which a robot accomplishes a mission interacting with a human operator. During the mission, agents are given or take the authority [7] to use a resource, to perform a task, to satisfy a goal. A change in authority allocation can be planned in procedures or in the mission plan, or can be unexpected: this happens when the human operator takes over a task controlled by the robot because they detect a failure, or for any reason of their own; or when the robot takes over a task controlled by the operator because the operator's action violates some constraints (collision with an obstacle, etc.), or because communication with the operator is broken.
The challenge created by these unexpected changes in authority allocation is that conflicts are likely to appear within the human-robot system, due to the fact that either the plan for both the human and robot is not followed anymore, or the operator has a wrong situation awareness [13], or both. Experimentations reveal that the occurrence of such conflicts in mission management systems [4] lead to summon up most of the human operators' resources toward conflict solving. As a consequence, the cognitive abilities of the operators are impaired with a strong tendency to attentional tunneling [14] where critical information such as visual or auditory alarms [6] are neglected.
A rough definition of attentional tunneling is “the
allocation of attention to a particular channel of information, diagnostic hypothesis or task goal, for a duration that is longer than optimal, given the expected cost of neglecting events on other channels, failing to consider other hypothesis, or failing to perform other tasks” [12].
This particular phenomenom is illustrated by an experiment, conducted at Supaero-ISAE, on a target search mission achieved by a ground robot and a remote human operator. During the mission, the operator must pilot the robot manually to identify targets, via their interface (see figure 1) and the video (area 8) coming from the robot 360-degree camera.
While the operator takes over the robot for target
identification, a battery failure, triggered by the experimenter, activates a safety procedure that makes the robot go back to base. This event is presented on the operator's interface via three alarms: the battery icon (area 7) switches from green to orange, the piloting mode (area 3) blinks twice from "manual" to "supervised", and the display (area 5) shows "Back to base" in green.
However, as this unexpected event occurs at a critical time in the mission when the operator is particularly focused on the identification task in manual mode; the results showed that 9 participants out of 13 had faced attentional tunneling and had not understood the automation logic.
Our work focuses on on-line conflict detection and solving in human-robot systems. Therefore we have to : 1- estimate the state of the whole human-robot system, i.e. Estimate the state of the robot, the "state" of the human operator and the state of the interaction between the two;
2- recognize and predict conflicts, i.e. inconsistent or unwanted states of the human-robot system;
3- for each type of conflict, solve it thanks to an adaptation of the human-robot system (i.e. replanning, changes in authority sharing [9], countermeasure sending [5]).
As far as 1- is concerned, the estimation of the "state" of the human operator is a challenge. Indeed both data and models for recognizing special "states" are needed. According to the literature, an excessive focus of the human operator is associated with a decreased saccadic activity and long concentrated eye fixations [2] and consequently less scanned areas of interests on the user's interface [10]. The heart rate also confirms that the catabolic activity increases. The paper highlights preliminary work to learn state models of the human operator from data taken from the above described
Figure 1: Eight Areas Of Interest (AOIs) are defined on the GUI as follows: 1) tactical map, 2) interactive panel, 3) piloting mode, 4) synoptic, 5) back to base, 6) GPS and ultrasound status, 7) battery status, and 8) panoramic video.
experiment such as the gaze position and the heart rate. After some normalization, the data are aggregated thanks to fuzzy rules so as to bring out symbolic states such as "OK" and "Attentional tunneling".
The first results are encouraging and pave the way for the design of models to track the "state" of a human operator.
EYE TRACKER DATA ANALYSIS
An eye tracker (ET) is a device to detect the position of the pupil and, thanks to a previous calibration process, the point on the screen the gaze is pointing at.
Once a partition of the graphical user interface has been done, the data coming from the ET can be interpreted as a sequence of AOIs been gazed at each frame of the sampling.
In this preliminary work the value of the position as a continuous value will not be analyzed, neither will all the continuous quantities as the gaze barycenter, speed and acceleration.
Hereafter we give a brief description of the process that brought us to the definition of the three metrics used to analyze the AOI sequence.
Time percentage on Video
The more the human operator spends time gazing the video (AOI 8), the less the probability he perceives the information from the other AOIs.
Of course the dataflow received from the video is richer than the other AOIs. Moreover AOI 8 is the largest. For almost all the human operators the most gazed AOI will be AOI 8. However there are noticeable differences between the subjects.
In order to compare the time spent on each AOI we could have made a “normalization” taking as the denominator an index taking into account the surface of the relevant AOI and the mean dataflow being expected. But if the surface of each AOI is well known, this is not the case for the relevant dataflow: a single bit representing the state change of a binary status indicator may be more relevant than the compressed data representing the differences between two frames of the video. So that kind of normalization will not be made. Moreover, the estimation of the symbolic state of one subject will be achieved by comparison between the subjects and not within each subject. More details about normalization are given hereafter.
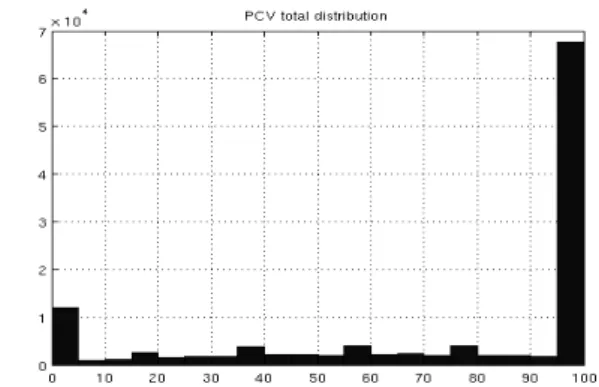
The percentage of time spent on the video (PCV) depends on the period of time taken into account. If we take as the reference time “1s” the percentage of time spent on the video will pass from video0% to video100% in “1s”, if we assume that the mean time spent on each AOI is greater than “1s”.
The result is almost a binary value (see figure 2) telling us if the human operator is now watching AOI 8 but one second late.
On the other hand taking as the reference time “1 minute” will give us a richer distribution, but the drawback is a delay of the order of “1 minute”. We have chosen a trade off, i.e. the shortest period for which the sum of the video0% and video100% cases is less than 15% of the whole distribution. That gives us a 10s period.
Number of AOIs and Switching rate
Two other complementary metrics come from the ET data: the number of AOIs being scanned in a defined amount of time, and the numbers of changes of AOIs in a defined amount of time. We will refer to them respectively as NBAOI (Number of AOIs) and SWR (Switching rate).
NBAOI allows us to estimate the part of the whole available dataflow being actually caught by the human operator. SWR estimates the rate at which the information is updated by the human operator. They represent respectively a measure of the situation awareness completeness and of the situation awareness obsolescence.
As done for the PCV the period has been chosen as the shortest for which the sum of 0% and 100% cases is less than 15% of the whole distribution. That gives us a 10.5s period for the SWR and 20s period for the NBAOI.
HEART RATE ANALYSIS
Based on previous literature [8], we have collected cardiovascular measures in order to estimate the workload and stress the human operators experience. We collected Heart Rate (HR) time series with 8Hz sampling. The HR has been filtered using a 5-second sliding average window (HRF).
Heart rate standard deviation
In order to estimate the anxiety the HR irregularity is also used [1]. The metrics used is the HR standard deviation (HRS). As reference time we use 5s.
Hereafter we show the used normalization. Note that both HRF and HRS have been nondimensionalized using
Figure 3: PCV histogram. Reference time: 10s Figure 2: PCV histogram. Reference time: 1s.
the mean HR of the complete sequence of the relevant subject before normalization.
NORMALIZATION
The normalization rule used for the PCV and NBAOI is the following:
X
norm
i=
X i− X
minX
max−
X
min,
where
X i
is the metrics value in a frame,X
min andX
max the extreme values of thecomplete time series,
X
norm
i
the normalized metrics value for that frame.The extreme values for SWR, HRF and HRS change if we consider different populations. To significantly reduce the sample variance the extreme values are replaced by the 5th and 95th percentiles. We also use
saturations to grant a normalized value between 0 and 1. Those saturations are activated in almost 10% of the cases.
FUZZY LOGIC
It is appropriate to use fuzzy logic when a mathematical model of the phenomena does not exist, when the input signals are noisy, when variables are continuous, when it exists an intuitive relation defined in terms of natural language between the input and the output [8, 3].
All these conditions are fulfilled by our problem, so we have decided to use fuzzy logic to aggregate the data. Figure 4 shows the organization of the data aggregation
system.
AOI sequence is analyzed in order to estimate for each frame (24Hz) the current PCV, NBAOI and SWR. A first fuzzy box synthesizes this information and outputs what we call Focus (F). Focus is a measure of how much the human operator is focusing on the video, and how much their situation awareness is incomplete and obsolescent. HR sequence is analyzed in order to estimate for each frame (8Hz) the current HRF and HRS. Cardiac Stress (CS) is a synthesis of both signals. The synthesis is made via a second Fuzzy box.
The last step is the synthesis of both F and CS. CS has been oversampled to reach 24 Hz via a zero-order hold. We call Tunneling (T) the final output.
T is normalized and interpreted as a symbolic state. Hereafter we use a three-level tunneling alert representation.
In order to have an alert level blind to little oscillations
of T near the levels transition boundaries, those boundaries are sense-dependent, i.e. level A to level B transition boundary (engage level B) is greater than level B to level A (disengage level B) one.
Domain functions
The domain functions for PCV, SWR and NBAOI have been defined as follows:
-Low if under the 25th percentile
-Medium if on the 50th percentile
-High if over the 75th percentile
For the Low value (Medium value) in the range 25th/50th
a linear interpolation from 1 to 0 (0 to 1) has been performed. The same kind of interpolation has been performed in the range 50th/75th for the Medium/High
values.
For HRF and HRS the domain functions are as follows: Low if on the minimum value, High if on maximum value. For the Low value (High value) a linear interpolation from 1 to 0 (0 to 1) has been performed.
Rules
For the Focus rules we have stated that Focus is directly proportional to PCV and inversely proportional to NBAOI and SWR.
For the Cardiac Stress the rule is that if both HRF and HRS metrics give the same information then there is no doubt about the CS. Otherwise the synthesis is uncertain and will give a medium level output.
As for the Tunneling rules we have stated that the level of T is the greatest of the F and CS levels, as a worst case rule. Here are some examples of the encoded rules: Some Focus rules:
if (SWR is high) then (F is low) if (SWR is medium) then (F is medium) if (SWR is low) then (F is high) Some Cardiac Stress rules:
if (HRF is low) and (HRS is low) then (CS is low) if (HRF is high) and (HRS is low) then (CS is medium) Some Tunneling rules:
if (F is medium) and (CS is low) then (T is medium) if (F is medium) and (CS is medium) then (T is medium) if (F is medium) and (CS is high) then (T is high)
RESULTS
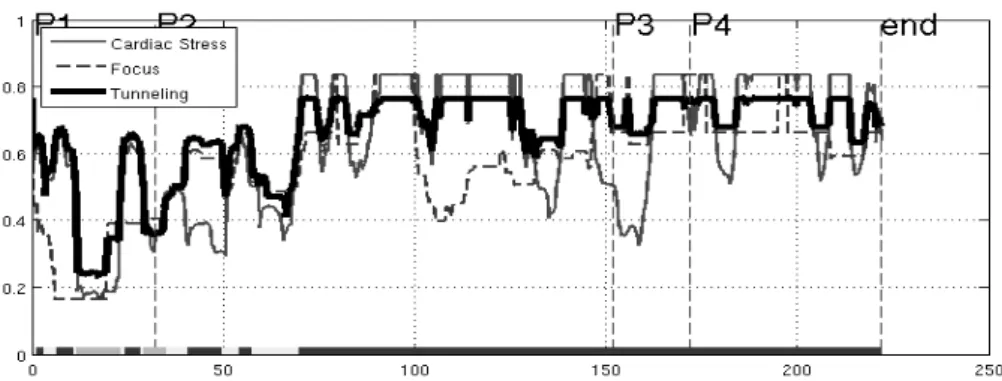
Figures 5 and 6 show the results for two subjects. The time references on the figures are:
P1: start of phase “research area” P2: start of phase “search target”
P3: start of phase “identify target” (i.e. manual piloting) P4: failing battery alarms, piloting mode "supervised”, start of the conflict
P5 (if present): end of the conflict [9].
On the time axis the alert level is represented by a three-color code (red, yellow and green in three-colored version, black, dark grey and light grey in black and white version).
As we can notice for case A during phase “search target”, the alert level goes from low to high. The alert level is stable on high for the rest of the mission.
As for case B during manual piloting, the alert level goes from low to high. After the start of the conflict the alert level is stable on high. After the end of the conflict the
alert level goes from high to low in about 10 seconds.
CONCLUSION
The next step of the work will be to use the data aggregation system in a real-time application, in the frame of a similar human-robot experiment.
The tunneling symbolic state will be used to recognize and predict conflicts within the human-robot system and solve them with the proper reaction (i.e. replanning, changes in authority sharing [9], countermeasure sending [5]).
REFERENCES
1. Bishop, L. F. and Reichert P. (1969). The Interrelationship Between Anxiety and arrhythmias. Annual Meeting of the Academy of Psychosomatic Medicine, Scottsdale, Arizona. 2. Cowen, L., and Ball, L., and Delin, J., 2002. An eye-movement analysis of web-page usability. In: People and Computers XVI: Memorable Yet Invisible, Proceedings of HCI, pp. 317-335.
3. Cox, E. (1992). Fuzzy fundamentals. IEEE Spectrum 29 (19), 58-61.
4.Dehais, F. and Tessier, C. and Chaudron, L. (2003). Ghost: Experimenting conflicts countermeasures in the pilot's activity. International Joint Conference on Artificial Intelligence (IJCAI), 18, 163-168.
5. Dehais, F. and Tessier, C and Christophe, L. and Reuzeau, F. (2009). The perseveration syndrome in the pilot's activity: guidelines and cognitive countermeasures. 7th International Working Conference on Human Error, Safety, and System Development (HESSD), Brussels, Belgium.
6. Dehais, F., and Tessier, C., and Christophe, L., and Reuzeau, F. (2010). The perseveration syndrome in the pilotís activity: guidelines and cognitive countermeasures. Human Error,
Safety and Systems Development, 68-80.
7. Hardin, B. and Goodrich, M. A. (2009) . On using mixed-initiative control: a perspective for managing large-scale robotic teams . HRI '09 Proceedings of the 4th ACM/IEEE international conference on Human robot interaction . San Diego, CA, USA
8. Mandryk, R.L. and Atkins, M.S. (2007). A fuzzy physiological approach for continuously modeling emotion during interaction with play technologies. International Journal of Human-Computer Studies 65, 329-347.
9. Mercier, S. and Tessier, C. and Dehais, F. (2010). Authority management in human-robot systems. 11th IFAC/IFIP/IFORS/IE Symposium on Analysis, Design, and Evaluation of Human-Machine Systems, Valenciennes, France. 10. Thomas, L., and Wickens, C. (2004). Eye-tracking and individual differences in off-normal event detection when flying with a synthetic vision system display. Conference Proceedings of the Human Factors and Ergonomics Society, 48(1), 223-227.
11. Tsai, Y., and Viirre, E., and Strychacz, C., and Chase, B., and Jung, T., 2007. Task performance and eye activity: predicting behavior relating to cognitive workload. Aviation, Space, and Environmental Medicine 78, pp 176-185.
12. Wickens, C.D. (2005). Attentional Tunneling and Task Management. Technical ReportAHFD-05-23/NASA-05-10. www.humanfactors.illinois.edu.
13. Wickens, C.D. (2008). Situation awareness: review of Mica Endsley's 1995 articles on situation awareness theory and measurement. Human Factors, 50(3).
14. Wickens, C. D., and Alexander, A. L. (2009). Attentionaltunneling and task management in synthetic vision displays. International Journal of Aviation Psychology, 19(2), 182-199.
Figure 5: Human operator's “state” during the mission. Case A: attentional tunneling