Any correspondence concerning this service should be sent to the repository administrator:
[email protected]
Identification number:
DOI : 10.1016/j.nimb.2009.10.124
Oficial URL:
http://dx.doi.org/10.1016/j.nimb.2009.10.124
This is an author-deposited version published in:
http://oatao.univ-toulouse.fr/
Eprints ID: 11490
To cite this version
:
Piotrowska, Natalia and De Vleeschouwer, François and Sikorski, Jarosław and
Pawlyta, Jacek and Fagel, Nathalie and Le Roux, Gaël and Pazdur, Anna
Intercomparison of radiocarbon bomb pulse and 210Pb age models. A study in a
peat bog core from North Poland.
(2010) Nuclear Instruments and Methods in
Physics Research Section B: Beam Interactions with Materials and Atoms, vol. 268
(n° 7-8). pp. 1163-1166. ISSN 0168-583X
O
pen
A
rchive
T
oulouse
A
rchive
O
uverte (
OATAO
)
OATAO is an open access repository that collects the work of Toulouse researchers and
makes it freely available over the web where possible.
Intercomparison of radiocarbon bomb pulse and
210
Pb age models. A study
in a peat bog core from North Poland
Natalia Piotrowska
a,*, François De Vleeschouwer
a,1, Jarosław Sikorski
a, Jacek Pawlyta
a,
Nathalie Fagel
b, Gaël Le Roux
b,2, Anna Pazdur
aaDepartment of Radioisotopes, Institute of Physics, Silesian University of Technology, Krzywoustego, 2, Gliwice 44100, Poland bClays and Palaeoclimate Unit, Department of Geology, University of Liège, Allée du 6 Aout, B18, Sart Tilman, Liège 4000, Belgium
Keywords:
Radiocarbon Bomb pulse curve 210Pb
Peat bog Age-depth model
a b s t r a c t
Radiocarbon and210Pb were measured on the uppermost 40 cm of a Wardenaar peat core retrieved from
a Baltic raised bog at Słowin´skie Błota (Pomerania, North Poland). This site is the subject of ongoing mul-tiproxy studies covering the last 1300 years. Radiocarbon age model was constructed on the basis of 14 AMS dates obtained on selected Sphagnum spp. fragments, with use of P_Sequence tool. We present here a comparison of this model with the age model obtained using CRS model classically applied to 210Pb
measurements.
1. Site and objectives
Słowin´skie Błota peat bog is located 8 km to the south-east of Darłowo city, and 10 km away from the Baltic Sea (Fig. 1A). It is one of the best-preserved Baltic raised peat bogs in Poland, and at present it is exclusively ombrotrophic. The peat bog is of ellipti-cal shape, with semi-axis of 1.8 and 0.9 km long, and covers an area of 1.2 km2. The actual vegetation is composed of several species of
Sphagnum, and in the outer parts blueberry, heather and white
birch are present (Fig. 1B).
The central part of the peat bog has been cored in 2006 using a Wardenaar sampler[2]in the framework of a project aimed on high resolution multiproxy investigations of past environmental conditions, performed on two 1-m-long profiles, reaching ca. 700AD. These studies include plant macrofossils, pollen, testate amoebae[3], stable carbon isotopes, elemental geochemistry and lead isotopes[4,5].
14C and210Pb dating methods were applied in order to obtain
timescale for the studies mentioned above. The present work fo-cuses on the last 150 years and is aiming to compare the age-depth models constructed independently on the basis of14C and210Pb
dating methods for this period. The main purpose of this study is to look for the best-constrained and precise age-depth model for the period since Industrial Revolution.
2. Methods
2.1.210Pb dating
One-centimeter thick samples for 210Pb dating were prepared
by sequential HNO3–H2O2–HCl digestion and polonium was
depos-ited on silver discs. Alpha activity was measured using a Canberra model 7401 spectrometer equipped with a surface-barrier Si semi-conductor detector. The nearly constant activity of210Pb (ca. 10 Bq/
kg), which was detected below 34 cm depth, was assumed to rep-resent the supported 210Pb. Calculated activities of unsupported 210Pb and Constant Rate of Supply (CRS)[6]model allowed the
con-struction of an age-depth relationship[4].
2.2.14C dating
Macrofossils were carefully selected from fourteen 1-cm peat slices under a binocular microscope. In case of insufficiency of
Sphagnum fragments, other aboveground plants or large charcoal
fragments were picked up. Great care has been taken to remove roots and rootlets in order to avoid carbon contamination from overlying layers. The composition of samples is presented in
Table 1, and basically reflects well the plant macrofossil composi-tion reported in[4]. In the zone of high Sphagnum content, which is
doi:10.1016/j.nimb.2009.10.124
* Corresponding author. Tel.: +48 32 237 2663; fax: +48 32 237 2254.
E-mail address:[email protected](N. Piotrowska).
1 Present address: Station Scientifique des Hautes Fagnes (ULg), Station Scientifique des Hautes-Fagnes 137, rue de Botrange, Robertville (Mont-Rigi) B4950, Belgium.
2 Present address: EcoLab Toulouse UMR 5245 CNRS-UP-INPT, Campus Ensat, Avenue de l’Agrobiopole, BP 32607, Auzeville tolosane, Castanet-Tolosan 31326, France.
up to the depth 15 cm, the samples are composed by pure
Sphag-num stems or branches, whereas in the lower part, where the
abundance of Erica and Calluna remains increased, the samples for radiocarbon dating contain also those species.
All samples were chemically cleaned using an acid–alkali-acid treatment, and subsequently combusted, according to the protocol
described in[7]. The CO2was graphitized during the reaction with
H2at 600 °C, on Fe catalyst. Measurements were performed with
use of NEC 0.5MV Pelletron spectrometer in Poznan Radiocarbon Laboratory, Poland[8].
2.3. Calibration of14C results
Calibration of radiocarbon dates was undertaken using the Int-cal04 calibration curve[9]and NH1 curve[10]. In order to reach the year of collection (2006) the NH1 curve had to be extrapolated to year 2006, which was done with use of exponential function. OxCal 4.0 software was used[11], and a priori information about depths was introduced in a P_Sequence model[12], which is based on a Bayesian theorem. The discrepancy within the sequence ap-peared when all the radiocarbon dated levels were considered. This problem could be solved only if one date was considered to be an outlier and excluded from the model. In view of probability distri-butions plotted versus depth (Fig. 2), it seems that one of the sam-ples at depths 21–22 or 26–27 should be removed. Taking into consideration the composition of the samples (Table 1), it was decided to reject the lower one (GdA-1096, depth 26–27 cm), as it included mixed material, in contrary to pure Sphagnum branches selected form the level 21–22 cm.
3. Discussion
Both210Pb and14C dating methods have specific assumptions
and limitations, which influence the results of modelling. The age-depth relationship calculated using the CRS model is limited in resolution by the sample thickness (in our case 1 cm). Moreover, every age is calculated on the basis of the summed activity of underlying samples and the total core210Pb inventory. Therefore
the ages of two contiguous samples are interdependent. Conse-quently, the result of a single dating is described by a Gaussian dis-tribution of an age for a given depth, with a standard deviation of several years. The midpoint of each Gaussian distribution fall on an exponential-like curve. On the contrary, the results of14C dating
are independent from each other. The most problematic issue here is the presence of large wiggles in the calibration curve during the 19th century, which leads to multi-modal probability distributions covering wide time intervals. The incorporation of sample depths in Bayesian modelling results in a meaningful reduction of the
Table 1
Samples used for AMS radiocarbon dating, along with relevant information (composition, depth, calibrated age). The corresponding210Pb ages reported in (3) are also listed here for comparison. The date for depth 26.5 (marked with asterisk) was excluded from age modelling.
Lab No Depth (cm) Sample composition 14C age/Fraction modern 95.4% age interval (yr cal AD)
Midpoint (yr cal AD)
210Pb age (yr cal AD)
GdA-1112 6.5 ± 0.5 Sphagnum spp. stems 1.0689 ± 0.0032 2007.5 2005.5 2006.5 ± 1.0 1999.7 ± 2.2 GdA-1113 7.5 ± 0.5 Sphagnum spp. stems 1.0661 ± 0.0033 2004.3 2001.2 2002.8 ± 1.6 1998.7 ± 2.2 GdA-1115 9.5 ± 0.5 Sphagnum spp. stems 1.0855 ± 0.0034 2003.6 2000.5 2002.1 ± 1.6 1996.9 ± 2.2 GdA-1116 10.5 ± 0.5 Sphagnum spp. branches 1.0854 ± 0.0029 2002.0 1999.2 2000.6 ± 1.4 1995.8 ± 2.2 GdA-1117 11.5 ± 0.5 Sphagnum spp. branches 1.0833 ± 0.0032 2001.2 1998.4 1999.8 ± 1.4 1994.5 ± 2.2 GdA-1118 12.5 ± 0.5 Sphagnum spp. branches 1.0905 ± 0.0034 2000.3 1997.7 1999.0 ± 1.3 1992.7 ± 2.2 GdA-1314 17.5 ± 0.5 Sphagnum spp. branches and capitulum, Calluna vulgaris stems,
Erica tetralix inflorescence
1.4319 ± 0.0032 1999.3 1997.1 1998.2 ± 1.1 1980.3 ± 2.4
GdA-1087 21.5 ± 0.5 Sphagnum spp. branches 1.0987 ± 0.0033 1974.7 1972.9 1973.8 ± 0.9 1969.6 ± 2.6 GdA-1096* 26.5 ± 0.5 Sphagnum spp. stems, Erica tetralix inflorescence, betula catkin,
unidentified seeds*
1.4219 ± 0.0040* 1957.7 1957.2 1957.5 ± 0.3 1945.8 ± 2.8
GdA-1316 28.5 ± 0.5 Calluna vulgaris branches, Erica tetralix inflorescence, unidentified seed 40 ± 25 1958 1822 1890 ± 68 1928.2 ± 3.2 GdA-1317 31.5 ± 0.5 Sphagnum spp. stems, Calluna vulgaris branches, unidentified seeds 120 ± 30 1881 1801 1841 ± 40 1902.2 ± 3.8 GdA-1318 33.5 ± 0.5 Shagnum spp. capitulum, Erica tetralix inflorescence, Calluna vulgaris
branches, Andromeda polyfolia leave
250 ± 30 1802 1776 1789 ± 13 1869.6 ± 5.7
GdA-1097 34.5 ± 0.5 Sphagnum spp. branches and capitulum. Erica tetralix inflorescence 200 ± 30 1796 1736 1766 ± 30 1823.7 ± 8.1 GdA-1088 36.5 ± 0.5 Sphagnum spp. branches and capitulum, Calluna vulgaris branches, Erica
tetralix inflorescence, seeds
95 ± 25 1735 1685 1710 ± 25 Fig. 1.(A) Location of Słowin´skie Błota peat bog. (B) Simplified peatland
preser-vation indices based on stereoscopic aerial photographs[1]: 1/Sphagnum domi-nated vegetation; 2/Swamp vegetation with Sphagnum spp., Vaccinium uliginosum shrubs and small pine trees; 3/Various forests (pines, alder an other shrubs) on mineral or peaty soils; 4/Community of Calluna vulgaris on dry peat; 5/Recent anthropogenic vegetation (pastures, planted trees, etc.); 6/Drainage ditches.
uncertainties. However, in order to obtain a statistically relevant agreement within the sequence, it also requires the removal of one date (GdA-1096, depth 26–27 cm).
3.1. Comparison of models
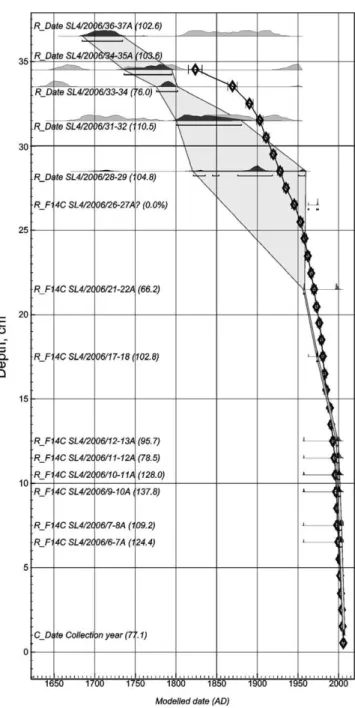
Fig. 2presents an attempt to compare the14C P_Sequence
age-depth model with the CRS210Pb model. In a first attempt, the most
probable approach in the construction of an age-depth model is to consider the hypothetical curves drawn through the midpoints of the probability distributions obtained after modelling (dark-grey-colored onFig. 2). For the depth until ca. 14 cm, both models are in very good agreement. In the deeper interval, a minor shift (sev-eral years, up to ca. 16 years between midpoints for the depth
17.5 cm) of14C model towards older ages is observed. This shift
seems however negligible compared to the discrepancy for the pre-bomb period (depth range 31–35 cm), where the difference be-tween midpoints reaches even 100 years towards older14C dates.
It should be noticed, that both models give similar sedimenta-tion rates averaged for the whole sequence, which are 0.125 and 0.121 cm/yr for the210Pb and14C model, respectively. As a
conse-quence, each centimeter grew between ca. 8.0 (210Pb) and 8.3 (14C)
years. For the interval above 22.5 cm the accumulation rates are 0.625 (210Pb) and 0.526 cm/yr (14C) (1.6 and 1.9 yr/cm) and for
the interval below 22.5 cm they are 0.0521 (210Pb) and 0.0515
(14C) cm/yr (19.2 and 19.4 yr/cm). Taking into consideration the
density reported in[4]the mean accumulation rate in grams per square centimeter per year can be calculated for the abovemen-tioned periods, which is ca. 12 g/(cm2year) for the upper part
and ca. 4 g/(cm2year) for the lower section.
3.2. Natural considerations
The large difference observed for the lower samples may have various reasons. Both14C and210Pb signals are integrated over a
considerable period of time. Moreover, they originate from differ-ent sources.210Pb is bound to aerosols and trapped by peat, while 14C is bound from atmospheric CO
2by photosynthesis. Hence, the 14C date gives the time of death of a plant whereas210Pb gives the
time span during which the aerosol has been buried, allowing sub-sequent210Pb decay. It has been demonstrated in several studies
that 210Pb is not subject to post-depositional mobilization in
ombrotrophic peat (e.g.[13,14]). On the other hand, the CO2can
be released during the decomposition of organic matter under oxic conditions and emanate to the upper sections. The age of this CO2
is greater than contemporary growing peat, thus it shifts the age of the living peat towards older time [15]. However, in the case of Słowin´skie Błota the emanation of CO2 seems unlikely due to
ombrotrophic character of the bog (i.e. acidic and anoxic). More-over, if ever occurring in our profile, this phenomenon should be much more pronounced for the post-bomb part of the data, which is not the case here.
3.3. Statistical considerations
Having assessed the natural causes of the discrepancies be-tween both models to be unlikely, care should be taken to the way the models are built. When the unmodelled probability distri-butions are taken into consideration, the inconsistency of both models may not be significant. Narrower ranges of probability dis-tributions were produced by statistical calculations, which were performed in such way that there is no information about210Pb
dating available. Above-mentioned wiggles in the14C calibration curve are responsible for wide ranges of probability distributions, i.e. up to 300 years. The P_Sequence model is only one way of deal-ing with such a set of dates, a common one at present[16–18]. The other approach could be the wiggle-matching of the sequence to the14C calibration curve[19]. However, the present dataset needs
to be improved in resolution to allow such calibration. Other age-modelling tools, which could be applied to present set of dating in-clude non-linear regression [20] or application of cubic splines with curvature calculations[21].
The coupled210Pb–14C model was applied for other studies for
the complete 1-m core presented here The upper part of complete model was based on210Pb data, while calibrated14C ages were
used from 34 cm downwards. The results plotted on this timescale are in good agreement with historical data and correlation with other palaeoenvironmental records[4,5].
Fig. 2.Comparison of probability distributions of calendar ages obtained for14C results (light grey for unmodelled probability distributions, dark grey for modelled ones) with 210Pb CRS model (black diamonds), plotted on the depth scale. Calibration performed with P_Sequence model (k = 1/cm). The date for depth 26.5 cm was excluded from age model, which results in overall agreement A = 95%.
4. Conclusions
The present study highlight some important issues connected with radiocarbon dating of peat sequences. Commonly known problems caused by wiggles in calibration curve for the period cov-ering the bottom part of Słowin´skie Błota peat core can almost cer-tainly be solved by the14C dating of more samples from thinner
slices. This study shows also, that the post-bomb calibration curve needs to be extended to the present time. It also highlights the great potential of Bayesian analysis applied in radiocarbon calibra-tion, which, however, should be applied with caution. The high suitability of coupled210Pb–14C dating applied to dating of
ombro-trophic peat bogs was also confirmed. Acknowledgements
We are grateful to Konrad Tudyka and Agnieszka Wiszniowska for their help with the14C sample preparation, and Arkadiusz Bulak
for his help with the210Pb preparation and measurements. We also
warmly thank Maarten Blaauw (Queens University, Belfast) for constructive comments on the age modelling. 14C dating were
granted by an individual support from the University of Liège (‘‘classic credit” to N. Fagel and CGRI Poland-Wallonia cooperation) and special grant (SPB) for EU-funded ATIS project (‘‘Absolute Time scales and Isotope Studies for investigating events in Earth and hu-man history”, MTKD-CT-2005-029642).
References
[1] M. Herbichowa, Ekologiczne studium rozwoju torfowisk wysokich włas´ciwych na przykładzie wybranych obiektów z s´rodkowej cze˛s´ci Pobrzeza Bałtyckiego, Wydawnictwo Uniwersytetu Gdan´skiego, Gdan´sk, 1998 (in Polish). [2] E.C.P. Wardenaar, A new handtool for cutting soil monoliths, Canadian Journal
of Soil Sciences 67 (1987) 405–407.
[3] M. Lamentowicz, K. Milecka, M. Gałka, A. Cedro, J. Pawlyta, Ł. Lamentowicz, N. Piotrowska, W. van dr Knaap, Climate- and human-induced hydrological change since AD 800 in an ombrotrophic mire in Pomerania (N Poland) tracked by testate amoebae, macro-fossils, pollen, and tree-rings of pine, Boreas 38 (2) (2009) 214–229.
[4] F. De Vleeschouwer, N. Piotrowska, J. Sikorski, J. Pawlyta, A. Cheburkin, G. Le Roux, M. Lamentowicz, N. Fagel, D. Mauquoy, Multiproxy evidences of Little Ice
Age palaeoenvironmental changes in a peat bog from northern Poland, The Holocene 19 (4) (2009) 625–637.
[5] F. De Vleeschouwer, N. Fagel, A. Cheburkin, A. Pazdur, J. Sikorski, N. Mattielli, V. Renson, B. Fialkiewicz, N. Piotrowska, G. Le Roux, Anthropogenic impacts in North Poland over the last 1300 years and possible influence of climate on human activities, Science of the Total Environment 407–421 (2009) 5674– 5684.
[6] P.G. Appleby, Chronostratigraphic techniques in recent sediments, in: Tracking Environmental Change Using Lake Sediments, Volume 1: Basin Analysis, Coring and Chronological Techniques, vol. 1, 2001, pp. 171–203.
[7] T. Goslar, J. Czernik, Sample preparation in the Gliwice Radiocarbon Laboratory for AMS14C dating of sediments, Geochronometria 18 (2000) 1–8.
[8] T. Goslar, J. Czernik, E. Goslar, Low-energy14C AMS in Poznan Radiocarbon Laboratory, Poland, Nuclear Instruments and Methods in Physics Research B 223–224 (2004) 5–11.
[9] P. Reimer et al., IntCal04 terrestrial radiocarbon age calibration, 0–26 cal kyr BP. Radiocarbon 46(3) (2004) 1029–1058.
[10] Q. Hua, M. Barbetti, Review of tropospheric bomb14C data for carbon cycle modeling and age calibration purposes, Radiocarbon 46 (3) (2004) 1273– 1298.
[11] C. Bronk Ramsey, Development of the radiocarbon calibration program OxCal, Radiocarbon 43(2A) (2001) 355–363.
[12] C. Bronk Ramsey, Deposition models for chronological records, Quaternary Science Reviews 27 (2008) 42–60.
[13] A.B. MacKenzie, J.G. Farmer, C.L. Sugden, Isotopic evidence of the relative retention and mobility of lead and radiocaesium in Scottish ombrotrophic peats, The Science of the Total Environment 203 (1997) 115–127.
[14] P.G. Appleby, W. Shotyk, A. Frankhauser, Lead-210 age dating of three peat coresin the Jura Mountais, Switzerland, Water, Air and Soil Pollution 100 (1997) 223–231.
[15] H. Jungner, E. Sonninen, G. Possnert, K. Tolonen, Use of bomb-produced14C to evaluate the amount of CO2 emanating from two peat bogs in Finland, Radiocarbon 37(2) (1995) 567–573.
[16] S.P.E. Blockley, C. Bronk Ramsey, C.S. Lane, A.F. Lotter, Improved age modelling approaches as exemplified by the revised chronology for the Central European varved lake Soppensee, Quaternary Science Reviews 27 (2008) 61–71. [17] S.P.E. Blockley, J.J. Lowe, J.C. Walker, A. Asioli, F. Trincardi, G.R. Coope, R.E.
Donahue, A.M. Pollard, Bayesian analysis of radiocarbon chronologies: examples from the European Late-glacial, Journal of Quaternary Science 19 (2) (2004) 159–175.
[18] N. Piotrowska, I. Hajdas, G. Bonani, Construction of the calendar timescale for Lake Wigry (NE Poland) sediments on the basis of radiocarbon dating, Radiocarbon 49(2) (2007) 1133–1143.
[19] M. Blaauw, G.B.M. Heuvelink, D. Mauquoy, J. van der Plicht, B. van Geel, A numerical approach to14C wiggle-match dating of organic deposits: best fits and confidence intervals, Quaternary Science Reviews 22 (2003) 1485–1500. [20] E. Heegaard, H.J.B. Birks, R.J. Telford, Relationships between calibrated ages and depth in stratigraphical sequences: an estimation procedure by mixed-effect regression, The Holocene 15 (2005) 612–618.
[21] A. Walanus, Drawing the optimal depth-age curve on the basis of calibrated radiocarbon dates, Geochronometria 31 (2008) 1–5.
![Fig. 1. (A) Location of Słowin´skie Błota peat bog. (B) Simplified peatland preser- preser-vation indices based on stereoscopic aerial photographs [1]: 1/Sphagnum domi-nated vegetation; 2/Swamp vegetation with Sphagnum spp., Vaccinium uliginosum shrubs an](https://thumb-eu.123doks.com/thumbv2/123doknet/3702254.110075/3.892.50.829.880.1169/simplified-stereoscopic-photographs-vegetation-vegetation-sphagnum-vaccinium-uliginosum.webp)