HAL Id: hal-01365230
https://hal.inria.fr/hal-01365230
Submitted on 13 Sep 2016
HAL is a multi-disciplinary open access
archive for the deposit and dissemination of
sci-entific research documents, whether they are
pub-lished or not. The documents may come from
teaching and research institutions in France or
abroad, or from public or private research centers.
L’archive ouverte pluridisciplinaire HAL, est
destinée au dépôt et à la diffusion de documents
scientifiques de niveau recherche, publiés ou non,
émanant des établissements d’enseignement et de
recherche français ou étrangers, des laboratoires
publics ou privés.
Enabling Green Energy awareness in Interactive Cloud
Application
Md Sabbir Hasan, Frederico Alvares de Oliveira, Thomas Ledoux, Jean-Louis
Pazat
To cite this version:
Md Sabbir Hasan, Frederico Alvares de Oliveira, Thomas Ledoux, Jean-Louis Pazat. Enabling Green
Energy awareness in Interactive Cloud Application. IEEE International Conference on Cloud
Com-puting Technology and Science 2016, Dec 2016, Luxembourg, Luxembourg. �hal-01365230�
Enabling Green Energy awareness in Interactive
Cloud Application
Md Sabbir Hasan, Frederico Alvares de Oliveira and Thomas Ledoux
ASCOLA Research Group EMN-INRIA, LINA Ecole des Mines de Nantes, France
Firstname.Lastname@inria.fr
Jean Louis Pazat
MYRIADS Research Group INSA, INRIA, IRISA
Rennes
jean-louis.pazat@irisa.fr
Abstract—With the proliferation of Cloud computing, data centers have to urgently face energy consumption issues. Al-though recent efforts such as the integration of renewable energy to data centers or energy efficient techniques in (virtual) machines contribute to the reduction of carbon footprint, creating green energy awareness around Interactive Cloud Applications by smartly using the presence of green energy has not been yet addressed. By awareness, we mean the inherited capability of Software-as-a-Service applications to dynamically adapt with the availability of green energy and to reduce energy consumption while green energy is scarce or absent. In this paper, we present two application controllers based on different metrics (e.g., availability of green energy, response time, user experience level). Based on extensive experiments with a real application benchmark and workloads in Grid’5000, results suggest that providers revenue can be increased as high as 64%, while 13% brown energy can be reduced without deprovisioning any physical or virtual resources at IaaS layer and 17 fold increment of performance can be guaranteed.
Index Terms—Cloud Computing; Renewable Energy; SaaS Application; Autonomic computing; User Experience.
I. INTRODUCTION
Twofold ways to reduce carbon footprint of data centers at an acceptable level have been proposed in the literature: (i) explicit or implicit integration of renewable energy to the data center to increase the ratio of green energy to the total energy while proposing Green energy-aware SLA for Cloud services [1] [2]; (ii) energy efficient techniques, that comprises server consolidation [3], hardware power efficiency, workload migration and software techniques for energy aware scheduling [4]. Although these efforts are necessary, the goal for alleviating carbon is far from the expectation.
Traditionally, data centers host heterogeneous applications, such as interactive and batch applications/jobs. In the latter, jobs arrive to the data center with deadlines, hence can be scheduled to different times by respecting the deadline when green energy is available [5]. On the contrary, interactive applications possess lesser flexibility, i.e., it should react with little to no latency, otherwise Quality of Service (QoS) can be seriously impacted. Since interactive applications cannot be scheduled in advance, green energy adaptivity can only be realized if the application inherits the capability to intelligently use the available green energy. Therefore, green energy aware-ness in interactive application can be seen as a complementary
approach to reduce carbon footprint by reducing brown energy consumption while greenness of the service can be increased. Green energy adaptivity in interactive cloud applications has not yet been addressed in existing research. Since societal and environmental concerns have been prompting green energy initiatives, it’s high time to consider greenness of energy metric as an essential attributes of traditional QoS. Service providers can propose greenness property as an extended scope to eco-friendly clients who are willing to accept degradation of user experience in the absence of green energy.
What makes adaptivity decision challenging? Renewable sources are known to be very intermittent in nature, thus providing green services or running servers and virtual ma-chines (VMs) only by green energy becomes very unrealistic. Furthermore, small enterprises and academic institutions rely heavily on on-site intermittent green energy production. From services point of view, response time and availability are the key metrics of interest for quantifying the performance and dependability of interactive Software-as-a-Service (SaaS) application. Making adaptive decision to stabilize a managed system based on a single metric e.g., response time, can avoid service saturation by increasing the responsiveness of the application but will neglect the quality of energy that is consumed by the system resources. Conversely, consider-ing greenness metric can affect the QoS properties, hence providers can lose profit by preventing users from access-ing the application. Therefore, formulataccess-ing strategies in the presence of green energy while respecting traditional QoS parameters and pushing dynamic efforts to reduce energy con-sumption in the absence of green energy are complementary measures to improve the energy efficiency as well as to reduce carbon offsets. In addition, SaaS provider may find her/himself constrained with respect to the amount of resources to be used due to a predefined budget or design constraints [6]. Therefore, providing dynamic reconfiguration capabilities of SaaS applications at runtime environment with respect to the aforementioned constraints while taking into account both performance and resource aware metrics leave no choice. As a result, devising new strategies that take both performance (response time, availability) and resource (quality of energy) aware metrics, is required.
green energy? Most of the popular cloud applications are well tailored to serve their clients with some extra features e.g., several product recommendation in an e-commerce applica-tion, which enhances user experience but is not the core func-tionality of the service. By identifying these independent but resource hungry software/application components which can be isolated to be activated/deactivated, could not only prevent transient behavior of an application in unpredictable runtime variations but also could reduce energy consumption when green energy is scarce. Therefore, by gradually increasing or decreasing user experience while attaining respectable perfor-mance is the only way to make interactive SaaS application adaptive to the presence of green energy.
Contributions. In this paper, we propose to create green energy awareness in interactive cloud application which can dynamically adapt with the presence of green energy. To do that, we propose a self adaptive SaaScaler architecture based on autonomic computing, which inherits the capability of sensing information as events from multiple layer as well as green energy information from Infrastructure-as-a-Service (IaaS) layer, while actions are performed only in application level in SaaS layer. Thus, our novel approach can make an interactive application green energy adaptive by automati-cally adjusting capacity requirements to changing conditions. Through extensive experiments and analysis with real applica-tion in real Cloud environment, smart usage of green energy is validated. Our proposed controllers can provide guarantees of keeping the managed systems 95th percentile response time nearby the target, while brown energy consumption can be reduced as high as 13% without deprovisioning any resources in infrastructure and revenue can be increased by a big margin of 64%. Moreover, our approach also adjusts the capacity requirement dynamically by releasing existing resources to allow 29% more users to access the SaaS application.
Assumptions. We assume to have static infrastructure which lacks elasticity in terms of automatically provisioning or deprovisioning computing resources on the fly, to validate how far SaaS layer can reduce energy consumption. On top of that,
we experimented with RUBiS1 (an eBay like auction site,
which is widely used for cloud benchmarking) application, which is assumed to be a representative of popular e-commerce and hence interactive web applications. Interference due to co-located application is not considered since we have focused on single application. Furthermore, two popular open source workload profile e.g., wikipedia and fifa are used for the experiment, that we believe to be modern traffic patterns for interactive cloud applications. Finally, only solar energy trace is used to validate the experiment, although this does not impact on our approach validation.
Outline. The rest of the paper is organized as follows. Section II describes the SaaScaler architecture and the Cloud application case study that is used throughout the paper. In Section III, two hybrid controllers intended to regulate performance, quality of energy and quality of experience are
1Rice University Bidding System. http://rubis.ow2.org.
Monitor - SaaS event - IaaS event Analyze Execution - Information extraction - Decouple events Configuration plan - Single metric - Multiple metric Knowledge - SLA parameters - Application state - Activate component - Deactivate component Sensors Actuators API calls SaaS Sensors IaaS SaaScaler
Fig. 1. Auto-scaler architecture
proposed. Section IV shows the extensive set of experiments that validates our approaches. Finally, Section V discusses the state-of-the-art and we conclude our work in Section VI.
II. SAASCALER ARCHITECTURE
Autonomic computing has exhibited sheer promise for the ability to evolve a system to be self adaptive by constantly sensing the system properties and tuning their performance and/or configurable parameters. We use the most popular self-adaptive design framework: Monitor-Analyze-Plan-Execute-Knowledge (MAPE-K) loop [7] for our scaler. Our auto-scaler named as SaaScaler continuously listens the instances of events i.e., response time, green energy availability, working modes etc. pushed by SaaS and IaaS as shown in Figure 1 in a changing environment. Based on the received monitoring data of events, we decouple multiple events to extract pertinent information of the system behavior. Depending on the listened events, if needed, SaaScaler will take adaptation decision accordingly and will execute actions to SaaS application via API calls in response to the deviation from the target system state e.g., response time set point, consume less energy, etc.
Along with different performance and resource aware met-rics, we propose three user experience levels. Mode 2 refers to high user experience while Mode 1 and Mode 0 indicate to medium and low user experience respectively. When current application behavior deviates from target system state in terms of objective metrics, the auto-scaler gracefully downgrade the user experience from higher mode to lower mode and vice-versa. Usually popular e-commerce applications provide multiple recommendations to the users when they arrive or navigate to the site. So, the standard or nominal state of an application should be providing multiple recommendations to users e.g., User-to-User type, Item-to-Item type [8]. In our case that is referred as Mode 2. During the high variability of workload or scarcity of green energy availability or resource capacity, we switch the application to one or zero recommen-dation to achieve the objective. All phases we mentioned here is supported by additional knowledge where it stores target system state and current application working mode.
Several experiments were done in Taurus cluster at the Lyon
site of Grid’50002. Figure 2(a) shows that the difference of
2A large-scale and versatile test bed for experiment-driven research.
80 160 240
0 25 50 75 100
Power consumption (watts)
Load (%)
(a) Dynamic range in Power consumption
Dynamic Power Static Power 100 150 200 4 8 12 16 20
Power consumption (watts)
Time (hours)
(b) Different UX level power consumption Low UX
High UX
Fig. 2. Power consumption analysis
power consumption between an idle and a full loaded server is around 125 watts which implies an idle server consumes around 43.18% of total power while running at full load. Therefore, by manipulating resource hungry components in an application, the power savings could be very minimal for shorter period of time. In contrast, we tested an extended version of RUBiS application in an aforementioned experi-mental setup providing low (no recommendation) and high user experience (multiple recommendations) and measured power consumption over time, as shown in Figure 2(b). The difference in energy consumption was on average 514.23 watts after 24 hours, which corresponds to virtually turning off 6 idle servers for an hour approximately. Therefore, in spite of the little amount energy that can be punctually saved while providing low user experience, satisfactory amount of energy can be saved for a long running service by applying dynamic adaptation in an application.
III. CONTROLLERS DESIGN
It is straightforward that systems performance (i.e., response time) is the foremost criteria for mission critical interac-tive Cloud applications. Thus, keeping this constraint while achieving multiple goals (i.e., green energy usage, quality of experience, availability etc.) at the same time is necessary. To this, we design two hybrid controllers using feedback and nested control loop architecture. This section describes their characteristics, working principles, analysis and validation. A. Green Energy aware hybrid controller
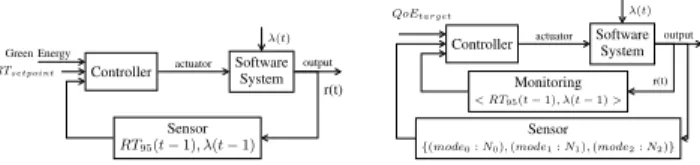
Depending only on green energy production without having any performance aware feedback from the system will degrade reasonable QoS while workload arrival is high. To this, we design a controller for considering both performance and resource aware metrics that envisages applications internal and green energy production shown in Figure 3(a). We distinguish
between two control periods: long and short. Since green
energy production does not abruptly change in shorter period of time, the controller activates higher or lower user experience mode based on the energy information pushed by IaaS in longer control period i.e., 15 minutes. Some sources of energy are only available during certain times. For instance, solar energy is available during the day and the amount produced depends on the weather and the season [9]. Due to the inter-mittency, we have divided the total green energy production to three different regions i.e., no green energy (at night), few (early morning and late afternoon) and adequate (mid-day). To distinguish between the regions we choose a static
Algorithm 1: Green energy aware hybrid controller
Input: T hrmax, T hrrt, λ = [0 0 0 0], setP oint, app, CurrGE
Output: reconfiguration plan for the application, λ, Currmode
1 /* Initiates in longer control period */;
2 if (handleEvent == greenEnergy) then
3 if CurrGE== 0 then
4 app.mode ← mode 0;
5 else if CurrGE> T hrmaxthen
6 app.mode ← mode 2;
7 else
8 app.mode ← mode 1 ;
9 Currmode= app.mode ;
10 return Currmode
11 /* Initiates in shorter control period */;
12 if (handleEvent == responseT ime) then
13 λ(t − 1) ← servedRequest ;
14 enqueue(λ) ;
15 f unction ← 1 − (λ(t − 1)/λmedian) ∗ (RT95/setP oint)
16 if (f unction > T hrrt) and (Currmode6= 0) then
17 ;
18 app.mode ← Currmode− 1;
19 else
20 app.mode ← Currmode;
21 this app.mode = update(Currmode);
22 dequeue(λ) ;
23 return λ, Currmode
threshold T hrmax, above which controller activates high user
experience mode (mode 2). When green energy production
falls between 0 and T hrmax, controller chooses an actuator
value that triggers medium user experience mode (mode 1), and in case of EnergyP roduction == 0, mode 0 is activated. In contrast, the controller checks response time periodically in shorter control interval since response time is an essential metric to guarantee performance of cloud based services (see 12-21 line of Algorithm 1). We closed the managed software system by a feedback loop, where in each control period, output is forwarded as a Map of response time and workload arrival rate to compare with the target set-point, as showed in Figure 3(a). This feedback part of the controller is activated in shorter control period i.e., 5 minutes to identify overloaded condition in the system. In detail, we measure 95th percentile response time since it provides better approximation of entire distribution than average response time. Afterwards,
the information is forwarded to compute a function; Err(t) =
1 − ˜λ(t) ∗ ˜r(t) where ˜λ(t) =λλ(t−1)
median and ˜r(t) =
RT95(t−1)
RTsetpoint.
In Cloud environments, unpredictability and burstiness of user requests is common phenomena, if not realized by the system or predicted in advance, can dramatically degrade application performance. Therefore, workload arrival rate acts as a disturbance (λ(t)) to the system. For capturing the change in the arrival rate, current arrival rate in the system is divided by median of previous arrival rates. A queue is used with window size of four, that provides better estimation about variability of the workload arrival rate. The idea is to keep
Err(t) function greater than zero to stabilize the system to
Controller SoftwareSystem Sensor RT95(t − 1), λ(t − 1) actuator output r(t) RTsetpoint λ(t)
Green Energy Controller
Software System Monitoring < RT95(t − 1), λ(t − 1) >
Sensor
{(mode0: N0), (mode1: N1), (mode2: N2)} actuator output
r(t) λ(t) QoEtarget
Fig. 3. Green Aware (a) and QoE Aware (b) hybrid controllers. to be less than zero, the controller downgrades the user experience by subtracting 1 from previous control period’s decision value (see 13-21 in Algorithm 1); as a result it ensures responsiveness of the application. Therefore, in variable load condition, actuator’s value must be controlled in a way to satisfy ˜λ(t ) ∗ ˜r (t ) < 1 . To outline, the controller is designed to consume more energy in the period of abundant green energy by following the green energy curve. On the other hand, response time part only takes decision if the 95th percentile response time of last control period was above the set point. B. QoE aware hybrid controller
SaaS provider can have different quantifiable non-functional goals in web based interactive applications i.e., quality of the contents, tracking user’s navigational activity report or personalized recommendation, etc. These goals can be quan-titatively expressed by SaaS provider by defining and im-plementing the possible strategy in a application controller. Moreover, by increasing users experience, SaaS provider can generate higher revenue [10]. From SaaS provider’s viewpoint, it becomes critical requirement in modern services and can introduce new class of Service level objective (SLO). For example, an e-commerce service could have a goal - ”Serve Recommendation” stating ”SingleRecommendation(x%)” and ”MultipleRecommendation(y% of x%)” of total request in a SLA. To satisfy the goal, we close the feedback loop with sensing the information as a map of how many requests were served with different modes in last control period. Based on the information, the controller computes the current percentage of recommendations provided by the system and choose actuator value accordingly, which is showed in Algorithm 2 (line 3-19). Without considering systems performance, quality of ex-perience can not be augmented since the foremost criteria of a cloud based interactive application is to be functional and responsive even in extreme conditions e.g., unexpected workload peaks, heavy workload in big duration etc. To achieve this goal, we close the system in a nested loop manner, as showed in Figure 3(b). The outer loop provide feedback of number of request served in different modes in last control period. Whereas, the inner loop checks the 95th percentile response time and workload changes in a shorter control period to provide faster system dynamics in terms of avoiding overloaded condition. Therefore, in every big control interval, decision is taken based on the current recommendation/optional content percentage to the targeted SLA. If it is lower than the target, higher user experience mode is activated, otherwise not, which is presented in Algorithm 2. Moreover, the inner loop downgrades user experience to the lower mode if the response time arise above the set point, if
Algorithm 2: QoE aware controller
Input: Map M, T hr1, T hr2, Dist1← 0, Dist2← 0, app, λ
Output: reconfiguration plan for the application, T otalP er1,
T otalP er2, λ, Currmode
1 /* Initiates in longer control period */;
2 if (handleEvent == QoE) then
3 CurP er1= Reqmode1/T otalreq;
4 CurP er2= Reqmode2/T otalreq;
5 update(T otalP er1, T otalP er2) ;
6 Dist1← T hr1− T otalP er1;
7 Dist2← T hr2− T otalP er2;
8 if T otalP er1> T hr1and T otalP er2< T hr2 then
9 app.mode ← mode 2;
10 else if T otalP er1< T hr1and T otalP er2> T hr2 then
11 app.mode ← mode 1;
12 else if T otalP er1< T hr1and T otalP er2< T hr2 then
13 if Dist1< Dist2then
14 app.mode ← mode 2 ;
15 else
16 app.mode ← mode 1 ;
17 else
18 app.mode ← mode 0 ;
19 Currmode= app.mode ;
20 return T otalP er1,T otalP er2,Currmode
21 /* Initiates in shorter control period */;
22 if (handleEvent == responseT ime) then
23 Similar to Algorithm1
24 return λ, Currmode
not, it periodically checks the response time without taking any decision.
IV. EVALUATION
In this section, we present the evaluation results of the controllers described in Section III and their impact on a real Cloud based application in terms of response time, quality of user experience and energy consumption. The goal is to advocate the benefits and limitations of each controller while experimenting them under real workload traces.
A. Experimental setup
1) Infrastructure configuration: The experiments were
con-ducted in Grid’5000 Lyon site, with 2 physical machines linked by a 10 Gbit/s Ethernet switch and connected to wattmeter. Each machine has two 2.3GHz Xeon processors (6 cores per CPU) and 16GB of RAM, running Linux 2.6. Openstack Grizzly 1.0.0 was used as platform, which requires one dedicated physical machine, for the cloud controller man-agement system. Consequently, the second physical machine was used as compute node to host VMs, which in turn, are pre-configured to run Ubuntu 12.04.
2) Application configuration: In Brownout [11], authors
provided a user-to-user recommendation engine which can enhance user experience. Along with that, we implemented a fairly simple item-to-item recommendation, to offer better user experience. The simple recommendation engine can be sum-marized as ” Retrieve 5 products from same seller and same product category which has higher or same user bid count with
high customer rating”. Although, both the recommendation engines lack the sophistication and worldly complexities, they do serve as a reasonable example of providing user experience that a cloud application can isolate from core functionality to activate or deactivate at runtime. The recommendation is added to the item visualisation page and to enable it, we defined a function that reads a file, where actuator value is updated in each control period and execute the associated modes for each user request. For instance, Mode 1 activates the codes of recommendation one, mode 2 activates both recommendations and mode 0 provides no recommendation. Furthermore, the extended RUBiS application was deployed in SaaS fashion and architecturally organized in 3 tiers: load balancer, web and database (db) tier. Our compute node is consist of one VM having Nginx load balancer, which distributes the request across three VM of Nginx application server, each having 1 cpu core and 2GB of memory and a single VM of MySQL db server of 8 cpu core and 16GB memory.
3) Auto-Scaler: Our auto-scaling solution is hosted inside
the Cloud controller machine. It monitors the 95th percentile response time and associated mode of requests by aggregating the Nginx log of load balancer in each control period (longer and shorter control periods are 60s and 20s respectively), whereas green energy information is pushed by the infras-tructure through an API. The knowledge component of the MAPE-K control loop contains the target response time and SLA parameters. Based on all the aggregated data and decision metrics, auto-scaler triggers the appropriate actuator value and overwrite the file, which reside in web tier VMs via an API.
4) Workload traces: We took the real trace of wikipedia
german page of one day and fifa98 over one and half months [12] and scaled the data set to fit with our experiment, which is showed in Figure 4. While the wikipedia trace has a steady and incremental pattern of requests over time, fifa trace possesses
some heavy temporal spikes. We relied on Gatling3 as a
load injector to generate our desired workload. To generate the workload, we choose an open system model, where user request is issued without waiting for other users response from the system. Furthermore, we emulated read-only workload where each user arrives to the homepage, browse any item category from a vast catalog, click on a product to extract its information, view seller rating and his/her reputation related to the product. We have kept request timeout to 32s. We traced the solar energy production that was added to the grid for
one day (12th April,2016) from EDF, France4 and scaled the
values suited for our experiment. Furthermore, the duration of each experiment was 96min and each was run several times. We considered 96min as 24 hours, i.e., each 4min in our experiments correspond to 1 hour.
B. Results
1) Response time: We compare our hybrid controllers with
a traditional non-adaptive approach which lacks capability of
3http://gatling.io/ 4http://www.rte-france.com/fr/eco2mix/eco2mix 0 250 500 750 1000 96 Number of requests Time (minutes) wikipedia 0 250 500 750 1000 96 Number of requests Time (minutes) fifa 0 55 110 165 220 0 96
green energy (watts)
Time (minutes) green energy
Fig. 4. Workload trace
reconfiguration, which is considered as a baseline. The charts on top of Figures 5(a) and 5(b) show the average response time grouped by minute caused by green and hybrid-qoe controller for wikipedia and fifa workload respectively. During 60-62min in the experiment (see Figure 5(a)), response time stayed around 2.5s on average for hybrid-green controller and overall 6000 requests failed out of 1.7 million requests which were injected. For hybrid-qoe controller, response time was above 2s (on average 5-7s) at the time of 73rd and 74th min, causing more requests failed by hybrid-qoe controller in that region, which accounts 7500 on average. The result indicates that, both controllers ensure 99.99% availability of service. On the other hand, 29% requests were failed and almost half of the requests faced very high response time i.e., beyond 2s for adaptive approach. While the non-adaptive approach performed poorly by retaining the 95th percentile response time around 30s, hybrid-green controller provided better stability to the system by keeping it around 1.76s(see Figure 5(c)), that is 17 fold reduction of response time. Moreover, hybrid-qoe controller performs similarly by keeping 95th percentile response time to around 1.93s.
For fifa workload, both the controller foster better perfor-mance by keeping 95th percentile response time in the range of .76-1.04s. During 73rd and 74th min, average response time for hybrid-green controller arose to 6s, causing failure of 5000 requests on average due to very high peak. Compared to former controller, 1700 requests failed on average for hybrid-qoe controller, which is showed in Figure 5(b). Nevertheless, both the controllers can satisfy high availability of service.
2) Quality of experience: To validate our result, we set a
goal of providing recommendation to 80% requests among all the user arrives in the system and multiple recommendations atleast 30% of the time, out of the 80% request. Since non-adaptive approach is always activated with multiple recom-mendations, all the successful requests were provided with multiple recommendations, e.g., 71% of the request. However, serving a request with multiple recommendations and having very high response time i.e.,16s, is not going to enhance a users experience with the service. Figure 6(a) shows that, hybrid-qoe controller can attain around 76.18% SLA while keeping number of failed requests below 1%. Although the target is missed by 3-4%, the system can accept more requests with reduced response time, providing better performance that can increase profit for service provider. Since hybrid-green controller is not designed to achieve targeted SLA, we wanted to validate, how far this controller can attain SLA. Figure 6(a) indicates that, on average it can reach 68.82% irrespective to
0 0.5 1 1.5 2 0 16 32 48 64 80 96
Avg. res. time (sec)
Time (minutes) Hyb-green Hyb-qoe NA 0 2500 5000 7500 10000 0 16 32 48 64 80 96
Total failed request
Time (minutes) Hyb-green
Hyb-qoe NA
(a) Response time and number of failed requests for wikipedia workload 0 0.5 1 1.5 2 0 16 32 48 64 80 96
Avg. res. time (sec)
Time (minutes) Hyb-green Hyb-qoe NA 0 1500 3000 4500 0 16 32 48 64 80 96
Total failed request
Time (minutes) Hyb-green
Hyb-qoe NA
(b) Response time and number of failed requests for fifa workload 25% 50% 75% 95% 0 0.5 1 1.5 2 Cumulative fraction
Response Time (seconds) For wikipedia workload
Hyb-green Hyb-qoe NA 25% 50% 75% 95% 0 0.5 1 1.5 2 Cumulative fraction
Response Time (seconds) For fifa workload
Hyb-green Hyb-qoe NA
(c) Response time in percentiles
Fig. 5. Hybrid controller’s performance any goal. As this controller only provides recommendation
when green energy is available, it cannot satisfy the goal of providing 80% recommendation if the user requests is low in the green energy availability period. For wikipedia workload, relatively higher user request region belongs to the green energy period which is mid-day to late afternoon.
For the like of fifa workload, where temporal peaks appears in regular intervals, hybrid-qoe controller performs even better by providing 79.27% recommendations on average. Adding the response time as an inner loop in the controller helped to detect the workload peaks, as a result gradient of accepted and successful requests were higher. In contrast, hybrid-green controller can maximize of providing recommendations only if the workload is moderate to high in the available green energy period. Since the workload is not constantly high in that region, hybrid-green controller was able to provide only 53.21% recommendation.
3) Energy Consumption: In our experiment, each 4min
were considered as an hour, thus we calculated the energy consumption of 24 hours, impacted by each controller (cf. Table I). Each experiment was run several times and we found the energy consumption difference between each run was 1∼2 watts. As Table I suggests, Hybrid-green controller
0 20 40 60 80 100 16 32 48 64 80 96 Recommendation (%) Time (minutes) (a) For wikipedia workload
Hyb-green Hyb-qoe 0 20 40 60 80 100 16 32 48 64 80 96 Recommendation (%) Time (minutes) (b) For fifa workload
Hyb-green Hyb-qoe
Fig. 6. SLA validation for hybrid controller’s
reduces brown energy consumption by 9.02% and 13.48% for wikipedia and fifa workload respectively compared to non-adaptive approach. Although hybrid-qoe controller lacks the capability to exploit energy information for decision making, for wikipedia and fifa workload, it reduced only 1.28% and 7.42% of brown energy consumption accordingly. Hence, the result is a clear indication that green energy awareness in interactive application can act as a complementary approach to reduce carbon footprint by reducing brown energy without releasing resources in IaaS level.
Similarly, Table I shows that green energy consumption was lower for both hybrid controllers, since system resources were not wasted for ”rotten” requests [13] like in the non-adaptive approach. To further investigate, we propose an en-ergy consumption metric called Average Enen-ergy Consumption per Request (AECpR), which is defined as the ratio of total energy consumption over total successful requests been served. Following are the summerized result: i) For wikipedia work-load, hybrid-green and hybrid-qoe controller reduce 32.63% and 29.37% energy consumption per request compared to non-adaptive approach. ii) For fifa workload, hybrid-green and hybrid-qoe controller reduce 10.60% and 6.12% energy consumption per request compared to non-adaptive approach.
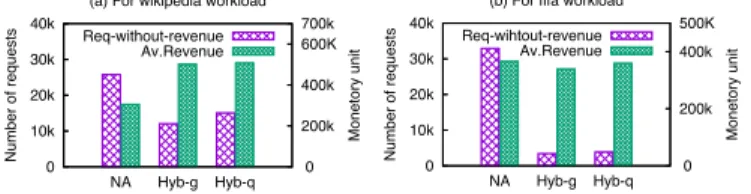
4) Cost analysis: As discussed before, the requests which
have been served with recommendations but have failed to keep response time under 2s might not satisfy customers, e.g., customers may leave before getting the response from the system. Thus, we followed [10] the study and breakdown the monetary units to calculate provider’s revenue. Each served re-quest without recommendation corresponds to 1 monetary unit, with 1 recommendation to .25 unit, with 2 recommendations to .5 unit only if those requests were served below 2s response time and deducted 1 unit for failed requests. Figure 7(a) shows that, for wikipedia type workload, green and hyb-qoe controller can increase revenue by a big margin of 64% and 66.2% respectively compared to non-adaptive approach,
TABLE I
ENERGY CONSUMPTION RESULTS(WH)
Controller’s name Wikipedia workload Fifa workload
Green E.C. Brown E.C Total E.C. B.E.Reduction Green E.C. Brown E.C Total E.C. B.E.Reduction
Non-adaptive 1484.54 1934.66 3424.20 – 1446.01 1941.32 3387.33 –
Hybrid-green 1510.11 1760.09 3270.20 9.02% 1400.34 1679.53 3079.87 13.48%
Hybrid-qoe 1497.64 1909.75 3407.39 1.28% 1380.36 1797.14 3177.50 7.42%
whereas number of requests that failed to make an impact in revenue decreased by 53.09% and 41.44%. In contrast, non-adaptive approach can generate more revenue by 7.47% and 1.7% for fifa like workload (see Figure 7(b)), but hyb-green and hyb-qoe controller can reduce revenue less requests by 89.5% and 88.16%. Although, non-adaptive approach can provoke to believe of having higher revenue, the requests which were dropped and faced very high response time may degrade the reputation of the service provider. As a result, gradient of revenue will decline for saturating the application in the high workload period.
C. Discussion
After extensively analyzing the controllers, it is evident that they can outperform the traditional non-adaptive approach in terms of energy consumption, performance, availability and revenue. The reason behind designing two hybrid controllers is to provide insights and flexibilities to SaaS provider to choose any of them depending on their goal. As example, the SaaS provider can take advantage of hybrid-green controller to propose new class of SLA to eco-friendly customer who are willing to involve in reducing energy consumption. On the other hand, the hybrid-qoe controller can enhance user experience in higher percentage while keeping energy con-sumption at lower level than traditional non-adaptive approach. The overhead of the hybrid controllers are very low to none since the controllers are deployed in Openstack controller node which does not interfere with application in terms of performance. Furthermore, hybrid-green controller can reduce brown energy consumption in the range of 9∼13% depending on the workload variation without even removing or adding additional resources while energy efficient technique is applied in infrastructure. Clearly, this amount of energy reduction on top of energy efficient infrastructure can reduce a big amount of energy from global point of view. But, only allowing adaptation in SaaS layer would not be realistic if the workload is constantly very high when resource requirement exceeds the capacity of static infrastructure. Hence, elastic infrastructure is necessary and can also adapt with the availability of green energy and capacity requirement of an application. Moreover,
10k 20k 30k 40k 0 NA Hyb-g Hyb-q 200k 400k 600K 700k 0 Number of requests Monetory unit
(a) For wikipedia workload Req-without-revenue Av.Revenue 10k 20k 30k 40k 0 NA Hyb-g Hyb-q 200k 400k 500K 0 Number of requests Monetory unit
(b) For fifa workload Req-wihtout-revenue
Av.Revenue
Fig. 7. Revenue analysis incurred by all controllers
to adapt an application with the controllers, software engineers need minimal effort to identify the optional components which are loosely coupled and easily separable to activate or deacti-vate at runtime, rather developing the traditional applications from scratch. Furthermore, any green energy profile i.e., wind, hydro etc. profile can be incorporated although we have validated our results with solar energy profile. To summarize, our approach involves guaranteeing core functionality of a service without hampering traditional QoS properties and the impact on energy reduction in the absence of green energy.
V. RELATED WORK
a) Smart usage of energy : The increasing enthusiasm
and consciousness of reducing energy consumption lead to smarter ways to consume energy in Cloud data centers. Goiri et al. [9] proposed GreenHadoop, a data processing framework for opportunistically using green energy in real data center while reducing energy costs by decreasing the usage of grid-tied brown energy. Later, they propose an adaptation technique for interactive services [5], that emphasis on operating few hadoop clusters when green energy is scarce. Indeed, the concept is to minimize energy consumption by auto-tuning in resource level i.e., PM’s, VM’s etc, not in application’s internal component level. Thus, the detail and complexity of smartly adapting interactive SaaS applications are completely missing from literature. Later Dupont et al. [14] proposed a realization of adaptivity through the concept of working modes which allows to run an application under various performance levels. The higher mode depicts of serving contents from multiple data centers, whereas in lower modes contents are being served by a single data center. Although all the aforementioned research work have opened the issue of smartly using energy in Cloud services for batch processing jobs, the subtlety and sophisticated approach required to grasp multiple synchronous and asynchronous events associated to real interactive SaaS applications under volatile presence of green energy was never taken into account.
b) Capability of reconfigurable SaaS application : The
notion of degradation in online services was first introduced in [15] , which depicts dynamic content adaptation by using classical feedback control theory. The degradation was realized by data filtering and compression of images in online services by following resource utilization. Similar to this, authors in [16] adopted service differentiation a.k.a. degradation of performance by keeping CPU utilization under a targeted threshold. However, these approaches require prior knowledge of the platform, offline performance modeling and building
Cloud applications from scratch. Harmony framework [17] was proposed to reduce probability of stale reads in Cloud storage by tuning the consistency level at runtime in a self-adaptive manner. However, this approach is data oriented. Recently, Klein et al [11] introduced Brownout paradigm for dynamic adaptation in SaaS application through con-trol theory to withstand in unpredictable runtime variations. Content reconfiguration takes into account only the system response time so that to prevent system instability in sudden workload burstiness. While the novelty of the approach is well understood, how the controller should be designed and implemented in massively virtualized Cloud environment has not been addressed. In n-tier applications, the bottleneck for system performance could be different in each tier that could affect overall service time for different workload profile. Later Dupont et al. [18] proposed a multi-level elasticity framework based on autonomic computing to improve the system per-formance by providing tactics associated to each layer and coordinating them by a local controller. Although the work tackled adaptation of SaaS application under various criterion, energy aware adaptation is still missing from current literature. We envision that existing popular Cloud applications could be reconfigurable at runtime as discussed in [11], by considering different events to reduce brown energy.
c) Green energy metric along with QoS: In [19], Klingert
et al. proposed green energy awareness as a criteria to be enforced along with traditional QoS parameters in SLA to customers, which is presented as GreenSLA. They identified known software and hardware techniques and how applications can be specified for these techniques. Although GreenSLA specification was well understood, how to satisfy this SLA in real Cloud environment was never discussed. Later, Haque et al. [20] considered an SLA that specifies the proportion of green power to run submitted tasks by SaaS or PaaS provider, while IaaS provider should satisfy the percentage of green. Since, they have considered separate clusters plugged with green and brown energy, this approach requires extensive number of migrations of VM’s around a data center to satisfy energy proportionality. To overcome this problem, in prior work, we introduced virtualization of green energy [2] from IaaS providers point of view, which can satisfy green energy proportionality to SaaS or PaaS provider in resource level (e.g., VM’s and PM’s). In addition, our current work proposes new strategies that take both performance and resource aware met-rics for creating green energy awareness around an interactive SaaS application.
VI. CONCLUSION
This paper proposes a novel self-adaptive approach for creating green energy awareness in interactive Cloud appli-cations. It consists of a Green SaaScaler whose objective is to adapt SaaS internals according to the presence of green energy as well as other criteria of QoS and QoE. Our approach implements several feedback control loops intended to keep one or many of those criteria under control. We validated the controllers with an extended version of RUBiS, an eBay-like
web application benchmark, under real world workloads; and OpenStack, as Cloud Infrastructure Management tool. Results have shown the proposed SaaScaler is able not only to reduce energy consumption when there is no green energy available, but also to keep quality criteria at an acceptable level. For future work, we plan to take into consideration energy-aware adaptive strategies in the infrastructure IaaS layer such as server consolidation and/or DVFS. We believe that this is an interesting point to address as it may require several strategies in different levels to be executed in a coordinated manner.
REFERENCES
[1] W. Deng, F. Liu, H. Jin, C. Wu, and X. Liu, “Multigreen: Cost-minimizing multi-source datacenter power supply with online control,”
in Proc. of the 4th Int. Conf. on Future Energy Systems. ACM, 2013.
[2] S. Hasan, Y. Kouki, T. Ledoux, and J. Pazat, “Exploiting renewable sources : when green sla becomes a possible reality in cloud computing.” IEEE Transactions on Cloud Computing, vol. PP, no. 99, pp. 1–1, 2015. [3] A. Beloglazov, J. Abawajy, and R. Buyya, “Energy-aware resource allocation heuristics for efficient management of data centers for cloud computing,” Future Gener. Comput. Syst., vol. 28, no. 5, May 2012. [4] A. Verma, P. Ahuja, and A. Neogi, “pmapper: Power and migration cost
aware application placement in virtualized systems,” in Proc. of the 9th
ACM/IFIP/USENIX Int. Conf. on Middleware. Springer-Verlag, 2008.
[5] I. n. Goiri, W. Katsak, K. Le, T. D. Nguyen, and R. Bianchini, “Parasol and greenswitch: Managing datacenters powered by renewable energy,”
in Proc. of the 18th Int. Conf. ASPLOS. ACM, Mar. 2013.
[6] A. H. Mahmud, Y. He, and S. Ren, “Bats: Budget-constrained au-toscaling for cloud performance optimization,” in ACM Int. Conf. on
Measurement and Modeling of Computer Systems. ACM, 2014.
[7] J. O. Kephart and D. M. Chess, “The vision of autonomic computing,” Computer, vol. 36, no. 1, pp. 41–50, Jan 2003.
[8] J. A. Konstan and J. Riedl., “Recommended to you,” IEEE Spectrum, Octobre 2012.
[9] I. n. Goiri, K. Le, T. D. Nguyen, J. Guitart, J. Torres, and R. Bian-chini, “Greenhadoop: Leveraging green energy in data-processing frame-works,” in Proc. of the 7th ACM European Conf. on Comp. Syst., 2012. [10] D. Fleder, K. Hosanagar, and A. Buja, “Recommender systems and their effects on consumers: The fragmentation debate,” in Proc. of the 11th
ACM Conf. on Electronic Commerce. ACM, 2010.
[11] C. Klein, M. Maggio, K.-E. ˚Arz´en, and F. Hern´andez-Rodriguez,
“Brownout: Building more robust cloud applications,” in Proc. of the
36th Int. Conf. on Software Engineering. ACM, 2014.
[12] S. Farokhi, P. Jamshidi, D. Lucanin, and I. Brandic, “Performance-based vertical memory elasticity,” in IEEE Int. Conf. on Autonomic Comp, 2015.
[13] C. Klein, M. Maggio, K.-E. ˚Arz´en, and F. Hern´andez-Rodriguez,
“Im-proving cloud service resilience using brownout-aware load-balancing,” in Proc. of 33rd Int Symp on Reliable Distributed Systems. IEEE, 2014. [14] C. Dupont, M. Sheikhalishahi, F. M. Facca, and F. Hermenier, “An energy aware application controller for optimizing renewable energy consumption in cloud computing data centres,” in 8th IEEE/ACM Int. Conf. on Utility and Cloud Computing, Limassol, Cyprus, 2015. [15] T. F. Abdelzaher and N. Bhatti, “Web content adaptation to improve
server overload behavior,” in Proc. of the 8th Int. Conf. on World Wide Web, New York, USA, 1999.
[16] J. Philippe, N. De Palma, F. Boyer, and e. O. Gruber, “Self-adaptation of service level in distributed systems,” Softw. Pract. Exper., vol. 40, no. 3, pp. 259–283, Mar. 2010.
[17] H.-E. Chihoub, S. Ibrahim, G. Antoniu, and M. P´erez, “Harmony: Towards Automated Self-Adaptive Consistency in Cloud Storage,” in
IEEE Int. Conf. on Cluster Computing. IEEE, Sep. 2012.
[18] S. Dupont, J. Lejeune, F. Alvares, and T. Ledoux, “Experimental analysis on autonomic strategies for cloud elasticity,” in Int. Conf. on Cloud and Autonomic Computing, Sept 2015.
[19] C. Atkinson, T. Schulze, and S. Klingert, “Facilitating greener it through green specifications,” IEEE Software, vol. 31, no. 3, May 2014. [20] M. E. Haque, K. Le, . Goiri, R. Bianchini, and T. D. Nguyen, “Providing
green slas in high performance computing clouds,” in Int. Green Computing Conference (IGCC), June 2013.