HAL Id: hal-01918941
https://hal.archives-ouvertes.fr/hal-01918941
Submitted on 18 Aug 2020HAL is a multi-disciplinary open access
archive for the deposit and dissemination of sci-entific research documents, whether they are pub-lished or not. The documents may come from teaching and research institutions in France or abroad, or from public or private research centers.
L’archive ouverte pluridisciplinaire HAL, est destinée au dépôt et à la diffusion de documents scientifiques de niveau recherche, publiés ou non, émanant des établissements d’enseignement et de recherche français ou étrangers, des laboratoires publics ou privés.
Validation of a French adaptation of the
Multidimensional Student’s Life Satisfaction Scale in its
abbreviated form, for 5- to 11-year-old children with and
without intellectual disability
Charlotte Coudronnière, Fabien Bacro, Philippe Guimard, Jean-Baptiste
Muller
To cite this version:
Charlotte Coudronnière, Fabien Bacro, Philippe Guimard, Jean-Baptiste Muller. Validation of a French adaptation of the Multidimensional Student’s Life Satisfaction Scale in its abbreviated form, for 5- to 11-year-old children with and without intellectual disability. Journal of Intellectual and De-velopmental Disability, Taylor & Francis, 2017, 43 (4), pp.407-420. �10.3109/13668250.2017.1285012�. �hal-01918941�
Validation of a French adaptation of the Multidimensional Student’s Life
Satisfaction Scale in its abbreviated form, for 5- to 11-year-old children with and
without intellectual disability
Charlotte Coudronnièrea, Fabien Bacroa, Philippe Guimardaand Jean-Baptiste Mullerb a
Centre de Recherche en Education de Nantes, Faculté de Psychologie, chemin de la Censive du Tertre, Nantes, France;bHôpital MèreEnfant -4ème étage Néonatologie & Réanimation Pédiatrique, CHU de Nantes, Nantes, France
ABSTRACT
Background: The quality of life (QOL) of children with and without intellectual disability (ID) has become a growing concern in the literature but the QOL instruments are not adapted for use with young children and children with ID. The objective of this study was to validate a French adaptation of the abbreviated form of the Multidimensional Student’s Life Satisfaction Scale (MSLSS).
Method: Confirmatory factor analyses were conducted on the data collected from 411 children aged between 5 and 11 years old. Internal consistency, test–retest fidelity, and convergent validity were tested.
Results: The preliminary results of this study show that the model fitted the data collected to assess the life satisfaction of children,χ2(395)= 705.340; p < .001; CFI = 0.911; TLI = 0.902; RMSEA = 0.044. Very good levels of internal consistency were obtained for both children with and without ID, with coefficients ranging from 0.70 to 0.88. The test–retest coefficients calculated after a 2-week interval highlighted a moderate (coefficients lower than 0.70) to weak temporal stability, which seemed more pronounced in children with ID.
Conclusion: Despite some limitations, this instrument could be very useful for childhood professionals. It will enable them to assess the perception that children have of their wellbeing in the perspective of promoting their QOL. This scale also provides researchers in psychology with the opportunity to enrich their knowledge on the QOL of children with ID.
KEYWORDS
children with intellectual disability; quality of life; wellbeing; life satisfaction scale; French validation; self-assessment
Introduction
In recent decades, the QOL of people with disability has become a growing concern in the literature and in Anglo-Saxon countries (Magerotte,2013). In the intel-lectual disability (ID) field, Anglo-Saxon practices sup-port the promotion of a lifestyle of comparable quality to that of people with a typical development. Thus, everyone with ID should be able to fulfil valued social roles (pupil, student, etc.) and be considered a full citizen (Proulx,2008).
In parallel, since the 2000s with the emergence of positive psychology, QOL has become a central subject of study for many disciplines, particularly those dedi-cated to childhood (Seligman & Csikszentmihalyi,
2000). This new field of research sees the QOL of indi-viduals from the angle of subjective wellbeing in order to favour their personal thriving (Shankland, 2014). In the ID field, subjective wellbeing constitutes a central subject of study for social policies and the delivery of ser-vices. It forms the basis for the development of new pol-icies as well as the assessment of educational programs
and their readaptation with the primary objective of increasing the life satisfaction of children with ID (Proulx, 2008). According to the model of Diener (1984), the subjective wellbeing of an individual relies on the affective and cognitive assessment of his or her life and is characterised by the frequent experience of positive affects, a low level of negative affects, and a high feeling of satisfaction with his or her life. Where the affects fluctuate and have a limited existence over time, life satisfaction is more stable and represents the “cognitive-evaluative” dimension of subjective wellbeing. This dimension is considered a key determinant of sub-jective wellbeing (Diener, Lucas, & Oishi,2002).
QOL instruments for children
The subjective concept of QOL has led many researchers to consider that children are best placed to express their feelings and assess their wellbeing (Upton, Lawford, & Eiser, 2008). However, various authors emphasise that the limited cognitive and language abilities of these
children mean that their replies are marred by a number of biases: a tendency to acquiescence and social desirabil-ity, difficulty in assessing the subjective aspects, or in understanding the items. As a result, there are few scales designed for children under 8 years old (Rodary, Pezet-Langevin, & Kalifa,2001). Moreover, to our knowledge, no instrument has been developed or adapted for chil-dren with ID.
In addition, the QOL instruments currently available were mostly developed in the paediatric field. Their pri-mary objective is to study the impact of the illness on the QOL of sick children (Rodary et al.,2001). As a result, the dimensions linked to health and functional abilities are overrepresented in these questionnaires, which limits the place of other dimensions describing the subjective QOL of children in good health (Bruchon-Schweitzer,
2002). Moreover, as they are often inspired by instru-ments designed for adults, the dimensions of QOL cov-ered by these questionnaires only partially describe the subjective QOL of children. Research has shown that peers, family relationships, and the school environment occupy an important place in the life of children (Cou-dronnière, Bacro, Guimard, & Florin, 2015). Yet these life domains are measured in a limited way in these instruments (Matza, Swensen, Flood, Secnik, & Leidy,
2004). In addition, most of them take the form of het-ero-questionnaires, asking the opinion of the members of the child’s family (Eiser & Morse, 2001). However, without knowledge of all the life experiences of children and the way they understand them, the third parties pro-duce assessments that do not reflect the feelings and experiences of children (Rajmil et al., 2009; Upton et al.,2008). Lastly, the psychometric qualities of these instruments have not always been tested or may be ques-tionable (Rodary et al.,2001). Most of them have been developed in English-speaking countries and very few French instruments are available (Siméoni, Auquier, Delarozière, & Béresniak, 1999). Table 1 presents four generic self-assessment scales currently available for young children from 5 years old.
Ultimately, the QOL instruments currently available are not adapted for use with very young children and children with ID. The study of their QOL and the devel-opment of generic self-assessment tools require more research, particularly in French-speaking countries. It should also be recalled that the QOL of children with special needs is composed of the same dimensions as that of children without disability (Magerotte,2013). It is therefore essential that future tools assess the QOL of children without disability and children with ID in the same way and by collecting their point of view directly.
Providing this type of scale for childhood pro-fessionals and psychologists would enable them to assess
the educational and therapeutic actions offered to chil-dren in order to improve their wellbeing (Proulx,
2008). Giving children the opportunity to express them-selves regarding the decision processes that concern them would lead to a better understanding of their expectations and an assessment of the relevance of their psychotherapeutic and educational care. In addition, it would enable practitioners to identify areas that can be sources of problems in the lives of children (Lemétayer & Gueffier,2006). Finally, such instruments could enable researchers to enrich the current theoretical knowledge on the wellbeing of children with ID, to understand better the factors that influence it, and to examine its role in children’s later development (Mager-otte,2013).
The MSLSS in its abbreviated form (Huebner, Zullig, & Saha,2012)
For these objectives, the abbreviated form of the MSLSS seems particularly relevant. In fact, this instrument assesses the QOL of children by measuring their life sat-isfaction. In 1994, the original form was composed of 40 items (Huebner,1994). However, in order to simplify the content of the scale, the format of the questionnaire was reduced to 30 items by eliminating the items formulated negatively (Huebner et al.,2012). Due to its generic com-ponent and self-assessment format, it can be used to col-lect directly the point of view of healthy and sick children. Designed for children aged from 8 to 18 years, this scale measures their general QOL as well as their satisfaction in specific domains identified as central in the discourse of children aged from 5 to 11 years (Coudronnière et al.,
2015). Lastly, it has satisfactory psychometric properties. It was validated with a population of 844 pupils aged 13 to 15 years living in south-east United States. Confirma-tory analyses highlighted the structural validity of the model (Huebner et al.,2012). The convergent and discri-minant validities were not tested for the abbreviated ver-sion of the MSLSS. Nevertheless, the 40-item scale presented good convergent validity with measures of affectivity, wellbeing, and feeling of self-efficacy (Gilman, Huebner, & Laughlin,2000) and was also negatively cor-related with scales of depression and anxiety (Funk, Huebner, & Valois,2006).
The abbreviated form of the MSLSS presents a num-ber of advantages for use with very young children and children with ID in a French-speaking context. Never-theless, currently validated with a population of children without disability aged 8 to 18 years, the present format of the questionnaire is not adapted to the abilities and life context of children younger than 8 years old or children with ID.
Table 1. Description and psychometric properties of generic self-assessment scales of QOL for children aged 5– 11 years. Age QOL compo- nent Asses sors Construc t valid ity Int ernal consisten cy (Cronba ch ’s α) Test –retes t reli ability (Pear son ’s r) C onverge nt val idity Divergent valid ities Country of o rigin AU QUEI (Manificat, Dazord , C ochat, & Nicol as, 1997 ) 3– 12 Hea lth-related QOL Child ren Inde penden ce, Leisu re, Funct ions, Family Overal l: 0.71 Dimen sions: NA Coefficients nonsi gnificant at 1 year Good corr elations wit h self-confide nce of children assess ed by their mot hers Age, gender France DISAB KIDS (Petersen , Schmidt , Power , Bullinger, & the DISAB KIDS Group, 200 5 ) 4– 16 Hea lth-related QOL Child ren Pare nts Physic al health , Social rel ationshi ps, Ment al healt h Dimen sions: 0.70 –0.87 Ove rall: NA Dimens ions: 0.71 – 0.83 Overall : NA Mode rate corr elations wit h PedsQL-4.0 Age, gender Germa ny, Gre ece, France , Nethe rlands, Switze rland, Aust ralia, Unite d King dom KIN DL-R (Ravens-Si eberer & Bullinger, 199 8 ) 4– 16 Hea lth-related QOL Child ren Pare nts Physic al health , Me ntal he alth, Soc ial rel ationshi ps, Funct ional abili ties Children Ove rall: 0.84 Dimen sions: 0.63 –0.76 Parent s Ove rall: 0.89 Dimen sions: 0.62 –0.81 NA Good corr elations wit h SF-36 and FLZ Age, gender Germa ny P edsQL-4.0 (Varni, Seid, & Ku rtin, 2001 ) 2– 18 Hea lth-related QOL Child ren (5 –18 year s) Pare nts (2 –18 years) Physic al healt h, P sychologi cal healt h, Soc ial relati onshi ps, Sc hool Children Ove rall: 0.88 Dimen sions: 0.80 –0.83 Parent s Ove rall: 0.90 Dimen sions: 0.86 –0.88 NA Good corr elations wit h como rbidity indic ators Health status Unite d States o f Ameri ca
Some recommendations for adapting QOL instruments to very young children and children with ID
Different studies have proved that these children are capable of giving a reliable estimation of their QOL and expressing their emotional states, which vary according to their experience or understanding of events in their daily life (Lemétayer & Gueffier,2006). In the paediatric sector, self-assessment scales have been devel-oped to measure the perception of pain in children with-out disability. Overall, authors state that from the age of 5 years, the cognitive abilities of children allow them to understand and agree to the formulated request (Stinson, Kavanagh, Yamada, Gill, & Stevens,2006). Nevertheless, certain developmental characteristics must be taken into account to adapt the questionnaires to their abilities (Matza et al.,2004). Before the age of 7 years, children have limited abilities in reading and writing that can compromise their self-assessment (von Baeyer, Forsyth, Stanford, Watson, & Chambers,2009). Thus, it is advisa-ble to use an external examiner to read and fill in the questionnaire (Ravens-Sieberer et al., 2014). Moreover, to limit all confusion about meaning, the formulation of the items must be as clear as possible and the mode of questioning must involve no ambiguity, with no nega-tive interroganega-tive forms (Eiser & Morse,2001). Concern-ing the format of questionnaires, Likert scales are very often used to assess pain intensity. Skills in the counting, seriation, and classification of numbers are required to discriminate between the different answers proposed. Before 7 years, these abilities are not yet mastered and children tend to deal with the choice of items in a dichotomic way (Chambers & Johnston,2002). In con-trast, the scales of drawn faces seem more adapted as the images represent the different choices of answers. It also appears that rounded shapes are dealt with better than square or rectangular ones. Thus, from the age of 4 years, children succeed in giving precise and valid answers (von Baeyer et al.,2009).
The aim of this study was to validate our adaptation of the abbreviated form of the MSLSS for children without disability and children with ID aged from 5 to 11 years. First, the mode of administration and the format of the items of the questionnaire were modified in order to adapt them to the abilities of the children questioned. A French translation was also carried out. Second, the multidimensional model of the abbreviated version was tested using confirmatory analyses before examining the internal consistency, temporal stability, and conver-gent and diverconver-gent validities of this scale. Differential analyses were also carried out to highlight interindivi-dual differences in terms of gender, age, and child
group (children without disability vs. children with ID). According to the literature, girls should say they have a better life satisfaction in the school domain com-pared to boys (Kong,2008); with increasing age, the peer relationships of children tend to develop more widely. New preoccupations with their self-esteem and their physical appearance also emerge (Harter, 1989). Thus, compared to the youngest children, older children should be more satisfied with their peer relationships and less satisfied in the“self” domain. Lastly, regardless of the degree of disability, every child with impairments sees their QOL and wellbeing decrease (Fattal & Leblond,
2005). Consequently, children with ID should assess their overall life satisfaction and in the different domains of their life more negatively than children without dis-ability, regardless of their age and gender.
Method
Research design
Data for this cross-sectional study was collected in 2014 and 2015 by trained graduate students. Only children without disability and children with mild/moderate ID aged 5 to 11 years who had been diagnosed by a paedia-trician, a psychologist, and health professionals were included in the study.
Ethical procedures
Elementary school principals and primary caregivers of the participating children gave their written informed consent to the research team, and were assured that the data collected in the study would be kept confiden-tial. The parents then received a letter explaining the study accompanied by a consent form. This was to be completed and signed by parents and the child to con-firm their agreement. This research was conducted in accordance with the Code of Ethics of Psychologists (Groupe Interorganisationnel pour la Réglementation de la Déontologie des Psychologues,2012).
Participants
Four hundred and eleven children aged from 5 to 11 years (M = 8.25 years, SD = 1.707) participated in the study. They attended 15 French schools, half of them situated in an urban zone and the other half in a rural zone. The first group was composed of 340 children without disability (167 girls and 173 boys) attending the French equivalents of kindergarten to Grade 6. Their mean age was 8.03 years (SD = 1.71). A second group constituted 71 children (29 girls and 42 boys)
with mild/moderate ID1attending either a regular school in a regular class or Classe d’Inclusion Scolaire2(CLIS 1) or a specialised institution. Their mean age was 9.25 years (SD = 1.284). Among these children, 53 had no associated disability (77.9%), 14 had a physical disability associated with ID (20.4%), and one child also had symp-toms characteristic of autism spectrum disorder (1.7%). Concerning age, there was a significant difference between the children without disability and the children with ID, χ2(6,411) = 41.163, p < .001, and concerning the
socioeco-nomic characteristics3of their families; a more disadvan-taged social origin was observed for families of children with ID, χ2(2,355) = 22.663, p < .001. These different demographic characteristics are reported inTable 2.
Measures
The abbreviated form of the MSLSS was translated into French using a forward and backward translation pro-cedure (Guillemin, Bombardier, & Beaton, 1993). This scale was designed to assess the life satisfaction of chil-dren without disability and chilchil-dren with ID aged from 5 to 11 years. To do this, a multidimensional assessment was carried out to measure life satisfaction in general and in the specific domains of their life: family, school, friends, living environment, and self. The questionnaire includes 30 items formulated in affirmative sentences (seeAppendix).
By referring to recent weeks, the children had to assess their degree of satisfaction related to the different domains of their life. They had to choose from several responses the one that corresponded most to what they felt concerning each domain of their life. For each item, children had to assess their level of agreement on a continuum ranging from 1 (strongly disagree) to 6 (strongly agree).
The“child” and “parent” forms of the Positive and Negative Affect Schedule (PANAS) were also adminis-tered in their abbreviated form (Ebesutani et al., 2012) in order to check the convergent validity of the abbre-viated form of the MSLSS. For each version, the PANAS assessed the positive and negative affectivity of children through 10 items. By referring to recent weeks, the child was asked how he or she felt in general. For each item, the notation was on a continuum ranging from 1 (not at all) to 5 (extremely). The two-factor struc-ture of this scale was confirmed by confirmatory analyses for the PANAS child and parent forms.4
Procedure
For all children, three example items were given at the beginning of each questionnaire in order to familiarise them with the task.
For children older than 8 years (n = 204), the ques-tionnaires were completed individually in class over about 45 minutes. For the very young children (n = 136) and the children with ID (n = 71), the tests were car-ried out in a dual situation (experimenter/child) for about thirty minutes. The examiner read the items aloud and filled the questionnaires. This took place in a room isolated from the rest of the class for the children attending an ordinary school, or outside their life group in a“neutral” place (different from where they received their therapeutic care) for the children attending insti-tutions or in a CLIS or a regular class. Visual supports adapted to each questionnaire were also designed to help the children choose their answers.5 For the MSLSS, the Likert-type scale with six degrees of agree-ment was represented by two distinct visual supports, each illustrating three answers. Each support represented three smiley faces in different colours of increasing size. The first illustrated the three degrees of agreement and the second presented the three degrees of disagreement. For the PANAS, the emotional frequency was rep-resented in the same format by round shapes of increas-ing size coloured in darkenincreas-ing shades of green rangincreas-ing from not at all to extremely. In addition, the children did a drawing in the middle of the MSLSS after the 15th item so that they could renew their attention afterwards.
Table 2.Sociodemographic characteristics of the participants.
Variables Number % Number % Without ID ID Participants 340 82.7 71 17.3 Gender Girls 167 49.1 29 40.8 Boys 173 50.9 42 59.2
Age of the group
Less than 8 years 136 40 22 31 More than 8 years 204 60 49 69 Type of schooling Kindergarten 36 10.6 0 0 Grade 1 70 20.6 2 2.8 Grade 2 30 8.8 0 0 Grade 3 75 22.1 2 2.8 Grade 4 63 18.5 0 0 Grade 6 66 19.4 1 1.4 CLIS 1 – – 41 57.8 Specialised institutions – – 25 35.2 Disability associated with the IDa
None – – 53 77.9
Physical disability – – 14 20.4 Autism spectrum disorder – – 1 1.7 Social backgrounda
Privileged 105 36.3 5 7.6
Average 133 46 39 59.1
Disadvantaged 73 17.7 22 33.3 Marital status of the familya
Married, civil partnership 230 73.5 53 75.7 Divorced, separated 83 26.5 18 24.3 Note. Without ID = without intellectual disability; ID = intellectual disability. aSome data are missing because some parents did not provide them.
Lastly, the temporal stability of the children’s answers was tested for 150 children (25 with ID and 125 without disability) after a 2-week interval.
Regarding the validation of the scale, confirmatory structural analyses were performed using IBM SPSS AMOS software. To estimate the quality of fit of the model observed with the initial theoretical model, four indices were used: the model chi-square statistic, the comparative fit index (CFI), the Tucker–Lewis index (TLI), and the root mean square residual (RMSEA). Ide-ally, a good fit is reflected by a nonsignificant chi-square and CFI and TLI values of approximately 0.90 or higher (Byrne,2001). For the RMSEA, a value of about 0.06 or lower was preferred for the model fit to be considered good (Hu & Bentler, 1998). The internal consistency and test–retest reliability of the scale were also tested for each dimension of the questionnaire by computing Cronbach’s alpha and correlation coefficients. For each of these indices, a value of 0.70 is generally considered sufficient to demonstrate internal consistency and tem-poral stability (Nunnally & Bernstein,1994). In addition, to test the divergent and convergent validity, the corre-lations between the abbreviated form of the MSLSS and both child positive and negative affectivity were ana-lysed with regard to the criteria defined by Cohen (1992). A correlation is considered weak if its absolute value is
less than 0.30, moderate if it lies between 0.30 and 0.50, and strong if it is higher than 0.50. Finally, the effects of age, gender, family structure, and child group (children without disability vs. children with ID) on overall life satisfaction and in the different life domains of the children questioned were examined using multi-variate analyses of variance.
Results
Descriptive statistics
The distributions of the scores obtained for the different items by all the children did not follow a normal distri-bution (see Table 3). As a result, a logarithmic trans-formation of these different variables was carried out in order to stabilise the variance and normalise the dis-tributions presenting a positive skewness. After this recoding, the maximum likelihood procedure was applied to test the factorial structure of the scale and for all subsequent analyses (Tabachnick & Fidell,2012).
Factorial structure
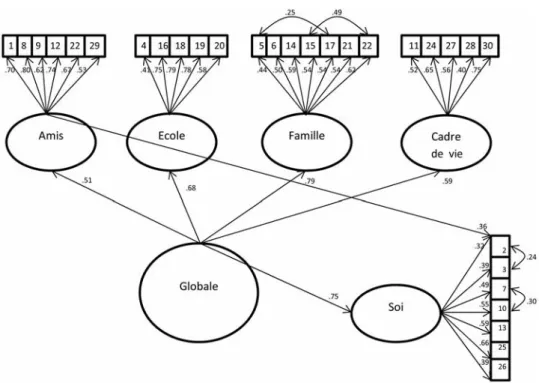
In line with the initial model, a model with five first-order factors corresponding to the five dimensions of life satisfaction and a second-order factor related to glo-bal life satisfaction was tested. The values obtained for the different fit indices in this first model suggested that it did not fit well the observed data. Thus, the residual variance matrices were examined in order to carry out the adjustments needed so that the model would fit the data well (Byrne, 2001). This analysis suggested adding covariances between the residual var-iances of Items 5 and 17, 15 and 22, 2 and 3, 7 and 10. It also highlighted a link between the latent variable “Friends” and the manifest variable of Item 2: “I am fun to be around.” Regarding the conceptual similarities between these items or with the dimension“Friends” for Item 2, the modifications made to the model seemed consistent. When this second model was tested, all the items of the questionnaire had a saturation higher than 0.30 (seeTable 4).
Moreover, the fit indices obtained were clearly better and showed that the model fitted the data collected to assess the life satisfaction of children: χ2(395) = 705.340; p < .001; CFI = 0.911; TLI = 0.902; RMSEA = 0.044 (seeFigure 1).
Internal consistency and test–retest reliability
Concerning the internal consistency for the whole scale, Cronbach’s alpha was equal to 0.87 for the children
Table 3.Descriptive data per item of the abbreviated form of the MSLSS. M SD Skewness Kurtosis Item 1 5 1.29 −1.52 1.76 Item 2 5.09 1.20 −1.54 1.99 Item 3 4.99 1.23 −1.31 1.20 Item 4 5.46 1.01 −2.25 5.11 Item 5 5.52 0.95 −2.48 6.58 Item 6 4.95 1.34 −1.29 0.83 Item 7 4.88 1.39 −1.34 1.14 Item 8 5.02 1.36 −1.47 1.45 Item 9 4.64 1.52 −1.03 0.01 Item 10 5.31 1.21 −2.05 3.58 Item 11 4.84 1.48 −1.21 0.44 Item 12 4.72 1.53 −1.12 0.15 Item 13 4.94 1.20 −1.18 0.92 Item 14 5.59 0.82 −2.50 7.12 Item 15 4.62 1.55 −1.08 0.09 Item 16 4.88 1.52 −1.40 0.92 Item 17 5.46 1.08 −2.36 5.18 Item 18 4.98 1.39 −1.51 1.53 Item 19 5.10 1.31 −1.61 1.92 Item 20 4.96 1.35 −1.45 1.44 Item 21 4.69 1.47 −1.13 0.36 Item 22 5.18 1.27 −1.73 2.33 Item 23 5.17 1.24 −1.63 2.03 Item 24 4.90 1.55 −1.37 0.74 Item 25 5.13 1.16 −1.66 2.68 Item 26 5.36 1.17 −2.16 4.46 Item 27 5.20 1.36 −1.92 2.84 Item 28 4.46 1.77 −0.86 −0.67 Item 29 4.82 1.65 −1.23 0.15 Item 30 5.18 1.37 −1.74 2.03
without disability and 0.88 for the children with ID. In addition, the coefficients obtained for the five dimen-sions of life satisfaction for all the children, distinguish-ing them accorddistinguish-ing to their age bracket and their group of belonging, were all higher than or equal to 0.70.
However, the results showed a moderate temporal stability calculated after a 2-week interval. Although the test–retest reliability coefficients were all signifi-cant, they were less than the threshold of 0.70 for all the dimensions of life satisfaction of the children with-out disability. Nevertheless, a better temporal stability was found for the children with ID, with only two dimensions whose correlation coefficients were lower than 0.70. These various results are presented in
Table 5.
Convergent and discriminant validities
First, for the assessment carried out by both the chil-dren without disability and the chilchil-dren with ID, their positive and negative affectivity scores were sig-nificantly correlated with overall life satisfaction and in the different life domains. The negative affectivity scores obtained with the PANAS child form seemed significantly and negatively correlated with life satis-faction for all the dimensions. The correlations were weak to moderate (0.18–0.40). These results were lower than the correlations obtained between the posi-tive affectivity measured by the children and their life satisfaction (0.23–0.60). However, the correlations appeared nonsignificant for almost all the dimensions of the life satisfaction of children, whether it was the positive or negative affectivity assessed by the parents of children without disability or those with ID (see
Table 6).
Table 4.Factorial weights of the items of the abbreviated form of the MSLSS.
Factor 1 Factor 2 Factor 3 Factor 4 Factor 5 Item 1 0.70 Item 8 0.80 Item 9 0.62 Item 12 0.74 Item 22 0.67 Item 29 0.53 Item 4 0.41 Item 16 0.75 Item 18 0.79 Item 19 0.78 Item 20 0.58 Item 5 0.44 Item 6 0.50 Item 14 0.55 Item 15 0.54 Item 17 0.54 Item 21 0.54 Item 23 0.62 Item 11 0.52 Item 24 0.65 Item 27 0.56 Item 28 0.40 Item 30 0.75 Item 2 0.32 Item 3 0.39 Item 7 0.49 Item 10 0.55 Item 13 0.59 Item 25 0.66 Item 26 0.39
Note. MSLSS = Multidimensional Student’s Life Satisfaction Scale.
Differential analyses
First, the analyses revealed a main effect of gender on the dimension “School,” F(1, 409) = 9.225, p < .010, ɳ2= 0.022. On average, girls reported higher school satisfac-tion (M = 5.24, SD = 0.072) compared to boys (M = 4.94, SD = 0.069). In addition, a significant effect of child appeared for the “Friends,” F(1, 409) = 4.450, p < .050, ɳ2= 0.011, and “Self,” F(1, 409) = 16.321, p < .001, ɳ2= 0.038, dimensions. The children younger than 8 years described themselves as more satisfied in the Self domain (M = 5.27, SD = 0.060) compared to those older than 8 years (M = 5.01, SD = 0.049). In con-trast, the latter tended to describe themselves as more satisfied with their peer relationships (M = 4.98, SD = 0.071) compared to younger children (M = 4.74, SD = 0.086). Furthermore, the results revealed no effect of family structure on the different dimensions of children’s life satisfaction (seeTable 7).
On the other hand, after controlling for the effects of gender, social background, and the age of children, differ-ences in QOL scores between children without disability and children with ID were observed in four domains of life satisfaction: School, F(1, 350) = 4.285, p < .010,ɳ2= 0.012, Friends, F(1, 350) = 27.411, p < .001, ɳ2= 0.092, Family, F(1, 350) = 9.840, p < .050,ɳ2= 0.036, and overall life satisfaction, F(1, 340) = 12.401, p < .010,ɳ2= 0.039.
Overall, the children with ID thus appeared less satis-fied with their life (M = 4.770, SD = 0.079) than children without disability (M = 5.081, SD = 0.037). Moreover, they described their relationships with their peers (M = 4.290, SD = 0.16) and their family (M = 4.851, SD = 0.098) more negatively compared to children with-out disability (Friends: M = 5.027, SD = 0.059; Family: M = 5.195, SD = 0.046). Children with ID also reported higher school satisfaction (M = 4.826, SD = 0.128) than children without disability (M = 5.12, SD = 0.059). Finally, the analyses revealed an interaction effect between child age and child group for the dimension Self, F(1, 355) = 7.331, p < .010, ɳ2= 0.021. Although the children without disability said they were more satis-fied in the Self domain before 8 years old (M = 5.34, SD = 0.064), conversely, with increasing age the children with ID reported a higher satisfaction with themselves (under 8 years old: M = 4.829, SD = 0.156; over 8 years old: M = 5.048, SD = 0.108; seeTable 8).
Discussion
Consistent with the results obtained with the original version of the MSLSS, the confirmatory analyses con-ducted in this study confirmed its multifactorial struc-ture with five first-order factors and one second-order
Table 5.Coefficients of internal consistency and test–retest reliability of the abbreviated form of the MSLSS.
Cronbach’s α Correlation coefficients Without ID All Without ID < 8 years ID Without ID All Without ID < 8 years ID Friends 0.83 0.79 0.76 0.60** 0.58** 0.77** School 0.77 0.70 0.87 0.50** 0.48** 0.71** Family 0.76 0.73 0.70 0.56** 0.68** 0.81** Environment 0.71 0.70 0.70 0.48** 0.59** 0.60** Self 0.72 0.70 0.71 0.48** 0.46** 0.59** Overall 0.87 0.84 0.88 0.65** 0.68** 0.82**
Note. MSLSS = Multidimensional Student’s Life Satisfaction Scale. **p < .01.
Table 6.Relationships between the abbreviated form of the MSLSS and the PANAS child and parent forms.
Correlation coefficients
PANAS-C (Child) PANAS-CP (Parent)
Positive affectivity Negative affectivity Positive affectivity Negative affectivity Without IDa IDb Without IDa IDb Without IDa IDb Without IDa IDb
School 0.35** 0.54** −0.21** −0.22** 0.06 0.13 0.02 −0.18 Friends 0.23** 0.35** −0.25** −0.40** 0.03 0.01 0.09 −0.15 Family 0.30** 0.30** −0.19** −0.27** 0.13* −0.02 −0.20 −0.19 Environment 0.25** 0.45** −0.18* −0.10 0.04 0.01 −0.01 −0.08 Self 0.41** 0.53** −0.18** −0.28** 0.11 −0.13 0.01 0.06 Overall 0.43** 0.60** −0.30** −0.25** 0.103 0.02 0.03 −0.16
Note. MSLSS = Multidimensional Student’s Life Satisfaction Scale; PANAS = Positive and Negative Affect Schedule. a n = 340. b n = 71. *p < .05. **p < .01.
factor. In comparison with the original form of Huebner et al. (2012), only one modification was made to the model: A link was added between the latent variable Friends and the manifest variable corresponding to Item 2 (“I am fun to be around”). Very good levels of internal consistency were obtained for both children with and without ID. The values obtained for the five dimensions of life satisfaction for all the children, dis-tinguishing them according to age and ID, were all higher than or equal to 0.70 (from 0.70 to 0.88). These coefficients are similar to those reported for the original version, with coefficients ranging from 0.71 (Self) to 0.91 (Family; Huebner et al.,2012). However, the test–retest
coefficients calculated after a 2-week interval highlighted a moderate to weak temporal stability, which seemed more pronounced in children with ID. The test–retest reliability was not assessed in the validation study of the abbreviated form of the MSLSS (Huebner et al.,
2012). Nonetheless, Diener (2009) underlined the
temporal variability found with scales assessing subjec-tive wellbeing. Unlike objecsubjec-tive assessments, these instruments are more sensitive to the events experienced by the people questioned. These results may also be explained by the effect of age and ID on the reliability and reproducibility of children’s responses. Various authors emphasise that self-report scales might intro-duce some bias in the responses of very young children or children with ID (Rodary et al.,2001) due to a ten-dency to acquiescence, social desirability, and difficulties in assessing the subjective aspects of their life (Fattal & Leblond,2005; Hodgkinson, d’Anjou, Dazord, & Berard, 2002; Martin-Laval, 1992). Young children (before the age of 8 years) and children with ID may have problems understanding and interpreting the questions because of their language as well as their general cognitive ability (Ravens-Sieberer et al.,2006). In addition, some research shows that young children (Chambers & Johnston,2002) and children with ID (Hartley & MacLean,2006) may have difficulty in answering questions using Likert scales. The latter have a tendency to choose the most positive alternative in this response format, which requires the complex task of distinguishing subtle differences in responses (Chambers & Johnston, 2002; Hartley &
Table 7.Effects of gender, age, and family structure on all the dimensions of the life satisfaction of children.
df F p Partial eta2 School Gender (1, 409) 9.225 0.003 0.022 Age (1, 409) 1.125 0.289 0.003 Family structure (1, 381) 0.368 0.545 0.001 Age × Gender (1, 353) 2.170 0.142 0.007 Age × Family structure (1, 353) 0.004 0.949 0.001 Gender × Family structure (2, 353) 0.155 0.857 0.001 Family
Gender (1, 409) 0.968 0.326 0.002 Age (1, 409) 2.483 0.116 0.006 Family structure (1, 381) 0.277 0.599 0.001 Age × Gender (1, 353) 2.097 0.147 0.006 Age × Family structure (1, 353) 0.098 0.148 0.006 Gender × Family structure (2, 353) 0.413 0.662 0.003 Friends
Gender (1, 409) 0.001 0.971 0.000 Age (1, 409) 4.450 0.036 0.011 Family structure (1, 381) 0.393 0.531 0.001 Age × Gender (1, 353) 0.472 0.512 0.001 Age × Family structure (1, 353) 0.075 0.785 0.001 Gender × Family structure (2, 353) 0.413 0.662 0.003 Living environment
Gender (1, 409) 0.211 0.646 0.001 Age (1, 409) 1.501 0.220 0.004 Family structure (1, 381) 2.485 0.116 0.006 Age × Gender (1, 353) 0.028 0.867 0.001 Age × Family structure (1, 353) 0.030 0.863 0.001 Gender × Family structure (2, 353) 0.432 0.650 0.003 Self
Gender (1, 409) 2.017 0.156 0.005 Age (1, 409) 16.32 0.001 0.038 Family structure (1, 381) 1.461 0.227 0.004 Age × Gender (1, 353) 1.724 0.190 0.005 Age × Family structure (1, 353) 1.674 0.197 0.005 Gender × Family structure (2, 353) 0.062 0.940 0.001 Overall life satisfaction
Gender (1, 409) 2.776 0.096 0.007 Age (1, 409) 0.321 0.571 0.001 Family structure (1, 381) 0.867 0.352 0.002 Age × Gender (1, 353) 2.763 0.097 0.008 Age × Family structure (1, 353) 0.226 0.635 0.001 Gender × Family structure (2, 353) 0.180 0.832 0.001
Table 8. Effect of child group (children without disability vs. children with ID) on the dimensions of the abbreviated form of the MSLSS after controlling for effects of gender, age, and social background. df F p Partial eta2 School Group (1, 350) 4.285 0.007 0.012 Group × Age (1, 350) 0.815 0.367 0.002 Group × Gender (1, 350) 0.141 0.708 0.001 Group × Social background (1, 350) 1.821 0.163 0.011 Family
Group (1, 350) 9.840 0.011 0.036 Group × Age (1, 350) 0.118 0.732 0.001 Group × Gender (1, 350) 2.120 0.146 0.001 Group × Social background (1, 350) 0.325 0.723 0.002 Friends
Group (1, 350) 27.411 0.001 0.092 Group × Age (1, 350) 0.244 0.621 0.001 Group × Gender (1, 350) 0.234 0.629 0.001 Group × Social background (1, 350) 0.417 0.659 0.003 Living environment
Group (1, 350) 0.051 0.936 0.002 Group × Age (1, 350) 0.686 0.408 0.002 Group × Gender (1, 350) 1.022 0.313 0.003 Group × Social background (1, 350) 0.315 0.730 0.002 Self
Group (1, 350) 2.089 0.004 0.042 Group × Age (1, 350) 7.331 0.007 0.021 Group × Gender (1, 350) 0.005 9.42 0.001 Group × Social background (1, 350) 0.024 0.536 0.004 Overall life satisfaction
Group (1, 350) 12.401 0.008 0.039 Group × Age (1, 350) 0.342 0.349 0.003 Group × Gender (1, 350) 0.002 0.961 0.001 Group × Social background (1, 350) 0.892 0.411 0.005 Note. ID = intellectual disability; MSLSS = Multidimensional Student’s Life
MacLean, 2006). To correct this bias, authors suggest reducing the Likert scale to 5 points maximum (Hartley & MacLean,2006). The use of pictorial representations can also help children distinguish the response degrees (Zabalia & Corfec, 2008). In this study, we chose to keep the 6-point Likert scale format of the original ver-sion of the MSLSS to avoid reducing the sensitivity of the instrument. However, these were represented by two distinct visual supports each illustrating three response choices. Each support represented three smiley faces in different colours and of increasing size. Despite these adaptations, children may have had difficulties in differentiating the smiley faces. Changes in colour and size may have functioned as confounding variables.
On the other hand, the correlation coefficients calcu-lated between the scores of affectivity and the life satis-faction of children confirmed the convergent and discriminant validities of this scale. The significant relationships revealed between self-assessment of affec-tivity and all the dimensions of life satisfaction confirm the results previously obtained with adults and children aged over 11 years (Diener,2012). These results suggest that the positive and negative affects felt by very young children or children with ID also contribute to their QOL and their subjective wellbeing (Diener, 2012). However, compared to the relationship between positive affectivity assessed by the children and their life satisfac-tion, a weaker link was observed between negative affec-tivity and life satisfaction. These results confirm those of Huebner and Dew (1996), who found a weaker relation-ship between global life satisfaction and negative affectiv-ity (r =−0.27) than positive affectivity (r = 0.43). Moreover, the absence of a link between the affectivity of children assessed by their parents and all the dimen-sions of their life satisfaction confirms the poor agree-ment between the assessagree-ments made by members of the child’s family and by the children themselves. In fact, the appreciation of the QOL and wellbeing of chil-dren by intermediary assessors seems more faithful to the feelings of children concerning objective aspects than subjective aspects (Eiser & Morse,2001).
The results of multivariate analyses also showed that the different dimensions of life satisfaction assessed with this scale discriminate quite clearly between the children. First, in accordance with the international lit-erature, girls described themselves as more satisfied in the school domain than boys (Kong, 2008). On the other hand, the children over 8 years old assessed their life satisfaction in the domain of Self more negatively than the younger children, but they said they were more satisfied with their peer relationships. These results may be explained from a developmental perspective as, with increasing age, physical, emotional, social, and
cognitive developments have repercussions on the differ-ent domains of children’s lives. New preoccupations linked with physical appearance, social skills, and self-perception emerge (Harter, 1989). As a result, many authors note a decline in children’s self-esteem (Deihl, Vicary, & Deike,1997), which is strongly and positively correlated with the level of their life satisfaction (Hueb-ner & Dew,1996). In parallel, their friendships develop and evolve into new reciprocal friendships created via a trusting relationship (Poulin & Chan, 2010). These new connections lead to feelings of safety, which predict an increase in wellbeing and positive moods (Berndt,
2002). However, these results must be interpreted with caution. One factor that may explain the differences observed between typically developing children and chil-dren with ID is the type of schooling, which differed con-siderably across groups (regular school vs. CLIS 1 vs. specialised institutions). The context of schooling may have an impact on life satisfaction (Proctor, Linley, & Maltby, 2009). Thus, the validity of the comparison between children with and without ID appears to be limited.
Lastly, an effect of child group on the life satisfaction of children was observed. Compared to children without disability, the children with ID described themselves as less satisfied with their life in general as well as in the school, family, and friends domains. Regardless of the degree of impairment, all children with disability see their wellbeing diminished (Cousson-Gélie,2013; Fattal & Leblond, 2005). The majority of works underline the isolation of children with disability and their social exclusion, which are the consequences of significant stig-matisation by their peers without disability (Nadeau & Tessier, 2003). Moreover, changes impact the pro-fessional practice of parents (often only one parent works in the couple), the rhythm of family life, and relationships with siblings, thus altering family relation-ships (Dobson, Middleton, & Beardsworth,2001; Lopez, Clifford, Minnes, & Ouellette-Kuntz,2008). Educational failure in these young people arouses feelings of personal inadequacy associated with the school domain (Ninot, Bilard, Delignières, & Sokolowski,2000).
Finally, the preliminary results of this study show that our adaptation of the MSLSS presents satisfactory psy-chometric qualities. However, several limitations must be considered and further research is needed to ensure confidence in the use of this scale with younger children and children with ID living in France. First, due to the limited cognitive and language abilities of children with ID, it would be relevant to test the structural invariance of this scale according to child group. Our sample of chil-dren with ID was too small to carry out multigroup ana-lyses and to determine whether the structure of the
questionnaire, the factorial weights, and the residual var-iances of the items can be considered invariant. Thus, following the procedure proposed by Byrne (2004), a lar-ger sample of children with ID would allow us to test the structural invariance of the scale and to determine whether Huebner’s model of QOL applies equally to chil-dren with and without ID. The hypothesis according to which the QOL of children with ID is composed of the same dimensions as children without disability (Mager-otte, 2013; Schalock, 1993) could also be tested. More-over, the temporal stability of the questionnaire is moderate. This could be explained by the fact that the younger children and children with ID had difficulties understanding the wording of some items and discrimi-nating multiple response choices. As part of our future research, the wording of some items could be simplified to facilitate administration to children with ID. For example, Lunsky, Emery, and Benson (2002) suggest incorporating paraphrases and/or definitions of terms in the questionnaire. Other authors note that scenarios with dolls, puppets, and cuddly toys can be used to explain the items of questionnaires (Eiser, Cotter, Oades, Seamark, & Smith,1999). To help children dis-criminate better the degrees of agreement, the represen-tation of smiley faces could be modified. In fact, each visual support should represent smiley faces in a differ-ent colour gradidiffer-ent. For example, smiley faces corre-sponding to degrees of agreement could be represented by a gradation of green, whereas smiley faces referring to degrees of disagreement could appear in a red gradi-ent. This new revised and simplified life satisfaction scale could then be tested with children with moderate to severe ID. Lastly, the predictive validity of the scale should be evaluated in a longitudinal study and the sub-scales should be validated. Self-esteem is recognised as a key determinant of QOL and mental health (Brown,
1998). Thus, it would be appropriate to study the relationships between the different dimensions of QOL and self-esteem of children.
In conclusion, despite these limitations, our adap-tation of the abbreviated form of the MSLSS is the first self-assessment QOL instrument suitable for children as young as 5 years old and children with ID to be the subject of a validation study in a French-speaking popu-lation. This scale is of major interest for childhood pro-fessionals. It will enable them to assess the perception that children have of their wellbeing in important domains of their life, to take into account the specific needs of these children, and to promote their wellbeing. In addition, this scale provides researchers in psychology with the opportunity to enrich their knowledge on the wellbeing of children with ID and to respond to political and governmental legislation related to the United
Nations Convention on the Rights of the Child (United Nations, 1989), and the recommendations of the OCDE (2009), which give a particular impetus to aware-ness and improvement of the wellbeing of children.
Notes
1. According to the fifth edition of the Diagnostic and Stat-istical Manual of Mental Disorders (DSM-5; American Psychiatric Association, 2013), ID is a disorder with onset during the developmental period that includes both intellectual and adaptive functioning deficits in conceptual, social, and practical domains.
2. CLIS 1 are classes for children aged 7 to 12 years with significant problems in cognitive functions. They enable pupils with disability to follow a curriculum in an ordin-ary school in a specialised class of no more than 12 chil-dren. The appropriate physical adaptations and teaching materials are provided according to the age, disability, and capacities of each child.
3. Social categories determined according to the grid used in surveys by the French Direction de l’Evaluation de la Prospective et de la Performance (DEPP; Evaluation, Forecasting and Performance Department) of the Min-istry of National Education, based on the socio-pro-fessional category of the reference person of the family or the father.
4. The fit of the model for the data collected with the child form were: χ2(33) = 66.34, p < .001; RMSEA = 0.050; CFI = 0.939; TLI = 0.917; internal consistency: positive affectivity = 0.57 and negative affectivity = 0.65; and the parent form, χ2(31) = 66.68, p < .001; RMSEA = 0.056; CFI = 0.946; TLI = 0.927; internal consistency: positive affectivity = 0.71 and negative affectivity = 0.66. 5. Visual supports are available upon request by contacting
the first author.
Disclosure statement
No potential conflict of interest was reported by the authors.
References
American Psychiatric Association. (2013). Diagnostic and stat-istical manual of mental disorders (5th ed.). Arlington, VA: American Psychiatric Publishing.
Berndt, T. J. (2002). Friendship quality and social develop-ment. Current Directions in Psychological Science, 11, 7– 10.doi:10.1111/1467-8721.00157
Brown, J. D. (1998). The self. Boston, MA: McGraw-Hill. Bruchon-Schweitzer, M. (2002). Psychologie de la santé:
Modèles, concepts et méthodes [Health psychology: Models, concepts and methods]. Paris, France: Dunod. Byrne, B. M. (2001). Structural equation modeling with AMOS:
Basic concepts, applications, and programming. Mahwah, NJ: Erlbaum.
Byrne, B. M. (2004). Testing for multigroup invariance using AMOS graphics: A road less traveled. Structural Equation Modeling: A Multidisciplinary Journal, 11, 272–300. doi:10.1207/s15328007sem1102_8
Chambers, C. T., & Johnston, C. (2002). Developmental differ-ences in children’s use of rating scales. Journal of Pediatric Psychology, 27, 27–36.doi:10.1093/jpepsy/27.1.27
Cohen, J. (1992). A power primer. Psychological Bulletin, 112, 155–159.doi:10.1037/0033-2909.112.1.155
Coudronnière, C., Bacro, F., Guimard, G., & Florin, A. (2015). Quelle conception de la qualité de vie et du bien-être chez des enfants de 5 à 11 ans? [What is the conception of quality of life and well-being among children aged 5 to 11 years old?]. Enfance, 2015, 225–243.doi:10.4074/S0013754515002049 Cousson-Gélie, F. (2013). Les déterminants psychosociaux de
la qualité de vie chez des patients atteints de maladie grave et/ou chronique [Psychosocial determinants of quality of life in patients with severe and/or chronic disease]. In F. Bacro (Ed.), La qualité de vie: Approches psychologiques (pp. 103–115). Rennes, France: Presses universitaires de Rennes. Deihl, L. M., Vicary, J. R., & Deike, R. C. (1997). Longitudinal trajectories of self-esteem from early to middle adolescence and related psychosocial variables among rural adolescents. Journal of Research on Adolescence, 7, 393–411.doi:10.1207/ s15327795jra0704_3
Diener, E. (1984). Subjective well-being. Psychological Bulletin, 95, 542–575.
Diener, E. (Ed.). (2009). Assessing well-being: The collected works of Ed Diener. New York, NY: Springer.doi:10.1007/ 978-90-481-2354-4
Diener, E. (2012). New findings and future directions for sub-jective well-being research. American Psychologist, 67, 590– 597.doi:10.1037/a0029541
Diener, E., Lucas, R. E., & Oishi, S. (2002). Subjective well-being: The science of happiness and life satisfaction. In C. R. Snyder, & S. J. Lopez (Eds.), The handbook of positive psy-chology (pp. 63–73). New York, NY: Oxford University Press. Dobson, B., Middleton, S., & Beardsworth, A. (2001). The impact of childhood disability on family life. Layerthorpe, UK: Joseph Rowntree Foundation.
Ebesutani, C., Regan, J., Smith, A., Reise, S., Higa-McMillan, C., & Chorpita, B. F. (2012). The 10-item Positive and Negative Affect Schedule for Children, child and parent shortened versions: Application of item response theory for more efficient assessment. Journal of Psychopathology and Behavioral Assessment, 34, 191–203. doi:10.1007/ s10862-011-9273-2
Eiser, C., Cotter, I., Oades, P., Seamark, D., & Smith, R. (1999). Health-related quality-of-life measures for children. International Journal of Cancer, 83(S12), 87–90. doi:10. 1002/(SICI)1097-0215(1999)83:12+<87::AID-IJC16>3.0. CO;2-O
Eiser, C., & Morse, R. (2001). A review of measures of quality of life for children with chronic illness. Archives of Disease in Childhood, 84, 205–211.doi:10.1136/adc.84.3.205 Fattal, C., & Leblond, C. (2005). Évaluation des aptitudes
fonc-tionnelles, du handicap et de la qualité de vie chez le blessé médullaire. [Assessment of functional abilities, handicap and quality of life in patients with spinal cord injuries]. Annales de Réadaptation et de Médecine Physique, 48, 346–360.doi:10.1016/j.annrmp.2005.03.006
Funk, B. A., III, Huebner, E. S., & Valois, R. F. (2006). Reliability and validity of a brief life satisfaction scale with a high school sample. Journal of Happiness Studies, 7, 41– 54.doi:10.1007/s10902-005-0869-7
Gilman, R., Huebner, E. S., & Laughlin, J. E. (2000). A first study of the Multidimensional Students’ Life Satisfaction Scale with adolescents. Social Indicators Research, 52, 135– 160.doi:10.1023/A:1007059227507
Groupe Interorganisationnel pour la Réglementation de la Déontologie des Psychologues. (2012). Actualisation du Code de déontologie des psychologues de mars 1996. Février 2012 [Updating of the Code of Ethics for Psychologists of March 1996. February 2002]. Retrieved fromhttp://www. codededeontologiedespsychologues.fr/IMG/pdf
Guillemin, F., Bombardier, C., & Beaton, D. (1993). Cross-cul-tural adaptation of health-related quality of life measures: Literature review and proposed guidelines. Journal of Clinical Epidemiology, 46, 1417–1432. doi:10.1016/0895-4356(93)90142-N
Harter, S. (1989). Causes, correlates and the functional role of global self-worth: A life-span perspective. In J. Kollignan, & R. Sternberg (Eds.), Perceptions of competence and incompe-tence across the life span (pp. 67–97). New York, NY: Springer-Verlag.
Hartley, S. L., & MacLean, W. E., Jr. (2006). A review of the reliability and validity of Likert-type scales for people with intellectual disability. Journal of Intellectual Disability Research, 50, 813–827. doi:10.1111/j.1365-2788.2006. 00844.x
Hodgkinson, I., d’Anjou, M. C., Dazord, A., & Berard, C. (2002). Qualité de vie d’une population de 54 enfants infirmes moteurs cérébraux marchants. Étude transversale [Quality of life of a population of 54 ambulatory children with cerebral palsy. A cross-sectional study]. Annales de Réadaptation et de Médecine Physique, 45, 154–158. doi:10.1016/S0168-6054(02)00195-2
Hu, L., & Bentler, P. M. (1998). Fit indices in covariance struc-ture modeling: Sensitivity to underparameterized model misspecification. Psychological Methods, 3, 424–453. doi:10.1037/1082-989X.3.4.424
Huebner, E. S. (1994). Preliminary development and vali-dation of a multidimensional life satisfaction scale for chil-dren. Psychological Assessment, 6, 149–158. doi:10.1037/ 1040-3590.6.2.149
Huebner, E. S., & Dew, T. (1996). The interrelationships of positive affect, negative affect and life satisfaction in an ado-lescent sample. Social Indicators Research, 38, 129–137. doi:10.1007/BF00300455
Huebner, E. S., Zullig, K. J., & Saha, R. (2012). Factor structure and reliability of an abbreviated version of the Multidimensional Students’ Life Satisfaction Scale. Child Indicators Research, 5, 651–657. doi:10.1007/s12187-012-9140-z
Kong, C.-K. (2008). Classroom learning experiences and stu-dents’ perceptions of quality of school life. Learning Environments Research, 11, 111–129. doi:10.1007/s10984-008-9040-9
Lemétayer, F., & Gueffier, M. (2006). Evaluation de la qualité de vie des enfants et des adolescents avec une déficience intellectuelle pris en charge dans un institut spécialisé [Evaluation of the quality of life of children and adolescents with intellectual disability cared for in a specialised insti-tute]. Revue Francophone de la Déficience Intellectuelle, 17, 65–77. Retrieved from http://www.rfdi.org/wp-content/ uploads/2013/05/LEMETAYER_v17.pdf
Lopez, V., Clifford, T., Minnes, P., & Ouellette-Kuntz, H. (2008). Parental stress and coping in families of children with and without developmental delays. Journal on Developmental Disabilities, 14, 100–104.
Lunsky, Y., Emery, C. F., & Benson, B. A. (2002). Staff and self-reports of health behaviours, somatic complaints, and medi-cations among adults with mild intellectual disability. Journal of Intellectual & Developmental Disability, 27, 125–135.doi:10.1080/13668250220135079-4
Magerotte, G. (2013). Qualité de vie des personnes ayant un handicap: Pratiques d’évaluation et d’intervention en autisme et/ou déficience intellectuelle [Quality of life for people with disability: Assessment practices and inter-vention in autism and/or intellectual disability]. In F. Bacro (Ed.), La qualité de vie: Approches psychologiques (pp. 85–102). Rennes, France: Presses universitaires de Rennes.
Manificat, S., Dazord, A., Cochat, P., & Nicolas, J. (1997). Évaluation de la qualité de vie en pédiatrie: Comment recueillir le point de vue de l’enfant. [Assessment of quality of life in pediatrics: A questionnaire to assess the child’s own opinion]. Archives de Pédiatrie, 4, 1238–1246.doi:10.1016/ S0929-693X(97)82616-4
Martin-Laval, H. (1992). Évaluation de la qualité de vie des personnes présentant une déficience intellectuelle [Evaluation of quality of life of adults with intellectual dis-ability]. Revue Francophone de la Déficience Intellectuelle, 3, 139–141. Retrieved from http://www.rfdi.org/wp-content/uploads/2013/06/MARTIN-LAVAL_v3sp.pdf Matza, L. S., Swensen, A. R., Flood, E. M., Secnik, K., & Leidy,
N. K. (2004). Assessment of health-related quality of life in children: A review of conceptual, methodological, and regu-latory issues. Value in Health, 7, 79–92. doi:10.1111/j.1524-4733.2004.71273.x
Nadeau, L., & Tessier, R. (2003). Relations sociales entre enfants à l’âge scolaire: Effet de la prématurité et de la déficience motrice [Social relationships between schoolchil-dren: The effect of prematurity and motor deficiency]. Enfance, 55, 48–55.doi:10.3917/enf.551.0048
Ninot, G., Bilard, D., Delignières, D., & Sokolowski, M. (2000). La survalorisation du sentiment de compétence de l’adoles-cent déficient intellectuel en milieu spécialisé [Overestimation of perceived competence in adolescents placed in specialised schools]. Revue Européenne de Psychologie Appliquée, 50, 165–173. Retrieved from https://www.researchgate.net/publication/281467810 Nunnally, J. C., & Bernstein, I. H. (1994). Psychometric theory
(3rd ed.). New York, NY: McGraw Hill.
OCDE. (2009). Assurer le bien-être des enfants [Doing better for children]. Paris, France: Editions de l’OCDE.
Petersen, C., Schmidt, S., Power, M., Bullinger, M., & the DISABKIDS Group. (2005). Development and pilot-testing of a health-related quality of life chronic generic module for children and adolescents with chronic health conditions: A European perspective. Quality of Life Research, 14, 1065–1077.doi:10.1007/s11136-004-2575-z
Poulin, F., & Chan, A. (2010). Friendship stability and change in childhood and adolescence. Developmental Review, 30, 257–272.doi:10.1016/j.dr.2009.01.001
Proctor, C. L., Linley, P. A., & Maltby, J. (2009). Youth life sat-isfaction: A review of the literature. Journal of Happiness Studies, 10, 583–630.doi:10.1007/s10902-008-9110-9
Proulx, J. (2008). Qualité de vie et participation sociale: deux concepts clés dans le domaine de la déficience intellectuelle. Une recension des écrits [Quality of life and social partici-pation: Two key concepts in the field of intellectual disabil-ity. A review of the literature]. (Rapport no. 08-08). Cahiers du Larepps, Québec, Canada: Université du Québec à Montréal.
Rajmil, L., Palacio-Vieira, J. A., Herdman, M., López-Aguilà, S., Villalonga-Olives, E., Valderas, J. M.,… Alonso, J. (2009). Effect on health-related quality of life of changes in mental health in children and adolescents. Health and Quality of Life Outcomes, 7, 1–7.doi:10.1186/1477-7525-7-103 Ravens-Sieberer, U., & Bullinger, M. (1998). Assessing
health-related quality of life in chronically ill children with the German KINDL: First psychometric and content analytical results. Quality of Life Research, 7, 399–407. doi:10.1023/ A:1008853819715
Ravens-Sieberer, U., Devine, J., Bevans, K., Riley, A. W., Moon, J., Salsman, J. M., & Forrest, C. B. (2014). Subjective well-being measures for children were developed within the PROMIS project: Presentation of first results. Journal of Clinical Epidemiology, 67, 207–218. doi:10.1016/j.jclinepi. 2013.08.018
Ravens-Sieberer, U., Erhart, M., Wille, N., Wetzel, R., Nickel, J., & Bullinger, M. (2006). Generic health-related quality-of-life assessment in children and adolescents: Methodological considerations. PharmacoEconomics, 24, 1199–1220.doi:10.2165/00019053-200624120-00005 Rodary, C., Pezet-Langevin, V., & Kalifa, C. (2001). Qualité de
vie chez l’enfant: Qu’est ce qu’un bon outil d’évaluation? [Quality of life in children: What is a‘good’ measurement tool?]. Archives de Pédiatrie, 8, 744–750. doi:10.1016/ S0929-693X(00)90309-9
Schalock, R. L. (1993). La qualité de vie: Conceptualisation, mesure et application [Quality of life: Conceptualisation, measurement and application]. Revue Francophone de la Déficience Intellectuelle, 4, 137–151.
Seligman, M. E. P., & Csikszentmihalyi, M. (2000). Positive psychology: An introduction. American Psychologist, 55, 5–14.doi:10.1037/0003-066X.55.1.5
Shankland, R. (2014). La psychologie positive [Positive psychol-ogy] (2nd ed.). Paris, France: Dunod.
Siméoni, M. C., Auquier, P., Delarozière, J. C., & Béresniak, A. (1999). Evaluation de la qualité de vie chez l’enfant et l’ado-lescent: Qualité de vie det santé [Assessing quality of life in children and adolescents: Quality of life and health]. La Presse Medicale, 28, 1033–1039.
Stinson, J. N., Kavanagh, T., Yamada, J., Gill, N., & Stevens, B. (2006). Systematic review of the psychometric properties, interpretability and feasibility of self-report pain intensity measures for use in clinical trials in children and adoles-cents. Pain, 125, 143–157.doi:10.1016/j.pain.2006.05.006 Tabachnick, B. G., & Fidell, L. S. (2012). Using multivariate
statistics (6th ed.). Boston, MA: Pearson Education. United Nations. (1989). United Nations convention on the
rights of the child. Geneva, Switzerland: Author.
Upton, P., Lawford, J., & Eiser, C. (2008). Parent–child agree-ment across child health-related quality of life instruagree-ments: A review of the literature. Quality of Life Research, 17, 895– 913.doi:10.1007/s11136-008-9350-5
Varni, J. W., Seid, M., & Kurtin, P. S. (2001). PedsQL™4.0: Reliability and validity of the Pediatric Quality of Life
Inventory™Version 4.0 Generic Core Scales in healthy and patient populations. Medical Care, 39, 800–812. doi:10. 1097/00005650-200108000-00006
von Baeyer, C. L., Forsyth, S. J., Stanford, E. A., Watson, M., & Chambers, C. T. (2009). Response biases in preschool chil-dren’s ratings of pain in hypothetical situations. European Journal of Pain, 13, 209–213. doi:10.1016/j.ejpain.2008.03. 017
Zabalia, M., & Corfec, S. (2008). Reconnaissance des émotions et évaluation de la douleur chez des enfants et adolescents porteurs de trisomie 21 [Emotion recognition and pain assessment in children and adolescents with Down syn-drome]. Enfance, 60, 357–369.doi:10.3917/enf.604.0357
Appendix 1. List of items of the francophone adaptation of the abbreviated form of the MSLSS.
Items of the multidimensional scale of life satisfaction by dimension 1. Mes amis sont gentils avec moi (My friends are nice to me) 2. On s’amuse bien avec moi (I am fun to be around)
3. Il y a beaucoup de choses que je peux bien faire (There are lots of things I can do well)
4. J’apprends beaucoup de choses à l’école (I learn a lot at school) 5. J’aime passer du temps avec mes parents (I like spending time with my
parents)
(Continued)
Continued.
Items of the multidimensional scale of life satisfaction by dimension 6. Ma famille est mieux que la plupart des autres (My family is better than
most)
7. Je pense que je suis beau/belle (I think I am good-looking) 8. Mes amis sont supers (My friends are great)
9. Mes amis m’aideront si j’en ai besoin (My friends will help me if I need it) 10. Je m’aime bien (I like myself)
11. Il y a pleins de choses amusantes à faire où j’habite (There are lots of fun things to do where I live)
12. Mes amis me traitent bien (My friends treat me well) 13. La plupart des gens m’aiment bien (Most people like me)
14. J’aime être à la maison avec ma famille (I enjoy being at home with my family)
15. Les membres de ma famille s’entendent bien ensemble (My family gets along well together)
16. Je suis content d’aller à l’école (I look forward to going to school) 17. Mes parents me traitent bien (My parents treat me fairly) 18. Je me sens bien à l’école (I like being in school) 19. L’école est intéressante (School is interesting)
20. J’aime les activités proposées à l’école (I enjoy school activities) 21. Les membres de ma famille se parlent gentiment les uns aux autres
(Members of my family talk nicely to one another)
22. Je m’amuse beaucoup avec mes amis (I have a lot of fun with my friends)
23. Je fais des choses amusantes avec ma famille (My parents and I do fun things together)
24. J’aime mon quartier (I like my neighbourhood) 25. Je suis une personne agréable (I am a nice person)
26. J’aime essayer faire de nouvelles choses (I like to try new things) 27. Ma maison est agréable (My family’s house is nice)
28. J’aime mes voisins (I like my neighbours) 29. J’ai assez d’amis (I have enough friends) 30. J’aime où je vis (I like where I live)