HAL Id: hal-01007802
https://hal.archives-ouvertes.fr/hal-01007802
Submitted on 3 Apr 2020
HAL is a multi-disciplinary open access
archive for the deposit and dissemination of
sci-entific research documents, whether they are
pub-lished or not. The documents may come from
teaching and research institutions in France or
abroad, or from public or private research centers.
L’archive ouverte pluridisciplinaire HAL, est
destinée au dépôt et à la diffusion de documents
scientifiques de niveau recherche, publiés ou non,
émanant des établissements d’enseignement et de
recherche français ou étrangers, des laboratoires
publics ou privés.
Distributed under a Creative Commons Attribution| 4.0 International License
A signal processing approach for long-term monitoring
of quay structures
Francesca Lanata, Franck Schoefs
To cite this version:
Francesca Lanata, Franck Schoefs. A signal processing approach for long-term monitoring of quay
structures: The case of Genoa harbour. 2nd International Conference on Applications Heritage and
Constructions in Coastal and Marine Environment, MEDACHS’010, 2010, La Rochelle, France.
�hal-01007802�
A Signal Processing Approach for Long-Term
Monitoring of Quay structures: the Case of
Genoa Harbour
Francesca Lanata – Franck Schoefs
GeM, Institute for Research in Civil and Mechanical Engineering, University of Nantes 2 rue de la houssinière, Nantes, France
[email protected] [email protected]
ABSTRACT. The structural monitoring of complex structures like harbour facilities is actually the only way for reaching as close as possible their real in-service behaviour. The paper shows that the interpretation of data from a long-term static monitoring can be very helpful for the comprehension of the structural behaviour under complex interaction structure-environment. The discussion aims at underlining that a scheduled and unique procedure is very hard to define depending on the great variety of the applications and on the right identification of the parameters able to explain structural evolutions or changes. A multi-step algorithm with different signal processing techniques applied in cascade seems to be the only reliable approach. The proposed procedure will be carried out by using available data from the monitoring of a quay wall in the Port of Genoa, in Italy, but it can be generalized to similar structures subjected to cyclic loading.
KEY WORDS: structural identification, signal processing analysis, quay structures, cyclic loading,
statistical analysis.
1. Introduction
For special classes of structures or for specific environmental situations, models used in design practices may not cover the range of problems that need to be solved for assessing the safety conditions of the structure as built. This is particularly true for large structures in aggressive environments, like bridges in coastal or mountain areas and marine structures (Del Grosso 00). In all these cases, observation of the structural behaviour and/or of the environmental parameters with an adequate monitoring system (Structural Health Monitoring) is able to provide the means for covering the gap between the reality and the conceptual models that have been developed for the design, and to obtain a picture of the structure's state and evolution.
The measured quantities during continuous monitoring are typically displacements or strains under operational and environmental loads and they have to be measured in the long
the case of Genoa harbour", Proceeding of 2nd International Conference on Applications Heritage and Constructions in Coastal and Marine Environment, (MEDACHS’010), session Non
Destructive Testing – Session1, paper #33, 8 pages, 28-30 April 2010, La Rochelle (LEPTIAB), France (2010).
MEDACHS 10 La Rochelle, France
period to be considered representative of the real behaviour of the undamaged structure. In particular for large structural systems interacting with their environment, safety and operability of the system depend on phenomena involving not only structural behaviour, but also coupled structure-environment response. Moreover, due to the inherent geometrical and physical complexity of the problem, model-based diagnosis can be seldom invoked, and translation of measurement data into valuable information shall be based mostly on engineering judgement and on mathematical processing of the instrumentation signals. In addition, when monitoring systems are installed not at the beginning of the life-cycle of the structure but at a later stage (repair for instance), major modifications of the structural system may have occurred because of the effect of loads and other external agents, or because of human intervention. This aspect has a great influence on data analysis and interpretation, because of the greater role that uncertainties do play in this case.
The automatic detection of damages from continuous static monitoring is still a challenge. Practitioners have difficulties in choosing the best method for each particular application. The applied approaches include model-based interpretation, statistical system identification and signal processing for the recognition of typical response features but scientifically, the most successful methods are not identified yet.
In the following, the discussion on the complexity of data processing will be carried on by means of available data from long-term monitoring of a quay wall in the Port of Genoa, in Italy (Del Grosso et al., 2007). The work emphasizes the preliminary steps aimed at understanding the mechanical response of such a complex structure under operational and environmental loads in terms of representative features of the quay. In particular, focus will be placed on the monitoring of evolutionary phenomena, taking place in structures as a result of the interaction with the environment and operational loads. Due to the huge amount of instrumented blocks, in this application the statistical analysis has proved to be successful for the identification of the typical response features. The first steps of the data processing and an example of reliability analysis will be presented.
2. The San Giorgio pier 2.1. The monitoring program
The San Giorgio pier is used for coal import and it has been subjected to a retrofitting programme in order to increase the water depth of the nearby basin. The facility has been built in the 1920s and the vertical walls delimiting the quays are made of heavy concrete blocks. Dredging has required strengthening of the wall: the structure has been underpinned with jet-grouting columns, and the blocks have been connected by means of vertical steel rods. Stability has been improved with permanent active tendons installed along the entire length of the pier (Del Grosso et al., 2000).
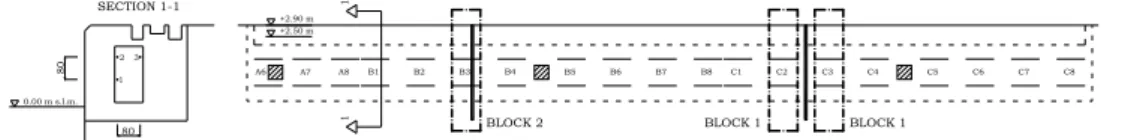
The crown block of the San Giorgio Pier was equipped in 1999 with an array of 67 SOFO fibre optic strain sensors, located in a service tunnel along the top blocks, in such a way to have 3 sensors in 24 measuring sections, named measuring blocks in the following,
as represented in the block cross section (left) and in the schematic longitudinal view (right) of figure 1. Each sensor has an active length of 10 metres. The monitoring had the goal to detect possible distress caused by the dredging activity in the adjacent basin and also to run a long-term health monitoring experience, as a first step of a larger project aimed at establishing a decision support system for maintenance operations of the Port facilities (Del Grosso et al., 2007). 1 1 +2.90 m +2.50 m C8 C7 C6 C5 C4 C3 C2 C1 B8 B7 B6 B5 B4 B3 B2 B1 A8 A7 A6 0.00 m s.l.m. SECTION 1-1 1 2 3 80
80 BLOCK 2 BLOCK 1 BLOCK 1
Figure 1. Sensors installation along the quay for 19 measuring blocks (right) and block
cross section (left) with sensors position inside the service tunnel (measurements in cm). The thick vertical lines represent two possible locations of dilatation joints along the pier.
Acquisition campaigns were programmed four times a day, in order to analyse the main variations of temperature during 24 hours (by day and by night) and with greater reason, weekly and seasonal variations. The system was fully operational for four years (from November 1999 to October 2004), with the exception of some interruptions due to the maintenance operations of the system and other management reasons. This monitoring time is a common lifetime for operational systems near the sea (Yàñez-Godoy et al., 2008).
2.2. Mechanical behaviour
In order to choose the best approach for data interpretation, it is useful to understand if the structure has a well-defined mechanical behaviour and if damage mechanisms can be clearly described. The different layers of blocks are linked each other just thanks to the gravity force. After the reinforcement works, the blocks should have a higher connection rate due to the distributed vertical steel rods. For these reasons, it can be supposed that the structure behaves as a monolithic structure, so that great displacements interesting the underwater layers are transferred to the superior layers until the crown block. Indeed, the installed monitoring system is able to measure the displacements of the crown block.
On the other hand, the crown block can experience itself small displacements induced by the external temperature variations and the sea level changes. The relative displacements between blocks are allowed thanks to the presence of dilatation joints along the pier (figure 1). However, the conditions and the position of joints are unknown because most of them are completely filled by coal dusts and it is not clear if they behave properly as dilatation joints. In addition, the crown block should not be allowed to freely expand with thermal variations due to the continuous support of the lower block.
MEDACHS 10 La Rochelle, France
It can be concluded that the structure under investigation is strongly non-homogeneous due to the interactions between old structural elements and new strengthening elements. The structure is characterized by spatial and behavioural complexity and possible variations in the structural behaviour are expected to occur as a result of complex phenomena. The study of a reliable numerical model of the pier is very complex and it would require a lot of hypothesis and simplifications. Data interpretation will have to resort to statistical algorithms for gathering some information on the structural behaviour.
2.3. Key factors for data analysis
Fixed marine structures are primarily designed to withstand environmental and operational forces. The main phenomena in the marine environment able to produce changes in the structural response and loss of functionality can be:
- corrosion of steel and degradation of concrete and other materials; - cranes movements and operations that can cause overloads on the quays; - interaction with the sea actions, for example tide and wave actions; - moored ships, also in case of collision;
- interaction with environmental parameters, such as temperature, solar radiation, wind. Internal structures in a port environment, such as piers, docks, berths, dolphins, transportation facilities and buildings, are not usually designed to withstand sea actions, because wave actions are absorbed by the protection facilities. In addition, tides are not a phenomenon interesting the Mediterranean area and for this reason they have not been considered as a key factor for the San Giorgio pier analysis.
The relationship between the measured strains and the presence of the moored ship has been investigated. It is also related to the cranes operations for the goods uploading and downloading. No clear correlation with the moored ships has been identified. On the contrary, the strain time histories show that a strong correlation with thermal variations exists and the following analysis will be mainly focused on temperature actions.
3. Classification of blocks behaviour
The analysis has been focused on the two first years of measurements, because they are almost complete (603 data missing on a total of 3776 measurements). The measurement campaigns with some data missing have simply not been considered in the analysis and they are assumed not to alter the results. This assumption is rather consistent because the data missing are not concentrated in the same time period.
- the behaviour in the direction normal to the block cross-section mainly due to dilatation. It can be assumed that this behaviour is homogeneous for all measuring blocks because the sensors have the same orientation and position inside the blocks (figure 1);
- the bending behaviour of vertical (own weight and operational loads) and horizontal (operational loads) axis.
The presence of dilatation joints has come to light from data analysis, but their position along the structure cannot be exactly determined. Figure 1 shows two possible positions of dilatation joints: the first one is crossing a measuring block (block 2), while the second one is located between two monolithic measuring blocks (named blocks 1).
Sensor readings can be put in strict correlation with temperature variations, but different measuring blocks respond to temperature changes in a different way. In particular, measuring blocks containing dilatation joints (blocks 2) give responses out-of-phase with respect to temperature variation, while monolithic measuring blocks (blocks 1) give responses in-phase and characterize the reduction of the joint space. On the other hand, measuring blocks containing joints measure dilatation of blocks.
The correlation indices between the time histories of deformation and temperature have been studied. Time dependence of correlation indices (t0,t)between sensors located in
the same position along the quay (all sensors in location 1 for examples) and between sensors in the same measuring block (sensors in location 1, 2 and 3 for each measuring block, figure 1) are computed using the following formula:
) , ( ) , ( ) , ( ), , ( cov ) , ( ), , ( ) , ( 0 0 0 0 0 0 0 t t t t t t S t t S t t S t t S corr t t b a b a b a [1]
where Sa and Sb are the vectors of time histories sensor-sensor or temperature-sensor from t0 (beginning of data acquisition) to time t, cov, σa and σb are the covariance and the
standard deviations of the two time series respectively. The variation in time of the correlation index has been computed by using for each instant time t the vectors containing all the previous measurements.
The analysis of correlation indices has been used to identify two main classes of measuring blocks with the same structural behaviour:
TYPE 1 – high correlation indices between sensors in the same block and also with temperature, that plays the most important role in the structural response (fair bending behaviour, monolithic blocks like blocks 1 of figure 1).
TYPE 2 – high correlation indices between sensors in the same block and also with temperature, but out-of-phase (negative correlation). The temperature plays the most important role in the structural response, but this block contains a joint and it is not a monolithic block (for example block 2 of figure 1).
Mechanical behaviour of blocks of type 2 will be deepened in the following; the representative feature will be used to perform a reliability analysis on the joint width.
MEDACHS 10 La Rochelle, France
4. Representative feature for blocks of type 2 4.1. Characterization of dilatation joints
For measuring blocks of type 2 the parameter able to describe the mechanical response is the variation in the joint opening lj under temperature variations. This parameter can
be estimated knowing the strain measure in the block with joint (measj(type2)) and assuming
that the two integer blocks across the joint (block 2 on the right of the joint and block 2 on the left of the joint, figure 1) have the same behaviour of the blocks without joints.
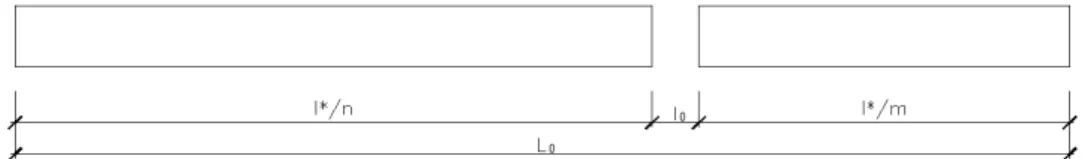
Figure 2 reports a block of type 2 in the reference state (out-of-scale). L0 is the initial
length of the block between two measurement points, in this case 10 metres. The two monolithic blocks across the joint have unknown length but the strain of the blocks of total length l is supposed to be proportional to the strain measured in the reference measuring * block of type 1. l0 is the initial opening of the dilatation joint (unknown).
Figure 2. Scheme of a measuring block containing a joint in the initial configuration. The
ratio n and m satisfies the following relation: 1/n + 1/m = 1, and L0 l0 l*.
Let’s now consider an increasing in temperature starting from this initial configuration. The block of initial length L0 will be subjected to a shortening L (as observed from
measurements of blocks of type 2), while the monolithic blocks of total length *l will
increase their length of l as a block of type 1. As a consequence, the opening of the * dilatation joint will decrease of lj. These length variations satisfy the relation
*
l l
L j .
For each measurement session j:
*
* 1 l
l type [2]
where type1 measj(type1) L0 and l* L0 l0. From the previous relations, and knowing
that L type2 L0, it is possible to obtain the variation in the joint opening:
1 0 ) 1 ( ) 2
(type jtype type j
j meas meas l
where measj(type2) is the current measurement (in mm) in a generic block of type 2. The
term related to the initial opening of the joint can be neglected because l* l0 and the
relation can be finally simplified:
) 1 ( ) 2 (type jtype j j meas meas l [4] 4.2. Reliability analysis
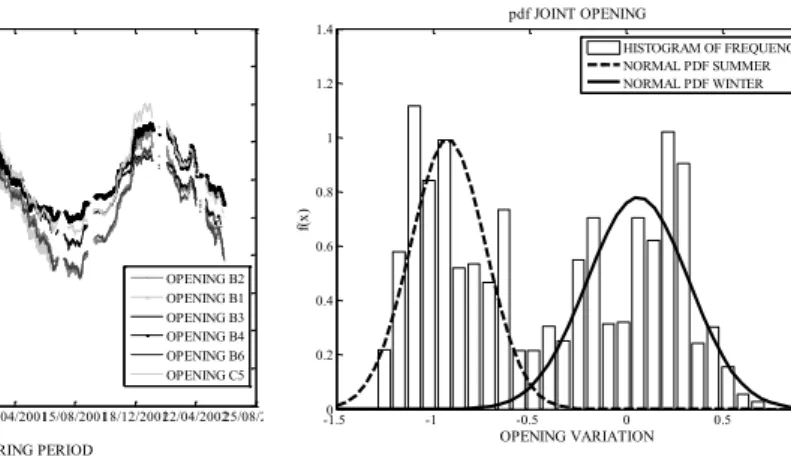
The comparison of the computed joint opening variation for the measuring blocks of type 2 is reported in figure 3. The plot shows that the joint opening trend is the same for all the considered blocks during the first monitoring period, with a divergence while increasing the time. The joint opening variation can be considered as a random variable of a stationary process because all the measuring blocks have a similar behaviour.
A statistical analysis has been performed, in order to obtain a reliability analysis on the joint width. Due to the fact that the density histogram can be considered as a bimodal distribution, two samples of data have been considered: the values registered during the summer and the ones measured during the winter. The normal distribution is able to well describe the behaviour of the two samples. Figure 4 shows the probability density function for measuring blocks of type 2. From the fitted density functions, the probability that the measured joint opening is lower than the initial joint opening l0 can be computed for having
the probability of failure of the pier due to an inadequate initial joint design (limit state). With reference to the figure 4, the probability of failure can be computed as:
summer P summer l l P P l l P l l P Pf j 0 j 0|winter winter j 0| [5]
where the probability to have conditions like in winter or summer is related to the number of measurements in winter or summer in relation with the total number of measurements. Table 1 reports an example of the assessed failure probabilities related to different values of the initial joint opening l0.
5. Conclusions
The work aims at giving a general procedure for the data interpretation from a continuous monitoring of complex structures. This kind of monitoring system is able to produce time-histories that are proved to be very useful for the comprehension of the structural behaviour under complex interaction structure-environment. The presented example wants to show the complexity of the data processing from long-term monitoring and to put into evidence that an optimal and unique algorithm cannot be proposed depending on the variety of applications. A multi-algorithm approach is considered to be the best tool for understanding the structural behaviour and for defining response features. The work emphasizes the preliminary steps aimed at understanding the mechanical
MEDACHS 10 La Rochelle, France
response of such a structure under operational and environmental loads. It is discussed that the complex interaction with environmental temperature has to be taken into account too. This initial phase helps to identify typical response features that can be used for further reliability analysis or for damage identification.
30/11/199902/04/200005/08/200008/12/200012/04/200115/08/200118/12/200122/04/200225/08/2002-3 -2.5 -2 -1.5 -1 -0.5 0 0.5 1 1.5 2 MONITORING PERIOD JO IN T O P E N IN G V A R IA T IO N [ m m ] OPENING B2 OPENING B1 OPENING B3 OPENING B4 OPENING B6 OPENING C5 -1.50 -1 -0.5 0 0.5 1 0.2 0.4 0.6 0.8 1 1.2 1.4 pdf JOINT OPENING f(x ) OPENING VARIATION HISTOGRAM OF FREQUENCY NORMAL PDF SUMMER NORMAL PDF WINTER
Figure 3. Joint opening variation for blocks
of type 2.
Figure 4. Probability density function of the
joint opening variation for blocks of type 2.
Table 1. Probability of failure due to insufficient dilatation joint width.
l0 = 3 mm l0 = 2 mm l0 = 1 mm Pf < 10-10 8 x 10⁻⁹ 1.70 x 10⁻¹
6. References
Del Grosso A., “Monitoring of infrastructure in the marine environment”, 3rd
International Workshop on Structural Control, Paris, July 6-8, 2000, World Scientific, p. 107-117.
Del Grosso A., Lanata F., Brunetti G., Pieracci A., “Structural Health Monitoring of harbour piers”,
3rd International Conference on Structural Health Monitoring of Intelligent Infrastructure
SHMII-3 2007, Vancouver, November 1SHMII-3-16, 2007.
Yáñez-Godoy H., Schoefs F., Casari P., “Statistical Analysis of the Effects of Building Conditions on the Initial Loadings of On-piles Quays”, Structural Health Monitoring, vol. 7 no. 3, 2008, p. 245-263.
Del Grosso A., Inaudi D., Lanata, F., “Strain and Displacement Monitoring of a Quay Wall in the Port of Genoa by Means of Fibre Optic Sensors”, 2nd European Conference on Structural Control,