HAL Id: ineris-00973622
https://hal-ineris.archives-ouvertes.fr/ineris-00973622
Submitted on 4 Apr 2014HAL is a multi-disciplinary open access archive for the deposit and dissemination of sci-entific research documents, whether they are pub-lished or not. The documents may come from teaching and research institutions in France or abroad, or from public or private research centers.
L’archive ouverte pluridisciplinaire HAL, est destinée au dépôt et à la diffusion de documents scientifiques de niveau recherche, publiés ou non, émanant des établissements d’enseignement et de recherche français ou étrangers, des laboratoires publics ou privés.
Spatial representativeness of an air quality monitoring
station. Application to NO2 in urban areas
Maxime Beauchamp, Laure Malherbe, Laurent Letinois, Chantal de Fouquet
To cite this version:
Maxime Beauchamp, Laure Malherbe, Laurent Letinois, Chantal de Fouquet. Spatial representative-ness of an air quality monitoring station. Application to NO2 in urban areas. European Regional TIES Conference ”Spatial Data Methods for Environmental and Ecological Processes -2. Edition”, Sep 2011, Foggia, Italy. pp.NC. �ineris-00973622�
Spatial representativeness
of an air quality monitoring station. Application to
NO
2in urban areas.
Maxime Beauchamp
a, Laure Malherbe
a, Laurent Létinois
aa : Institut National de l'Environnement Industriel et des Risques (INERIS), Direction des risques chroniques, Parc Technologique Alata, 60550 Verneuil-en-Halatte, France
Chantal de Fouquet
bb : Equipe géostatistique, centre de géosciences, Mines ParisTech, 35 rue Saint Honoré, 77305 Fontainebleau, France
Abstract: The present study aims at setting up a geostatistical methodology that could
be implemented in an operational context to assess the spatial representativeness of a measurement station. In the proposed definition, a point is considered as belonging to the area of representativeness of a station if its concentration differs from the station measurement by less than a given threshold. Additional criteria related to distance or environmental characteristics may also be introduced.
Concentrations are first estimated at each point of the domain applying kriging techniques to passive sampling data obtained from measurement surveys. The standard deviation of the estimation error is then used, making a hypothesis on the error distribution, to select the points, at a fixed risk, where the difference of concentration with respect to the station is below the threshold.
The methodology is then applied to NO2 experimental datasets for different French cities.
Keywords: geostatistics; kriging; spatial representativeness; nitrogen dioxide (NO2).
1. Introduction
Local agencies in charge of air quality monitoring are concerned with assessing the geographical areas in which concentrations may be assumed similar to those measured by monitoring stations.
Spatial representativeness of a monitoring site is a recurrent notion that appears in European regulatory requirements on air quality but has not been precisely defined so far. A definition will be proposed and its practical implementation will lead to the production of maps to characterize areas represented by the stations.
2. Materials and Methods
First, an estimation of the NO2 annual average of the background pollution is provided at each point of the domain applying kriging techniques to passive sampling surveys data. High resolution auxiliary variables, like the NOx emissions density in a 2km radius are also used as external drift.
A first approach to define the area of representativeness of a monitoring station located in is to consider all the sites where the concentrations are sufficiently close to the station measurement, which implies the introduction of a threshold notion [2][3][4]:
Let’s consider the estimation error of the pollution . We don’t take
the measurement error at the station into account.
(E.2)
A sufficient condition for (E.2) is:
(E.3)
We introduce the statistical risk that the concentration of a point considered in the area of representativeness of differs from the station measurement by more than the given threshold :
(E.4)
Then, making a Gaussian hypothesis on the error distribution, the standard deviation of the estimation error is used to select the points in the area of representativeness:
(E.5)
In this approach, a point can be considered as belonging to several areas of representativeness. So, additional criteria related to distance, minimal deviation of concentration, or environmental features are introduced to make a point belong to a unique station.
Local scale also enables to estimate concentrations taking traffic-related pollution into account: distance to the road, traffic-related NOx emissions, or road traffic informations can be considered to develop and improve a model.
3. Results
To illustrate the results of the methodology, passive sampling data provided by a survey carried out in the French city of Montpellier in 2007 are used.
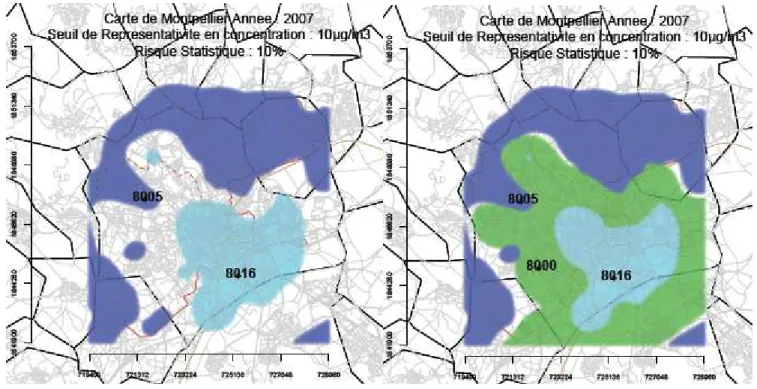
Area of the monitoring site 8005 Area of the monitoring site 8016 Area of the new monitoring site
Figure 1: Areas of representativeness of the background monitoring sites for the French
city of Montpellier in 2007, for a threshold of 10µg/m3 and a risk fixed at 10% Figure 1 shows the application of the method on the background pollution for a threshold of 10µg/m3 and a statistical risk fixed at 10%. Two areas of representativeness can be obtained: a first one for the downtown pollution and a second one for the suburb pollution.
Results can be helpful in providing some recommendations for setting up new fixed monitoring sites. In this case, sampling passive data can be used to find an appropriate site where the concentration of NO2 is the most representative of the missing information.
4. Concluding remarks
Application of the method for background pollution using analyzed data of NO2 annual concentrations produced on national scale shows its sensitivity to the criterion selected to remove intersections between representativeness areas. Stability in time of the areas is also related to variations of concentrations on the domain.
This study underlines the difficulty to set up a reliable traffic-related pollution model and the influence of the passive sampling data location on the quality of the model.
results of Chilès and Delfiner under a continuous and unimodal distribution error [5] are envisaged.
References
[1] ADEME (2002). Classification et critères d’implantation des stations de surveillance de la qualité de l’air.
[2] Bobbia M., Cori A., De Fouquet C. (2008). Représentativité spatiale d’une station de mesure de la pollution atmosphérique. Pollution Atmosphérique N°197.
[3] Cori A. (2005). Représentativité spatiale des stations de mesure de la concentration moyenne annuelle en NO2. Rapport de stage. École des Mines de Paris.
[4] Cardenas G. et Malherbe L. (2007). Représentativité des stations de mesure du réseau national de surveillance de la qualité de l’air. Application des méthodes géostatistiques à l’évaluation de la représentativité spatiale des stations de mesure de NO2 et O3.
Report available at www.lcsqa.org.
[5] Chilès J-P and Delfiner P. (1999). Geostatistics: Modeling Spatial Uncertainty. Wiley Series in Probability and Mathematical Statistics, 695 p.