HAL Id: inserm-00170726
https://www.hal.inserm.fr/inserm-00170726
Submitted on 1 Sep 2008HAL is a multi-disciplinary open access
archive for the deposit and dissemination of sci-entific research documents, whether they are pub-lished or not. The documents may come from teaching and research institutions in France or abroad, or from public or private research centers.
L’archive ouverte pluridisciplinaire HAL, est destinée au dépôt et à la diffusion de documents scientifiques de niveau recherche, publiés ou non, émanant des établissements d’enseignement et de recherche français ou étrangers, des laboratoires publics ou privés.
HIV-infected adults with a CD4 cell count greater than
500 cells/mm3 on long-term combination antiretroviral
therapy reach same mortality rates as the general
population.
Charlotte Lewden, Geneviève Chêne, Philippe Morlat, Francois Raffi, Michel
Dupon, Pierre Dellamonica, Jean-Luc Pellegrin, Christine Katlama, Francois
Dabis, Catherine Leport
To cite this version:
Charlotte Lewden, Geneviève Chêne, Philippe Morlat, Francois Raffi, Michel Dupon, et al.. HIV-infected adults with a CD4 cell count greater than 500 cells/mm3 on long-term combination antiretroviral therapy reach same mortality rates as the general population.. Journal of Ac-quired Immune Deficiency Syndromes, Lippincott, Williams & Wilkins, 2007, 46 (1), pp.72-7. �10.1097/QAI.0b013e318134257a�. �inserm-00170726�
AQUITAINE cohorts, 1997-2005, overall and according to gender, HIV transmission group and co-infection by hepatitis C virus at baseline. N Median follow-up (years) (interquartile range, IQR) Person-years (PY) Deaths (n) Rates (/100 PY) (95% CI) SMR (95% CI) Overall 2435 6.8 (4.1-7.9) 13954 288 2.1 (1.8-2.3) 7.0 (6.2-7.8) Men 1864 6.9 (4.1-7.9) 10777 226 2.1 (1.8-2.4) 4.8 (4.2-5.5) Women 571 6.5 (3.9-7.8) 3177 62 2.0 (1.5-2.4) 13.0 (10.0-16.7) Hepatitis C positive 574 6.4 (3.6-7.8) 3163 99 3.1 (2.5-3.7) 13.9 (11.3-17.0) negative 1434 7.0 (4.4-7.9) 8519 120 1.4 (1.2-1.7) 4.4 (3.6-5.2)
HIV transmission group
injecting drug users 527 6.2 (3.2-7.8) 2849 93 3.3 (2.6-3.9) 16.3 (13.2-20.0)
others 1908 6.9 (4.2-7.9) 11104 195 1.8 (1.5-2.0) 5.5 (4.7-6.3)
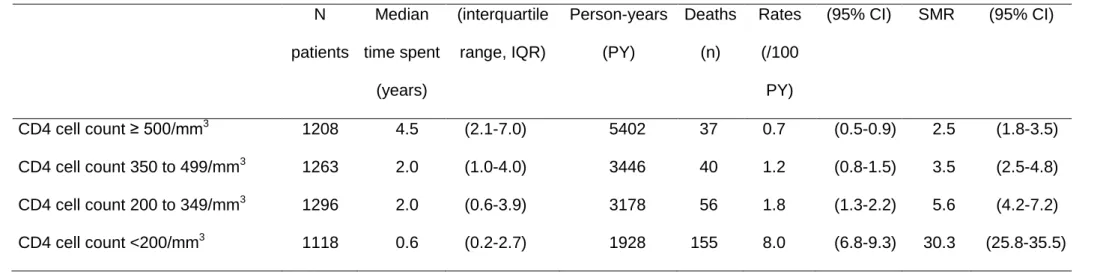
Table 2. Mortality rates and standardized mortality ratio (SMR) in HIV-infected adults, ANRS CO8 APROCO-COPILOTE and ANRS CO3 AQUITAINE cohorts, 1997-2005, according to cumulated time spent within each category of CD4 cell count.
N patients Median time spent (years) (interquartile range, IQR) Person-years (PY) Deaths (n) Rates (/100 PY) (95% CI) SMR (95% CI) CD4 cell count ≥ 500/mm3 1208 4.5 (2.1-7.0) 5402 37 0.7 (0.5-0.9) 2.5 (1.8-3.5) CD4 cell count 350 to 499/mm3 1263 2.0 (1.0-4.0) 3446 40 1.2 (0.8-1.5) 3.5 (2.5-4.8) CD4 cell count 200 to 349/mm3 1296 2.0 (0.6-3.9) 3178 56 1.8 (1.3-2.2) 5.6 (4.2-7.2) CD4 cell count <200/mm3 1118 0.6 (0.2-2.7) 1928 155 8.0 (6.8-9.3) 30.3 (25.8-35.5)
1997-2005, according to cumulated time spent with CD4 cell count ≥ 500 /mm3
, after the time of truncation§. Time of
truncation§ after initiation of cART (year)
Total Patients with CD4 ≥ 500 /mm3 after the time of truncation
N patients Person-years (PY) Deaths (n) N patients Median time spent (years) (interquartile range, IQR) PY Deaths (n) Rates (/100 PY) (95% CI) SMR (95% CI) 0 2435 13954 288 1208 4.5 (2.1-7.0) 5402 37 0.7 (0.5-0.9) 2.5 (1.8-3.5) 1 2182 11685 208 1156 4.2 (2.1-6.4) 4817 29 0.6 (0.4-0.8) 2.1 (1.4-3.1) 2 2065 9561 176 1083 4.0 (2.1-5.6) 4080 26 0.6 (0.4-0.9) 2.2 (1.4-3.2) 3 1949 7551 141 1031 3.5 (1.8-4.8) 3345 22 0.7 (0.4-0.9) 2.1 (1.3-3.2) 4 1835 5660 108 967 3.0 (1.5-3.8) 2606 18 0.7 (0.4-1.0) 2.1 (1.3-3.4) 5 1648 3915 62 864 2.4 (1.4-3.0) 1880 12 0.6 (0.3-1.0) 1.9 (1.0-3.2) 6 1430 2389 25 763 1.6 (1.0-2.2) 1189 2 0.2 (0.0-0.4) 0.5 (0.1-1.6) 7 1143 1084 6 610 0.9 (0.5-1.3) 543 1 0.2 (0.0-0.5) 0.5 (0.0-2.6)
§truncation: the time period taken into account starts 1, 2, 3,… years after initiation of cART
Table 4. Mortality rates and standardized mortality ratio (SMR) in HIV-infected adults, ANRS CO8 APROCO-COPILOTE and ANRS CO3 AQUITAINE cohorts, 1997-2005, according to time spent with CD4 cell count between 350 and 499 /mm3, after the time of truncation§.
Time of truncation§
after initiation of cART (year)
Total Patients with CD4 350 to 499 /mm3 after the time of truncation
N patients Person-years (PY) Deaths (n) N patients Median time spent (years) (interquartile range, IQR) PY Deaths (n) Rates (/100 PY) (95% CI) SMR (95% CI) 0 2435 13954 288 1263 2.0 (1.0-4.0) 3446 40 1.2 (0.8-1.5) 3.5 (2.5-4.8) 1 2182 11685 208 1036 2.5 (1.4-4.0) 2960 35 1.2 (0.8-1.6) 3.4 (2.4-4.8) 2 2065 9561 176 915 2.2 (1.4-3.7) 2434 29 1.2 (0.8-1.6) 3.3 (2.2-4.7) 3 1949 7551 141 816 2.0 (1.1-3.4) 1925 26 1.4 (0.8-1.9) 3.6 (2.3-5.2) 4 1835 5660 108 705 1.9 (1.0-3.0) 1430 20 1.4 (0.8-2.0) 3.5 (2.2-5.5) 5 1648 3915 62 557 1.7 (0.8-2.7) 971 10 1.0 (0.4-1.7) 2.5 (1.2-4.6) 6 1430 2389 25 410 1.5 (0.7-2.0) 572 5 0.9 (0.1-1.6) 2.0 (0.7-4.8) 7 1143 1084 6 286 0.8 (0.5-1.3) 257 2 0.8 (0.0-1.9) 1.9 (0.2-6.7)
§truncation: the time period taken into account starts 1, 2, 3,… years after initiation of cART