Science Arts & Métiers (SAM)
is an open access repository that collects the work of Arts et Métiers Institute of Technology researchers and makes it freely available over the web where possible.
This is an author-deposited version published in: https://sam.ensam.eu
Handle ID: .http://hdl.handle.net/10985/19397
To cite this version :
Mariem YAICH, Yessine AYED, Zoubeir BOUAZIZ, Guénaël GERMAIN - A 2D finite element analysis of the effect of numerical parameters on the reliability of Ti6Al4V machining modeling -Machining Science and Technology - Vol. 24, n°4, p.509-543 - 2020
Any correspondence concerning this service should be sent to the repository Administrator : archiveouverte@ensam.eu
A 2D finite element analysis of the effect of numerical parameters on the
reliability of Ti6Al4V machining modeling
M.Yaicha,b,*, Y.Ayeda, Z.Bouazizb, G.Germaina
a Arts et Métiers ParisTech, LAMPA, 2 bd du Ronceray, 49035 Angers CEDEX, France
b Université de Sfax, Ecole Nationale d’Ingénieurs de Sfax, Laboratoire de Mécanique des Fluides Appliquées, Génie des Procédés et Environnement, LR11ES57, 3 038 Sfax, Tunisia
Abstract
The numerical analysis, based on the finite element modeling (FEM), presents nowadays an efficient computational tool. It allows a better understanding of several thermo-mechanical phenomena involved during the machining process. However, its reliability heavily depends on the accurate definition of the numerical model. In this regard, a FE analysis focused on the 2D modeling of the Ti6Al4V dry orthogonal machining was carried out in this study. The relevance of different numerical meshing approaches and finite elements topologies was studied. The effect of the friction coefficient on the numerical chip morphology, its geometry, the cutting and the feed forces was investigated. The current study underlined the adequacy of the several compared adaptive meshing approaches, in terms of the modeling of severe contact conditions taking place around the cutting-edge radius. However, numerical serrated chips, closer to the experimental ones, were only predicted when the pure Lagrangian formulation was adopted and a proper determination of the failure energy was carried out. The definition of different mesh topologies highlighted the efficiency of the 4-node quadrangular mesh, with a suitable edge length, in increasing the agreement with the experimental data, while reducing the computing times.
Keywords: Ti6Al4V; modeling; machining; segmentation; remeshing; ALE formulation.
Introduction
Several phenomena are involved during the machining process. The workpiece material is subjected to important temperatures, strain rates, dislocations motion, microstructure changes, etc. In addition, significant levels of friction in the contact interfaces, followed by a local increase of the temperature, are reached. Therefore, the adoption of advanced experimental
problematic. Therefore, theoretical methods (e.g. analytical, numerical and hybrid models) are required, in addition to the experimental tests.
Although significant improvements have been made to analytical approaches, these latter are still unable to well reproduce the non-stationary problems (Bahi et al., 2012; Egaña et al.; 2012), and thereby to investigate the transient phenomena, like the chip segmentation. Indeed, the definition of numerical approaches has been deeply encouraged. The finite element modeling (FEM) presents nowadays an efficient way to predict the nonlinear behavior of the machined material. It has been considered as advantageous since it provides complementary and valuable local information (like the crack propagation, the non-homogeneous distribution of plastic strains and temperatures, etc.), which is difficult to ensure with the experimental tests, as highlighted by Daoud et al. (Daoud et al.; 2015). Furthermore, the availability of several advanced FE codes has led to the wide spread adoption of numerical approaches. However, an adequate definition of numerical models has still been required to increase the reliability of the FE analysis. Several investigations of the literature have been focused on the effect of constitutive models (Chen et al., 2016; Liu et al., 2013; Shrot and Bäker, 2012; Yaich et al., 2017; Che et al., 2018) and friction contact criteria (Haddag et al., 2016; Haglund et al., 2008; Zhang et al., 2011). Contrariwise, less attention has been paid to the effect of numerical parameters on the FEM reliability.
In the literature, many commercial codes (Abaqus®, AdvantEdge®, Deform®, Forge®, etc.) have been used to model the machining process (Daoud et al., 2015; Ambati and Yuan, 2011; Barge et al., 2005; Calamaz et al., 2010; Ducobu et al., 2017; Fourment and Delalondre, 2008). Different methods, implemented in these FE codes, have been adopted to handle the space and the time problems related to the material deformation. The temporal integration scheme (Implicit or Explicit scheme), the meshing techniques (adaptive or non-adaptive meshing approaches) and the FE properties (elements size, type, interpolation function, etc.), which heavily differ from one software to another, have deeply influenced the computed results. Therefore, an accurate adjustment of these numerical parameters, particularly the most affecting ones, has still been required to increase the reliability of the FE analysis.
The effect of the mesh size on well reproducing the initial model geometry and the changes undergone by the workpiece material has been widely investigated in the literature (Ambati and Yuan, 2011; Barge et al., 2005; Ducobu et al., 2017; Hortig and Svendsen, 2007; Zhang et al., 2011). Hortig and Svendsen (Hortig and Svendsen, 2007) have underlined the sensitivity of computed results to the mesh density and the elements orientation angle. An increase of the segmentation frequency and a decrease of the shear bands width have been pointed out in this study. On the other hand, Ambati and Yuan (Ambati and Yuan, 2011) have highlighted the low sensitivity of the average computed forces to the FE size. However, a more pronounced effect of the mesh density on the instantaneous computed forces has been noted. The authors have emphasized that the coarser the mesh discretizing the damaged zones is, the higher the cutting forces oscillations are.
Despite the significant sensitivity of the FEM to the mesh density, no clear guidelines of the model discretization have been provided in the literature review. Quantitative comparisons between the experimental and the numerical chip geometries had to be conducted, in order to carefully determine the effect of the mesh on the FE analysis reliability. In addition, the
sensitivity of the machining modeling to the FE topology (the elements type, the use of full or reduced integration, the number of nodes per element, etc.) has been neglected.
The modeling of machining also depends on the meshing approaches. In the literature review, three FE formulations have been used: the Eulerian (Eul) formulation, the Lagrangian (Lag) formulation and the adaptive meshing approaches (e.g. the Arbitrary Lagrangian Eulerian (ALE) approach, the Coupled Eulerian-Lagrangian (CEL) approach, the remeshing technique, etc.). The first approaches that have been used in the literature are the Eul and the Lag formulations. The former is characterized by the prohibited motion of the mesh. Otherwise, the computational grid is embedded in the space whereas the material flows through the model geometry. Indeed, this formulation has been generally adopted in the case of a steady-state analysis, thus for the modeling of a continuous chip (Calamaz et al., 2010). However, the prediction of different chip morphologies has been enabled with the Lag approach. This FE formulation is mainly characterized by the allowed mesh nodes’ motion in agreement with the displacements of material points (Ducobu et al., 2017). Nonetheless, despite the definition of realistic failure criteria, this numerical approach has still been unable to solve the mesh distortion problems, mainly encountered when high nonlinearities (e.g. the machining process of metals) are involved (Ducobu et al., 2017). To overcome the numerical problems related to the Eul and the Lag formulations, a relatively new technique embodied by the ALE meshing approach has been adopted in the literature. It consists of maintaining the advantages of both approaches while avoiding their drawbacks. This adaptive meshing technique consists in maintaining the same density of the initially defined mesh, while allowing the relocation of the elements’ nodes. Therefore, the mesh connectivity is kept; and only an update of the data is required. The definition of the ALE meshing approach has been performed in the case of the prediction of a continuous chip (Ozel and Zeren, 2007; Ducobu et al., 2017). Its adequacy in terms of reducing the mesh distortion problems, and thereby the modeling of more important cutting times, has encouraged its definition in the analysis of different aspects including, but limited to, the residual stresses and the temperatures (Miguélez et al., 2009; Miguélez et al., 2009-a; Muñoz-Sánchez et al. 2011). The prediction of the material deformation, without altering the mesh connectivity or requiring the definition of any damage criterion, have been enabled with this adaptive meshing approach (Shrot and Bäker, 2012; Hortig and Svendsen, 2007). However, its main limitation was the unobvious determination of its most appropriate parameters (e.g. the frequency of nodes relocation) (Miguélez et al., 2009). Moreover, its ability to predict the chip segmentation has still been questionable. In the numerical analysis of Ducobu et al. (Ducobu et al., 2014), only wavy chip morphology has been simulated, when the ALE formulation and the hyperbolic tangent (TANH) law, proposed by Calamaz et al. (Calamaz et al., 2008), have been adopted to model the Ti6Al4V machining. Contrariwise, a well segmented chip, closer to the experimental one, has been predicted in the same numerical study, when the
law has been used to predict the workpiece material behavior. Contrariwise, the modeling of the Ti6Al4V machining has resulted in low numerical segmented chip, when the ALE formulation implemented in the software Abaqus® has been defined (Ducobu et al., 2014). Despite the interesting advantages of the remeshing techniques, the creation of an updated mesh remains problematic. It alters the mesh connectivity. The initial mesh density, thus the elements size, either increases or decreases during the modeling, depending on the instantaneous loading conditions. Therefore, the data is not only updated, but also transferred from the old mesh to the new created one, which influences the precision of computed (interpolated) results.
In conclusion, the literature review has pointed out the possibility of defining several numerical parameters, even in the same commercial code, to model the machining process of the same workpiece material. This has generally induced a pronounced mismatch between the numerical results, for the same cutting condition. In this regard, the current study focuses on investigating the sensitivity of numerical analysis reliability to the meshing approach and the finite elements topology. The two-dimensional (2D) modeling of the dry orthogonal machining of the Ti6Al4V titanium alloy is carried out. The thermo-visco-plastic-damage models (Johnson and Cook, 1983; Johnson and Cook, 1985; Hillerborg et al., 1976) are used to reproduce the workpiece material behavior. A set of comparisons with the experimental data of the literature (Calamaz et al., 2010; Calamaz, 2008) is performed to determine the most appropriate numerical parameters that allow enhanced predictions of the chip geometry, the cutting and the feed forces. Three adaptive formulations, implemented in the commercial codes Abaqus® and Forge® and based on either the nodes relocation technique or the remeshing one, are firstly used to model the Ti6Al4V machining. Different local friction coefficients are modeled to investigate the sensitivity of FE adaptive formulations to the contact conditions. The effect of the damage criteria on the reliability of these meshing approaches, is studied. The adequacy of the Lag FE model and its sensitivity to the friction conditions are also analyzed. Moreover, the effect of the mesh topology on the numerical results is investigated.
FE model
Constitutive material criteria
In the current study, the commonly used Johnson-Cook (JC) thermo-visco-plastic model (Johnson and Cook, 1983) was defined to reproduce the workpiece material behavior (Eq. (1)). This criterion is advantageous since it takes into account the effect of the strain, the strain rate and the temperature. In addition, it has a limited number of coefficients (only five). The values of these constitutive coefficients have already been determined for several materials. Furthermore, the implementation of the JC plasticity model in many commercial codes has deeply encouraged its definition in several investigations of the literature (Zhang et al., 2011a; Ambati and Yuan, 2011; Molinari et al., 2012; Muñoz-Sánchez et al., 2011; Saleem et al., 2016).
( )
0 1 ln 1 m p room melt room n p T T A B C T T ε σ ε ε − = + × + × × − − (1)and Tmelt are the reference temperature of the workpiece and its melting temperature, respectively. A, B, n, C and m are the JC plasticity model coefficients. The corresponding values of these coefficients are grouped in Table 1. Their determination has been carried out based on the Split Hopkinson Pressure Bars (SHPB) tests, under plastic strain rates and temperatures greater than 103 s-1 and 600°C, respectively (Li and He, 2006). The same coefficients have been used in the previous investigations of Calamaz et al ( Calamaz et al., 2011; Calamaz et al., 2008) to model the Ti6Al4V machining.
Table 1 JC plasticity coefficients of the Ti6Al4V titanium alloy (Li and He, 2006)
JC coefficient Symbol Value
Initial yield stress A 968 MPa
Hardening modulus B 380 MPa
Work hardening exponent n 0.421
Strain rate dependency coefficient C 0.0197
Thermal softening coefficient m 0.577
Reference strain rate ε0 0.1 s-1
Melting temperature Tmelt 1943 K
Room temperature Troom 293 K
To predict the damage produced in the workpiece during the chip formation, damage initiation and evolution criteria were simultaneously defined in this study. Based on the JC failure model (Johnson and Cook, 1985) (see Eqs. (2) and (3)), the damage was initiated once the state variable wD was equal to 1.
0 D p i w ε ε ∆ =
∑
(2)where ∆εp is the cumulative plastic strains. εi0 is the plastic strain at the failure initiation.
1 2 3 4 5 0 0 exp h 1 ln 1 room vm melt room i T T D D D D D T T σ ε σ ε ε = + × + × + − − (3)
where Di (i=1, 2, 3, 4, 5) are the JC failure model coefficients (see Table 2). σh and σVMare the
hydrostatic stress and the Von Mises stress, respectively.
evolution was based on the definition of the fracture energy dissipation Gf. Gf is an input parameter, which is computed in advance, based on the fracture energy model proposed by Hillerborg et al (Hillerborg et al., 1976) (see Eq. (4)).
0 0 f f f p c i u G =
∫
σdu =∫
εε Lσ εd p (4)where uf corresponds to the equivalent plastic displacement at failure. σ is the yield stress. Lc
is the characteristic element length. It depends on the FE geometry and its interpolation function. εi0 and εf are the equivalent plastic strains corresponding to the damage initiation and the total fracture, respectively.
In the case of the 2D modeling of the orthogonal machining, under plane strain conditions, a simplified expression of the failure energy (see Eq (5)) has been proposed by Mabrouki et al. (Mabrouki et al., 2008).
( )
( )
(
( )
)
2 2 , , 1 f I II c I II G k E ν − = (5)where E, ν and kc are the Young’s modulus, the Poisson’s ratio and the material fracture toughness, respectively. The indexes (I) and (II) correspond to the opening and the sliding modes, respectively (William 1994).
Physical materials properties
The fact that only rigid cutting tools are modeled with the FE software Forge2D®, an assumption of a rigid body was made in the current analysis to the cutting tool in order to guarantee the consistency of performed comparisons. The thermal properties, mainly the heat exchange with the workpiece, were kept in the several numerical simulations. The physical parameters at the room temperature of the workpiece and the uncoated cutting tool are listed in Table 3.
Table 3 Physical properties of the workpiece and the cutting tool at the room temperature
(Ducobu et al, 2016)
Physical parameter Ti6Al4V titanium alloy Tungsten carbide (WC)
Density, ρ (kg/m3) 4 430 15 000
Elastic modulus, E (GPa) 113.8 —
Poisson’s ratio, ν 0.342 —
Specific heat, Cp (J/kg/K) 580 203
Thermal conductivity, λ (W/m/K) 7.3 46
Thermal expansion, αp (µm.m/K) 8.6×10⁻⁶ 4.7×10⁻⁶
Melt temperature, Tmelt (K) 1 943 —
Room temperature, Troom (K) 293 293
Contact conditions
To reproduce the sticking-sliding friction conditions that were induced in the contact interfaces, the commonly usedCoulomb-Tresca friction model in the literature review (Che et al., 2018; Haddag et al., 2016; Calamaz, 2008; Chen et al., 2013), with a low number of coefficients (see Eq. (6)), was defined in this study.
max max max ( ( ) ) n n f f Tresca n if i m k f µ σ µ σ τ τ τ τ µ σ τ × × < = = = × × ≥ (6)
where µ is the Coulomb’s friction coefficient. σn is the normal friction stress. k and mTresca are the shear stress and the Tresca factor, respectively. mTresca was set to 1 in all the numerical simulations since it is the default value used by the FE software Abaqus®.
Heat transfer modeling
According to Zang et al (Zang et al. 2017), the machining of the Ti6Al4V alloy was followed by a pronounced temperature rise in the workpiece and the cutting tool, due to the significant workpiece material deformations and the high levels of friction. To take into account these thermomechanical coupling conditions, 100% of the energy generated by the friction work was assumed converted to a heat flow (Eq. (7). It was equally distributed between the cutting tool and the workpiece in all performed numerical simulations. Otherwise, ff of Eq. (8) was equal to 0.5 (Ducobu et al., 2017). In addition, 90% of the plastic deformation of the workpiece material was assumed to be converted to a thermal energy (Eq. (9)).
f f f s
q =η ×τ ×V (7)
(
1)
w f f
q→ = − f q (8)
where ηf is the factor of the friction work converted into heat, τf is the friction stress (eq. (6)), ff is the heat fraction absorbed by the tool and Vs is the sliding speed of the chip.
:
approach with the pure Lagrangian boundary conditions (ALE-Lag), (c) the remeshing approach and (d) the pure Lag formulation. They mainly differ by the method adopted to deal with the modeling of the chip formation. Either the cutting tool motion or the workpiece material flow at a given cutting speed was defined, depending on the investigated numerical approach. For all compared FE models, the temperature-displacement coupling conditions were defined to better reproduce the thermo-mechanical changes undergone by the machined material during the chip formation. The case of plane strain conditions was considered, since a very low ratio of the feed per revolution f to the depth of cut ap was considered (f = 0.1 mm/rev and
ap = 3 mm). The same cutting tool geometry was defined in all numerical simulations. The cutting-edge radius rb, the rake angle γ and the flank angle (or clearance angle) α of the tool were equal to 20 µm, 2° and 7°, respectively. A mesh refinement was applied to the cutting tool edge (FE edge length of 5 µm). However, the mesh furthest from this critical zone was the coarsest. The length L and the height l of the workpiece part were also kept unchanged and they were equal to 3 mm and 0.73 mm, respectively. A temperature of 293 K was initially defined to the cutting tool and the workpiece. The case of dry machining was considered. Two cutting speeds of 33 m/min and 75 m/min were defined.
More details about the model geometry, the boundary conditions and the model discretization (number of nodes per element, mesh topology and size) were presented in the following sections.
Effect of numerical parameters on the modeling of machining Sensitivity to the FE meshing approach
In this section, four numerical formulations, based on either adaptive or non-adaptive meshing methods, were defined and compared. The pure Lag, the ALE-Eul-Lag and the ALE-Lag models were set up in the commercial software Abaqus®. On the other hand, the automatic remeshing algorithm available in the FE code Forge® was used to model the 2D orthogonal machining. The adoption of the software Forge®, mainly dedicated to the modeling of metal forming processes, was explained by the non-availability, until now, of a remeshing algorithm in Abaqus®/Explicit.
Numerical models
Fig. 1 and Fig. 2 illustrate the model geometry and the boundary conditions corresponding to the investigated FE formulations. In the case of the ALE simulations, the nodes’ relocation was only defined to the workpiece, while a Lag mesh was applied to the rigid cutting tool. The main difference between the two ALE formulations was summarized by the assumption of stationary conditions for the ALE-Eul-Lag FE model, where the workpiece was considered as a flowing fluid. Moreover, a continuous chip geometry was initially defined, based on the preliminary study carried out to determine the most appropriate geometry. It allowed the transition to a steady chip geometry, while controlling the elements mesh distortion (see Fig. 1). However, no initial chip geometry was defined when the ALE-Lag meshing approach was studied. The dynamic aspects of the machining process were also maintained for this numerical approach. In addition, the cutting speed was applied to the cutting tool, while fixed boundary conditions
were defined to the workpiece. The same boundary conditions were applied in the case of the
pure Lag modeling (see Fig. 2).
Workpiece
Position of the cutting tool at t0+Δt
Initial position of the cutting tool
Mesh refinement (c) Cutting tool (a) Workpiece Sliding surfaces Workpiece Vc Y X Cutting tool Mesh refinement Vc Eul conditions Eul conditions Lag conditions Mesh refinement 0. 2 mm 0. 3 m m R0.15 R0.02 0.15 mm (b) Vc Fixed boundaries No displacement along Y No material displacement along Y
Material velocity
No material displacement along X
Fig. 1 Model geometry and boundary conditions of different adaptive meshing models: (a) the ALE-Eul-Lag model, (b) the ALE-Lag model and (c) the remeshing model
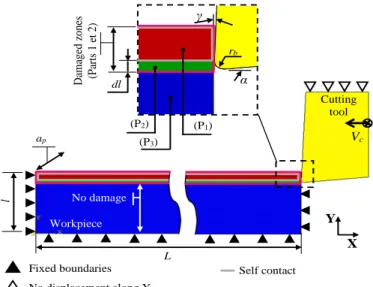
Fig. 2 shows the definition of a multi-part workpiece for the pure Lag model. The cutting tool passage zone was presented by the narrow part P2, located between the upper part of the
workpiece (the chip part P1) and the bottom one P3 reproducing the workpiece support.
According to Subbiah and Melkote (Subbiah and Melkote, 2008), an appropriate determination of the height dl of this sacrificial separation layer (P2) was required to reduce the mesh distortion
problems, generally encountered with the pure Lag meshing approach. The authors have recommended the definition of dl higher than the cutting tool radius. In the current study, dl was set to 30 µm.
Y X l Vc Fixed boundaries No displacement along Y ap Self contact Tool-workpiece contact Cutting tool L Workpiece No damage dl α γ rb D am ag ed z one s (P ar ts 1 et 2 ) (P2) (P3) (P1)
Fig. 2 Model geometry and boundary conditions corresponding to the pure Lag FE model
In this study, the commonly used 4-node quadrilateral bilinear elements CPE4RT, available in the Abaqus2D®/Explicit library, were defined when the ALE approaches and the pure Lag formulation were adopted. These continuum quadrangular elements have been widely used in the literature to model the 2D FEM of the orthogonal machining(Liu et al., 2013; Mabrouki et al., 2008; Miguélez et al., 2006; Miguèlez et al., 2013; Molinari et al., 2012; Saleem et al., 2016; Zang et al. 2017; Zhang et al. 2011). A reduced integration was used by these elements. It is generally followed by a pattern of non-physically based deformation modes under certain loading conditions. To reduce these undesirable effects (the Hourglass effects), the Relax
Stiffness approach was defined in the current study (Barge et al., 2005).
For the commercial code Forge®, the linear isoperimetric triangular elements with an additional interior degree of freedom, known as the bubble node, were used to discretize the model geometry. By means of this software, the mesh refinement was only defined to a small part of the workpiece, mainly to the FE located close to the cutting-edge radius (see Fig. 1-c). During the chip formation, this part with the smallest mesh moved at the same cutting speed of the tool. This meshing technique aimed to guarantee a mesh refinement of the most solicited zones during the modeling of machining. Hence, it permitted to properly take into account the geometry changes undergone by these zones while reducing, as much as possible, the computing times (CPU times). In the case of the ALE-Lag approach and the pure Lag formulation, all the upper zones of the workpiece were discretized using refined elements. For the ALE-Eul-Lag meshing model, a mesh refinement was applied to the predefined initial chip part; and it evolved during the chip formation. For all compared numerical models, a FE edge length of 10 µm was used to discretize the finely meshed zones. Although this mesh size seemed to be unable to accurately take into account the cutting-edge radius, its definition aimed to investigate the influence of the several compared numerical formulations, with regard to the adaptation of the mesh located around the cutting tool radius.
For all compared FE formulations, the discretization of the cutting tool and the bottom part of the workpiece was carried out so that the mesh furthest from the critical zones was the coarsest. This meshing technique aimed to reduce the computing time (CPU time), heavily dependent on
the mesh density (Ayed 2013). In addition, it allowed to maintain the reliability of the numerical simulations, the fact that only low solicitations were applied in the coarsely meshed zones (Mabrouki et al. 2016).
Effect of the adaptive meshing methods
In this section, only the thermo-visco-plastic JC model (Eq. (1)) was used to predict the workpiece material behavior. Different adaptive meshing approaches (the ALE-Eul-Lag approach, the ALE-Lag approach and the remeshing approach) were defined. Their efficiencies, in terms of solving the mesh distortion problems and accurately reproducing the significant changes of the model geometry, were compared. For each adaptive meshing formulation, a set of numerical simulations with different Coulomb’s coefficients, ranging from 0.1 to 0.9, was conducted. This FE analysis aimed to determine the most appropriate friction coefficient that provided relevant numerical results. This calibration procedure was required because of the arduous experimental determination of the appropriate friction coefficient value (Egaña et al., 2012).
The experimental results of the literature (Calamaz, 2008) have highlighted the formation of a well-segmented chip under a cutting speed of 75 m/min (see Fig. 3). On the other hand, only a continuous chip morphology was predicted with all compared FE adaptive meshing approaches, for the several defined friction coefficients (see Fig. 4). This steady chip morphology, in disagreement with the experimental one of the literature, underlined the inadequacy of the JC plasticity model to accurately reproduce the chip serration, even when friction coefficients up to 0.9 and adaptive meshing approaches were simultaneously defined.
(b) (a) Shear bands H h Ls
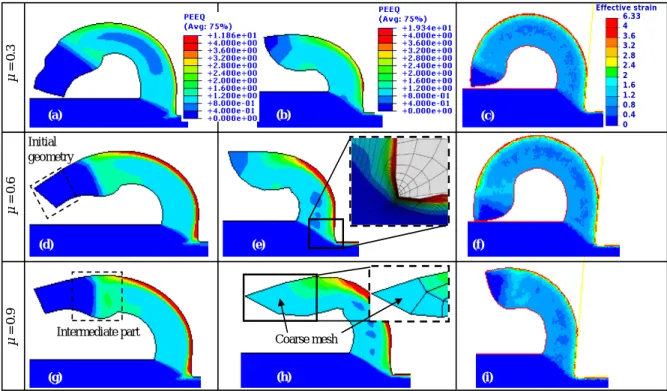
µ = 0 .3 µ = 0 .6 µ = 0 .9 Initial geometry (a) (b) (c) Effective strain 6.33 3.6 2.8 2 1.2 0.4 4 3.2 2.4 1.6 0.8 0 (d) (e) (f) (g) (h) (i) Coarse mesh Intermediate part
Fig. 4 Chip morphology predicted with different adaptive meshing approaches ((a, d and g)
the ALE-Eul-Lag model, (b, e and h) the ALE-Lag model and (c, f and i) the remeshing model) and several friction coefficients ((a-c) μ = 0.3, (d-f) μ = 0.6 and (g-i) μ = 0.9) A non-homogeneous chip morphology, composed of three parts: the pre-defined chip geometry, the intermediate transition zone, where the removed material became thicker, and the steady chip, was modeled in the case of the ALE-Eul-Lag meshing approach (Fig. 4 (a, d, g)). The main role of the simulated transition zone was to allow the adaptation of the initially defined mesh to the changes followed by the model geometry, thus to reduce the mesh distortion. Significant displacements of elements nodes were enabled until reaching the steady state. This multi-parts chip morphology was not reproduced with either the ALE-Lag model or the remeshing one, to which no particular chip morphology was initially defined. For the ALE-Lag model, important defects, particularly the geometrical ones, were modeled. For this FE approach, a coarse mesh was noted in the less deformed zones (see Fig. 4-h). This increase of the FE size was also highlighted around the cutting-edge radius. Indeed, the particularity of the tool geometry (rb = 20 µm) was not taken into account (see Fig. 4-e). Such problem was not underlined with respect the other investigated adaptive meshing approaches. The Eul conditions defined to the ALE-Eul-Lag modeling and the creation of an updated mesh with the remeshing algorithm enabled more adaptation of the mesh to the changes followed by the model geometry, and thereby more accurate prediction of its particularities.
The effects of friction conditions and FE approaches on the computed cutting and feed forces are illustrated in Fig. 5. For friction coefficients less than 0.4, theaverage Fc and Ff increased with the µ rise, while they remained almost constant for µ > 0.4. The highest numerical forces were computed with the ALE-Lag FE model, where the mesh elements were significantly deformed during the chip formation. An interesting agreement with the average experimental
0.1 to 0.2. However, the definition of the ALE-Eul-Lag formulation and the remeshing technique resulted in the prediction of numerical cutting and feed forces closer to the experimental ones, for friction coefficients greater than 0.4.
Fc Ff 0 100 200 300 400 500 600 700 800 900 0,1 0,2 0,3 0,4 0,5 0,6 0,7 0,8 0,9 C ut ti ng a nd f e e d f o r c e s ( N ) Coulomb’s coefficient 0 100 200 300 400 500 600 700 800 900 0,1 0,2 0,3 0,4 0,5 0,6 0,7 0,8 0,9 0 100 200 300 400 500 600 700 800 900 0,1 0,2 0,3 0,4 0,5 0,6 0,7 0,8 0,9 0 100 200 300 400 500 600 700 800 900 0,1 0,2 0,3 0,4 0,5 0,6 0,7 0,8 0,9 0 100 200 300 400 500 600 700 800 900 0,1 0,2 0,3 0,4 0,5 0,6 0,7 0,8 0,9 0 100 200 300 400 500 600 700 800 900 0,1 0,2 0,3 0,4 0,5 0,6 0,7 0,8 0,9 Remeshing Exp ALE-Eul-Lag ALE-Lag
Fig. 5 Comparison of computed forces with the experimental ones of Calamaz et al. (Calamaz
et al., 2010) (Vc = 75 m/min, f = 0.1 mm/rev and ap = 3 mm)
In correlation with the continuous chip morphology predicted with both adaptive meshing approaches, the ALE-Eul-Lag formulation and the remeshing technique, slight fluctuations of the instantaneous computed average cutting and feed forces were noted for all investigated friction coefficients (see Fig. 5). This result was assigned to the assumptions made for the
ALE-Eul-Lag formulation and the remeshing technique, where a stationary cutting model was
assumed instead of a transient one and an updated mesh was created, respectively. However, more fluctuated forces were computed with the ALE-Lag formulation, especially for high friction coefficients.
Due to the modeling of a continuous chip, in disagreement with the experimental one (see Fig. 3), with all compared adaptive meshing approaches, failure criteria were defined to the workpiece in the following section. The definition of damage models aimed to increase the reliability of adaptive meshing approaches. The effects of these models on the chip morphology was also investigated.
Effect of the damage criteria
The JC thermo-visco-plastic model and the damage criteria (see Eq (1-3, 5)) were used to predict the workpiece material behavior. The case of a 2D plane-strain coupled
thermo-defined to the upper part of the workpiece (see Fig. 1-b). In fact, the modeling of the chip formation was allowed by either the nodes relocation or the FE deletion technique provided by the software Abaqus®. Due to the definition of a one-part workpiece when the ALE-Lag FE model was adopted, the damage evolution was reproduced based on the definition of one failure energy. The same value was defined to the chip part (P1) and the sacrificial layer (P2) of the pure Lag model. This strategy aimed to maintain the consistency of comparisons. The fact that
the failure energy was an input parameter in Abaqus®, an accurate determination of its value was required. Indeed, a set of Gf ranging from 15 N/mm to 21.8 N/mm (Chen et al., 2011) was preliminary defined to both numerical meshing approaches to determine the most appropriate failure energy.
Under the same cutting and contact conditions (Vc = 75 m/min, f = 0.1 mm/rev, ap = 3 mm and
µ = 0.1), the numerical chip predicted with the pure Lag formulation and the ALE-Lag approach
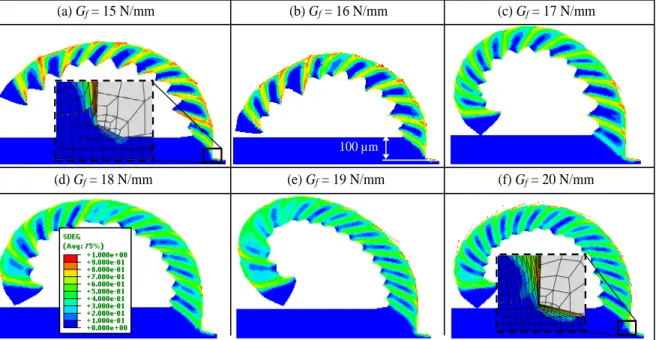
is illustrated in Fig. 6 and Fig. 7, respectively. Segmented chip, closer to the experimental one (Fig. 3), was modeled with the pure Lag FE model, once a failure energy below 17 N/mm was defined. However, only wavy chips were predicted with the ALE-Lag FE model, whatever the
Gf value (see Fig. 7). Indeed, weakly formed shear bands were modeled and very low scalar stiffness degradation variables (SDEG) were computed within. On the other hand, the coarsest elements, modeled in the chip extremity, were the most damaged ones (see Fig. 7 (a and b)). This result confirmed the inadequacy of the ALE-Lag FE model in terms of accurately predicting the chip segmentation, even when damage models were defined. Moreover, an increase of the element edge length, located around the cutting tool radius, was underlined. This increase of the mesh size influenced the numerical results. Indeed, the cutting tool geometry was not properly taken into account. The same problem was underlined with the pure Lag modeling. It was heavily accentuated with the failure energy increase (see Fig. 6 (a and f).
(a) Gf = 15 N/mm (b) Gf = 16 N/mm (c) Gf = 17 N/mm
(d) Gf = 18 N/mm (e) Gf = 19 N/mm (f) Gf = 20 N/mm
100 µm
Fig. 6 Sensitivity of the chip morphology predicted with the pure Lag meshing approach to
(a) Gf = 15 N/mm (b) Gf = 16 N/mm (c) Gf = 17 N/mm (d) Gf = 18 N/mm (e) Gf = 19 N/mm (f) Gf = 20 N/mm Deleted elements 100 µm
Fig. 7 Effect of failure energy on the chip morphology modeled with the ALE-Lag approach
(Vc = 75 m/min, f = 0.1 mm/rev and μ = 0.1)
A chip segmentation ratio (SR) (see Eq. (10)) was defined to quantitatively compare the segmented chip, predicted with the pure Lag modeling, to the experimental one. The increase of the fracture energy resulted in the SR decrease, giving rise to an important mismatch with the experimental segmentation ratio, for the highest Gf (Fig. 8).
C h ip s egm en tat ion r at io ( %) Fracture energy (N/mm) 0 10 20 30 40 50 60 15 16 17 18 19 20 SR (Num) SR (Exp)
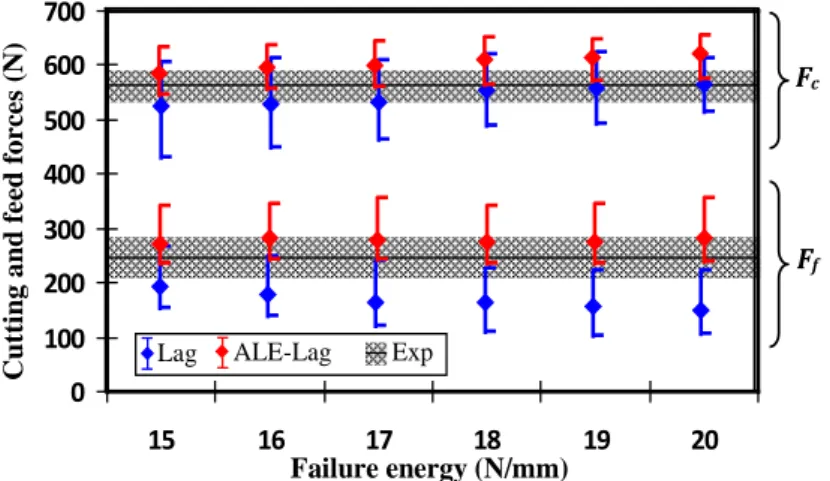
was induced by the Gf rise, which was in correlation with the numerical results of Yaich et al. (Yaich et al., 2017). However, a weak effect of Gf on the average Ff computed with the
ALE-Lag meshing approach was noted. In addition, this adaptive formulation resulted in the
prediction of higher numerical forces, closer to the experimental ones, for the several investigated Gf. For the pure Lag model, more fluctuated cutting forces were predicted when the failure energy was decreased. These significant fluctuations were assigned to the pronounced chip segmentation. Therefore, more severe alternations between high and low numerical equivalent plastic strains were computed in and out the well-formed shear bands, respectively. In addition, numerical average Ff in mismatch with the experimental one was modeled with the pure Lag FE model, mainly for high Gf. This underestimation was attributed to the numerical technique adopted by this formulation to reproduce the chip formation. It was based on the deletion of damaged elements mesh in contact with the tool-edge radius, especially those used to discretize the intermediate sacrificial layer (P2 of Fig. 2). The FE deletion induced
a decrease of the contact pressure applied to the cutting tool in the feed direction. Therefore, even though this technique allowed the modeling of the chip separation from the machined workpiece in the case of the pure Lag modeling, it led to a mismatched prediction of the contact conditions between the flank face of the cutting tool and the workpiece.
0 100 200 300 400 500 600 700 15 16 17 18 19 20 Fc Ff C ut ti ng a nd f e e d f o r ce s ( N ) Failure energy (N/mm) Lag ALE-Lag Exp
Fig. 9 Effect of failure energy and FE meshing approaches on the computed forces
(Vc = 75 m/min, f = 0.1 mm/rev and µ = 0.1)
The Coulomb’s coefficient and the failure energy were simultaneously modified. In the case of the pure Lag modeling, friction coefficients below 0.3 were defined. The modeling of machining, based on the definition of µ lower than those simulated with the adaptive meshing approaches, was justified by the inability of this FE formulation to model important cutting times when high friction coefficients were defined. This inadequacy to the pronounced sticking conditions, taking place in the contact interfaces, explained the commonly definition of low friction coefficients in the numerical studies focusing on the modeling of the Ti6Al4V machining with the commercial code Abaqus® (µ = 0.1 (Yaich et al., 2017), µ = 0.2 (Zhang et al., 2015), µ = 0.24 (Chen et al., 2011), etc.).
Fig. 10 illustrates the numerical chip morphology predicted for different failure energies and a friction coefficient of 0.25. Under the same µ, the definition of failure energies below 19 N/mm gave rise to an accentuation of the chip serration. Measurement of the valley and the peak chip
thicknesses were carried out. A decrease of the chip segmentation ratio was underlined for the highest failure energies (Fig. 10-g). Numerical SR closer to the experimental one were predicted, when Gf < 18 N/mm were used. However, for the lowest failure energies, severe problems of the mesh distortion were encountered. Hence, the modeling of important cutting times was not permitted (e.g. tc = 0.31 ms for µ = 0.25 and Gf = 15 N/mm).
(b) (c) (d) (e) (f) (a) 100 µm C h ip s egm en tat ion r at io ( %) Fracture energy (N/mm) SR (Num) SR (Exp) 0 10 20 30 40 50 60 15N/mm 16N/mm 17N/mm 18N/mm 19N/mm 20N/mm (g)
Fig. 10 Effect of the failure energy on the chip serration ((a) Gf = 15 N/mm, (b) Gf = 16 N/mm, (c) Gf = 17 N/mm, (d) Gf = 18 N/mm, (e) Gf = 19 N/mm and
(f) Gf = 20 N/mm) and (g) the segmentation ratio (Vc = 75 m/min and µ = 0.25)
Fig. 11 illustrates the chip morphology and the cutting forces corresponding to different µ and a failure energy of 15 N/mm. For all investigated friction coefficients, segmented chips, in correlation with the experimental one were predicted. The average Fc was slightly increased with the friction coefficient rise, whereas an underestimation of Ff was pointed out for all studied µ.
(e) (d) (c) (b) (a) 100 µm 0 100 200 300 400 500 600 0,1 0,15 0,2 0,25 Fc Ff Experimental forces Coulomb’s coefficient C o m p u ted f o rces ( N )
Fig. 11 Effect of the friction coefficient on the numerical chip morphology
((a) µ = 0.1 _ tc = 1 ms, (b) µ = 0.15 _ tc = 0.61 ms, (c) µ = 0.2 _ tc = 0.41 ms and (d) µ = 0.25 _ tc = 0.31 ms) and (e) the computed forces (Vc = 75/min and Gf = 15 N/mm) In the case of the ALE-Lag modeling, several friction coefficients (µ between 0.1 and 0.9) were simulated to investigate their effects on this meshing approach reliability. An accentuation of the sticking conditions between the workpiece and the cutting tool was induced by the definition of high µ. It resulted in pronounced materials adherence at the contact interfaces. However, low sensitivity of the chip morphology and the computed forces to the friction conditions was noted (see Fig. 12). Interesting correlations with the experimental forces, mainly Ff, were underlined. On the other hand, only wavy chip, in disagreement with the experimental one, was predicted, even when important Coulomb’s coefficient (up to 0.8) were modeled. The equivalent plastic strains (PEEQ), computed with the ALE-Lag meshing approach in the weakly formed shear bands, slightly increased with the definition of important µ. The mismatched numerical chip morphology emphasized the inadequacy of this adaptive meshing approach, to which either low
Gf or high µ was defined, to accurately predict the chip segmentation. This inadequacy was attributed to the nodes relocation strategy, which provided an artificial flexibility of the finite elements limiting their deformation.
(d) (c) (b) (a) 100 µm (e) Coulomb’s coefficient C o m p u ted f o r ces ( N ) Experimental forces 0 100 200 300 400 500 600 700 0,2 0,4 0,6 0,8 Fc Ff
Fig. 12 Sensitivity of (a-d) the chip morphology and (e) computed forces to the friction
coefficient: (a) µ = 0.2, (b) µ = 0.4, (c) µ = 0.6 and (d) µ = 0.8 (ALE-Lag FE model,
Vc = 75 m/min and Gf = 18 N/mm)
In conclusion, the ALE-Lag FE model showed an interesting efficiency in terms of reducing the mesh distortion problems, even for important friction coefficients. It also allowed the prediction of numerical forces closer to the experimental ones. However, despite the definition of damage criteria, this adaptive meshing approach was unable to capture the local phenomena, mainly the shear band formation. Contrariwise, the prediction of a well-serrated chip, in agreement with the experimental one of the literature, was allowed with the pure Lag FE approach, mainly when an accurate Gf was defined. The main drawback of this non-adaptive formulation was the pronounced mesh distortion encountered during the modeling of severe friction conditions, as well as the underestimation of Ff. Moreover, the cutting-edge radius geometry (rb = 20 µm) was not properly taken into account when FE edge length of 10 µm were defined in the damaged zones. In order to increase the reliability of the pure Lag modeling, the effect of the mesh topology (size and type) on accurately predicting different chip morphologies was studied in the next section.
Sensitivity to the mesh topology
quadrangular elements with an edge length of 10 µm, a failure energy of 15 N/mm was defined in the damaged zones. These choices were justified by the adequacy of these µ and Gf in terms of well-fitting the experimental data and mitigating the severe problems of mesh distortion, generally encountered with the pure Lag modeling in the rake face of the cutting tool, mainly around its edge radius. For the other investigated mesh sizes (elements of an edge length ≠ 10 µm), failure energy was computed referring to the model of Chen et al (Chen et al., 2011) (see Table 4). This calibration procedure was attributed to the significant effect of the FE characteristic length Lc, heavily depended on the mesh size and type, on the failure evolution (Chen et al. 2013), which has been neglected in the Gf expression given by Eq (5).
Table 4 Sensitivity of the failure energy to the FE geometry
FE edge length (µm) 4 6 8 10 12 14
Characteristic length (µm) 5.6 8.5 11.3 14.1 16.97 19.8
Failure energy (N/mm) 6 9 12 15 18 21
Results and discussions
For a cutting speed of 33 m/min, Fig. 13 shows the modeling of different chip morphologies. A noticeable distinction between the predicted valley and peak chip thicknesses (h and H respectively) was noted, when the smallest FE edge lengths (4 µm and 6 µm) were used to discretize the damaged zones. In addition, high levels of equivalent plastic strains were modeled within the narrow shear bands. A significant sliding of the removed material along the shear band towards the upper free surface of the chip was pointed out, which was in mismatch with the experimental chip morphology (see Fig. 13-g). However, the geometry of the cutting-edge radius was perfectly respected with these FE sizes. In the case of coarse mesh, an important energy was required to deform the finite elements. Hence, the equivalent plastic strains computed within the shear bands heavily decreased and a wavy chip was modeled. On the other hand, the excessive mesh refinement resulted in a non-physical concentration of plastic strains. The definition of a cutting speed of 75 m/min resulted in the modeling of serrated chips, which intensity differed from one mesh size to another (see Fig. 14). Significant variations of the equivalent plastic strain and the damage variable computed in the chip were noted when a FE edge length of 4 µm was defined. Indeed, thin shear bands with very deformed mesh, and thereby a damaged one, were modeled. However, an almost undamaged mesh was predicted between every two consecutive shear bands, mainly in the formed dead zones (εp≈0).
High plastic strain H h Low deformed mesh 100 µm (a) (b) (c) (d) (e) (f) 100 µm 100 µm 100 µm 100 µm 100 µm Wavy chip 100 µm (g) Wavy chip
Fig. 13 Comparison of the numerical chip predicted with different FE edge lengths ((a) 4 µm,
(b) 6 µm, (c) 8 µm, (d) 10 µm, (e) 12 µm and (f) 14 µm) to (g) the experimental one (Calamaz, 2008) (Vc = 33 m/min and f = 0.1 mm/rev)
When a coarse mesh (FE edge length of 12 µm or 14 µm) was defined in the damaged zones, a weakly segmented chip, in disagreement with the experimental one (Fig. 3), was modeled. Low damage variables SDEG and equivalent plastic strains PEEQ were predicted in the shear bands. However, for both investigated cutting speeds, the discretization of damaged zones with FE edge length of 8 µm or 10 µm allowed the prediction of wavy and segmented chips in correlation with the experimental results (see Fig. 13(c-d) and Fig. 14(c-d)).
(f) 100µm (e ) Free surface of the chip 50µm (a) 50µm (b ) H (c ) (d ) Shear band 50µm 50µm h Dead zones Undamaged mesh Very damaged mesh Low damaged mesh 100µm 100µm 100µm 100µm 100µm 100µm 100µm 100µm 100µm 100µm 100µm 50µm Low plastic strains
Equivalent plastic strain Damage evolution
Moderate deformation of the mesh 50µm Very damaged mesh Undeformed mesh
Fig. 14 Effect of the mesh size on the chip morphology: (a) 4 µm, (b) 6 µm, (c) 8 µm,
(d) 10 µm, (e) 12 µm and (f) 14 µm (Vc = 75 m/min)
The chip segmentation ratio, given by Eq. (10), was computed for the different investigated mesh size. Fig. 15 illustrates the comparison of numerical SR, corresponding to a cutting speed of 75 m/min, with the experimental results. The definition of a coarse mesh gave rise to the
modeling of more mismatched SR (case of FE edge length of 12 µm or 14 µm). However, SR closer to the experimental one was predicted, for a mesh below 10 µm.
C h ip s egm en tat ion r at io ( %) FE edge length (µm) 0 10 20 30 40 50 60 4 6 8 10 12 14 SR (Num) SR (Exp)
Fig. 15 Numerical chip segmentation ratio sensitivity to the FE edge lengths
(Vc = 75 m/min)
Fig. 16 illustrates significant fluctuations of the instantaneous numerical forces. The intensity of these fluctuations slightly decreased with the definition of a cutting speed of 33 m/min. These fluctuations were attributed to the pronounced discontinuity induced by the deletion of the damaged finite elements, mainly those located in the sacrificial layer P2. The damaged mesh
deletion induced a pronounced decrease of the pressure applied to the cutting tool, thus a drop of the instantaneous computed forces. A decrease of the fluctuations intensity was emphasized when smaller mesh sizes were defined. Nonetheless, the most accurate prediction of the experimental chip geometry and cutting forces was obtained when mesh size ranging from 6 µm to 10 µm was defined (see Fig. 15 and Fig. 16 respectively). Moreover, for FE edge lengths different from 10 µm, more mismatched average feed forces were modeled for both studied cutting speeds. 100 200 300 400 500 600 700 100 200 300 400 500 600 700 (a) ut ti ng a nd f e e d f o r c e s ( N ) (b) ut ti ng a nd f e e d f o r c e s ( N ) Fc Ff Fc Ff Numerical forces Experimental forces Numerical forces Experimental forces
computing times when a coarse mesh was defined, a limited adequacy of this mesh in terms of capturing the local phenomena involved during the chip formation was noted. In addition, the effect of the cutting-edge radius (rb = 20 µm) was not properly taken into account with this mesh (see Fig. 14(e-f)).
1 10 100 1000 10000 4 6 8 10 12 14 FE edge length (µm) C P U ti me ( m in)
Fig. 17 Computing time as a function of the mesh size (Vc = 75 m/min)
In general, the agreement with the experimental results, in terms of the chip morphology, the segments geometry, the average cutting and feed forces, was increased once quadrangular linear FE of 10 µm edge length, coupled with an adequate definition of the friction coefficient and the failure energy, were adopted to the discretize the damaged zones. An interesting compromise between the precision of numerical simulations and the reduction of computing times was reached. However, the cutting-edge radius was not properly considered with this mesh size. In fact, FE edge lengths of 6 µm and 10 µm were adopted to discretize the cutting tool passage zone P2 and the chip part P1, respectively, in the following section.
Effect of the mesh type Numerical model
The pure Lag FE model (Fig. 2) was defined in this section. The 2D modeling of the Ti6Al4V orthogonal machining, under two cutting speeds, 33 m/min and 75 m/min, was studied. The case of plane strain conditions and coupled thermo-mechanical calculations was investigated. Three different mesh types, available in the Abaqus2D®/Explicit library, were defined:
− The 4-node linear (1st order) quadrangular elements CPE4RT, already defined in the
previous section
− The 3-node linear (1st order) triangular elements CPE3T
− The 6-node quadratic (2nd order) triangular elements CPE6MT.
It is underlined that, contrary to the quadrangular linear mesh that has been commonly used in the literature, the linear 3-node triangular elements have been weakly adopted to model the machining process (Germain et al., 2011; Haddag et al. 2018). The definition of this mesh type has been limited to the discretization of slightly deformed zones. On the other hand, the quadratic triangular CPE6MT elements have been not yet defined in the case of the machining modeling. In this regard, the effect of these three FE types on the modeling of the Ti6Al4V
machining and the computing time, as well as the adequacy of all compared meshes to the high non-linearity, caused by the significant local changes undergone by the workpiece material, were studied.
FE edge lengths of 6 µm and 10 µm were adopted to discretize the cutting tool passage zone P2
and the chip part P1 respectively, for all investigated mesh types. In addition, the same nodes
variables, the temperature and the displacement, were adopted by all compared mesh types. However, these FE differed by the adopted interpolation functions (more details have been provided by Yaich (Yaich, 2017)). A reduced integration was used by the quadrangular linear elements, while a full integration was adopted by the triangular elements in both forms, the first and the second orders. The difference between these triangular elements was mainly summarized by the number of nodes per element. Supplementary nodes located at the middle FE edges were defined to the CPE6MT mesh. The increase of the nodes number enabled additional displacements’ modes and affected the characteristic elements length Lc (see Fig. 18). Therefore, the failure energies corresponding to the CPE3T and the CPE6MT elements were firstly computed referring to the numerical analysis of Chen et al. (Chen et al., 2011).
(a) (b) (c) Lc Lc Lc
Fig. 18 Sensitivity of the characteristic FE length to the mesh type: (a) 3-node triangular
element, (b) 6-node triangular element and (c) 4-node quadrangular element
Compatibility of mesh types
A preliminary study was performed to investigate the compatibility of the different compared mesh types to the modeling of a segmented chip. It was noted that only the simulation of low cutting times was allowed with the CPE6MT elements. An excessive mesh distortion was underlined, mainly in the intermediate layer P2. To avoid such problem, the triangular 3-node
elements were defined in P2, instead of the CPE6MT elements, in the following analysis. This
meshing method aimed to overlap the CPE6MT mesh distortion encountered around the cutting tool edge, thus to increase the modeled cutting times. For the same FE modeling, the CPE3T mesh was defined in the bottom part of the workpiece P3 and the cutting tool part, while only
shows a significant increase of the CPU time due to the definition of the CPE6MT elements in the chip part. However, the model discretization with the quadrangular linear elements mesh resulted in the lowest CPU time, where the modeling of the same machining time under a cutting speed of Vc = 75 m/min required only 369 min. However, 1544 min and 6165 min were the computing times obtained with the meshing methods (1) and (2), respectively.
Effect of the mesh type on the chip morphology
Fig. 19 illustrates the modeling of a well-serrated chip when the CPE6MT or the CPE3T elements were defined in the chip part. Very thin shear bands, with high levels of plastic strains and damage variables, were simulated. However, an almost undamaged mesh was modeled between every two consecutive shear bands. The discretization of the model geometry based on the definition of quadrangular CPE4RT mesh gave rise to less pronounced variations of the
εp and the SDEG along the chip thickness.
Table 5 Computing time, mesh density and nodes number corresponding to different meshing
strategies (Vc = 75 m/min) Meshing
strategy FE mesh type
Mesh density (elements)
Number of
nodes (nodes) CPU time (min)
(1) CPE3T 12 024 6 856 1544
(2) CPE6MT and CPE3T 12 024 16 121 6165
(a) (b) (c)
Equivalent plastic strain Damage evolution
Ls H h Undamaged mesh 50 µm 100 µm 50 µm 50 µm 100 µm 100 µm
Fig. 19 Chip morphology, plastic strains and damage evolution corresponding to different
meshing methods: (a) 1, (b) 2 and (c) 3 (Vc = 75 m/min)
The comparison of the numerical chip morphologies underlined the modeling of different segmentation frequencies, which influenced the computed segments width Ls (see Fig. 19 and Fig. 20-a respectively). Only 11 segments were modeled with the CPE4RT elements. However, higher segmentation frequency (16 segments) was obtained with the CPE6MT elements, for the same cutting condition and machining time. Hence, a reduction of the Ls was noted for this mesh type. Fig. 20-b exhibited an accurate prediction of the chip segmentation ratio with the CPE6MT and the CPE4RT mesh. Nonetheless, the model geometry discretization with the CPE3T resulted in more mismatched SR.
40 60 80 100 Ls (Num) 20 30 40 50 SR (Num) (a) (b) Ls ( µm ) SR ( %)
mesh to predict a wavy chip was underlined. Only well-serrated chip, in disagreement with the experimental one, was modeled. Contrariwise, an almost continuous curved chip was predicted with the CPE6MT triangle mesh. The definition of the CPE4RT mesh contributed to the prediction of the most accurate chip morphology (see Fig. 21-c).
Effect of the mesh type on the computed forces
For both investigated cutting speeds (33m/min and 75m/min), Fig. 22 illustrates the underestimation of the average Fc computed with the different mesh types. This mismatch was reduced with the definition of the CPE4RT mesh. The cutting forces fluctuations were heavily accentuated with the CPE3T triangular mesh, due the pronounced numerical chip segmentation. However, less Fc oscillations were underlined in the case of the model discretization with the CPE4RT or the CPE6MT mesh, mainly for the lowest cutting speed (Vc = 33 m/min).
100 µm (d) Wavy chip (b) 100µm (a) 100µm Shear bands (c) 100µm
Fig. 21 Comparison of numerical chip morphologies corresponding to different mesh types
((a) CPE3T, (b) CPE6MT and (c) CPE4RT) to (d) the experimental one (Vc = 33 m/min)
(a) (b) 0 150 300 450 600 750
CPE3T CPE6MT CPE4RT Exp
Fc ( N) 0 150 300 450 600 750
CPE3T CPE6MT CPE4RT Exp
Fc
(
N)
Fig. 22 Comparison of computed cutting forces to the experimental ones of the literature
(Calamaz et al., 2010): (a) 33 m/min and (b) 75 m/min
Conclusion
The pronounced effect of numerical parameters on the 2D FE modeling of the Ti6Al4V machining were investigated in this study. The enabled prediction of several friction conditions with the ALE and the remeshing adaptive approaches, even when no separation criterion was defined, highlighted the adequacy of these meshing techniques to the modeling of significant friction conditions. A noticeable reduction of the mesh distortion was noted. However, a pronounced sensitivity of the computed forces to the friction coefficients was underlined, for all studied adaptive meshing approaches. The definition of high µ contributed to an increase of the Fc and Ff average values, which became more significant for the ALE-Lag model. The
inadequacy of the investigated numerical adaptive formulations, in terms of reproducing the chip serration when the JC constitutive model was defined to the workpiece, was underlined. Despite the definition of damage criteria in the ALE-Lag FE modeling, its inability to accurately reproduce the experimental results emphasized its inadequacy to the modeling of the Ti6Al4V machining. Contrariwise, with a proper definition of the damage evolution energy and the friction coefficient, a better fit of the chip morphology and the cutting forces was noted with the pure Lag FE model. A pronounced sensitivity of its reliability to the adequate definition of the mesh topology (the FE size and types) was noted. The transition from a continuous wavy chip to a well-serrated one was accurately reproduced, mainly when linear quadrangular elements with a reduced integration and an edge length ranging from 8 µm to 10 µm were adopted to discretize the chip part. The inability of the coarse mesh to reproduce the shear band formation, and consequently to predict the local involved phenomena, was highlighted. Moreover, highly fluctuated cutting forces were modeled with this mesh topology, deeply reducing its efficiency. However, the definition of a refined mesh contributed to a deep decrease of the instantaneous forces fluctuations.
The inadequacy of refined mesh and CPE3T triangular elements to model the steady-state conditions was underlined. A pronounced non-physical shear localization in the well-serrated chip were predicted, for a cutting speed of 33 m/min. On the other hand, an unreasonable increase of the computing time was induced by the definition of either refined mesh or triangular CPE6MT elements. In addition, the significant distortion problems, mainly encountered around the cutting-edge radius, pointed out the inadequacy of these mesh topologies to the modeling of high non-linearity. Contrariwise, high reliability of the CPE4RT elements was underlined. It resulted in the prediction of segmentation ratio, chip widths and cutting forces closer to the experimental ones. In addition, less mesh distortion was encountered with these quadrangular elements. An interesting reduction of the computing time was also underlined with this 4-node quadrangular mesh, emphasizing their adequacy to the modeling of machining.
Although the FEM reliability was deeply improved when an accurate definition of purely numerical parameters was carried out, computed results can be further improved when more attention is paid to the definition of the workpiece material behavior and the contact conditions. Indeed, special focus, concerning the modeling of machining based on the definition of more realistic constitutive and friction models, is required in the future.
Acknowledgments
Lag Lagrangian
ALE Arbitrary Lagrangian-Eulerian CEL Coupled Eulerian-Lagrangian
2D Tow-Dimensional
JC Johnson-Cook
TANH Hyperbolic tangent
SHPB Split Hopkinson Pressure Bars
p
ε Equivalent plastic strain
0
ε Reference equivalent plastic strain rate
Troom Reference temperature (°K)
Tmelt Melt temperature (°K)
A Initial Yield stress at the room temperature (MPa)
B Hardening modulus
n Work hardening exponent
C Strain rate sensitivity coefficient
m Thermal softening coefficient
D
ω Johnson-Cook state variable corresponding to the damage initiation p
ε
∆ Cumulative plastic strain
0 i
ε Plastic strain at the failure initiation
D1 Initial failure strain
D2 Exponent factor
D3 Triaxiality factor
D5 Temperature factor
σh Hydrostatic stress (MPa)
σVM Von Misses stress (MPa)
Gf Fracture energy
uf Equivalent plastic displacement at the total fracture
up Equivalent plastic displacement
f
ε Equivalent plastic strain at the total fracture
Lc Characteristic finite element length (mm)
E Young modulus (GPa)
ν Poisson’s ratio
kc Fracture toughness (MPa√𝑚𝑚)
ρ Material density (kg / m3)
Cp Specific heat ((J / kg / K)
λ Thermal conductivity (W / m / K)
αp Thermal expansion (µm . m / K)
ηp Inelastic heat fraction (or the Quinney-Taylor coefficient)
τf Friction stress (MPa)
µ Coulomb’s friction coefficient
ηf Factor of friction converted into heat
Vs Material sliding speed (m / min) w
q→ Heat flow due to the material friction work and distributed in the workpiece
(W m-2)
ff Heat fraction absorbed by the cutting tool
p
q Heat flux due to the material plastic work (Wm-2)
ALE-Eul-Lag Arbitrary Eulerian Lagrangian formulation based on the Eulerian-Lagrangian
Boundary conditions
ALE-Lag Arbitrary Eulerian Lagrangian formulation based on the Lagrangian Boundary conditions
ap Depth of cut (mm)
f Feed per revolution (mm/rev)
Vc Cutting speed (m/min)
rb Cutting-edge radius
γ Rake angle of the cutting tool
α Flank angle of the cutting tool
CPU time Computing time
H Peak chip thickness (µm)
h Valley chip thickness (µm)
Ls Chip segment width (mm)
Fc Cutting force
Ff Feed force
P1 Chip part
P2 Sacrificial separation layer (or the cutting tool passage zone)
dl Height of the sacrificial separation layer (µm)
PEEQ Equivalent plastic strain computed at the integration point
SDEG Damage variable
CPE4RT 4-node linear (first order) quadrangular and thermally coupled finite element with integration point
CPE3T 3-node (first order) triangular and thermally coupled finite element CPE6MT 6-node quadratic (second order) and thermally coupled triangular element
SR (%) Chip segmentation ratio
References
Ambati, Ravindra, and Huang Yuan. 2011. “FEM Mesh-Dependence in Cutting Process Simulations.” International Journal of Advanced Manufacturing Technology 53: 313–23. Ayed, Y. 2013. “Approches Expérimentales et Numériques de l’usinage Assisté Jet d’eau
Haute Pression : Étude Des Mécanismes d’usure et Contribution à La Modélisation Multi-Physiques de La Coupe.” Ecole Nationale Supérieure d’Arts et Métiers-Centre d’Angers.
Bahi, S. et al. 2012. “Hybrid Modelling of Sliding-Sticking Zones at the Tool-Chip Interface under Dry Machining and Tool Wear Analysis.” Wear 286–287(9): 45–54.
Barge, M.; Hamdi, H.; Rech, J.; Bergheau, J.-M. 2005. “Numerical Modelling of Orthogonal Cutting: Influence of Numerical Parameters.” Journal of Materials Processing
Technology 164–165: 1148–53.
Calamaz, M. 2008. “Approche Expérimentale et Numérique de l’usinage à Sec de l’alliage Aéronautique TA6V.” University of Bordeaux 1.
Calamaz, M., D. Coupard, M. Nouari, and F. Girot. 2011. “Numerical Analysis of Chip Formation and Shear Localisation Processes in Machining the Ti-6Al-4V Titanium Alloy.” International Journal of Advanced Manufacturing Technology 52(9–12): 887–