New Methods Aiming To Improve The Performances Of
Aircraft Flight Trajectory Optimization Algorithms.
by
Bogdan Dumitru DANCILA
MANUSCRIPT-BASED THESIS PRESENTED TO ÉCOLE DE
TECHNOLOGIE SUPÉRIEURE IN PARTIAL FULFILLEMENT FOR THE
DEGREE OF DOCTOR OF PHILOSOPHY
Ph.D.
MONTREAL, DECEMBER 19
TH, 2017
ÉCOLE DE TECHNOLOGIE SUPÉRIEURE
UNIVERSITÉ DU QUÉBEC
© Copyright
Reproduction, saving or sharing of the content of this document, in whole or in part, is prohibited. A reader who wishes to print this document or save it on any medium must first obtain the author’s permission.
BOARD OF EXAMINERS
THIS THESIS HAS BEEN EVALUATED BY THE FOLLOWING BOARD OF EXAMINERS
Dr. Ruxandra Mihaela BOTEZ, Thesis Supervisor
Department of Automated Production Engineering, École de technologie supérieure
Dr. Lyne Woodward, Chair, Board of Examiners
Department of Electrical Engineering, École de technologie supérieure
Dr. Marc Paquet, Member of the jury
Department of Automated Production Engineering, École de technologie supérieure
Dr. Adrian Hiliuta, External Evaluator CMC Electronics-Esterline
THIS THESIS WAS PRENSENTED AND DEFENDED
IN THE PRESENCE OF A BOARD OF EXAMINERS AND THE PUBLIC DECEMBER 12, 2017
ACKNOWLEDGMENTS
Firstly, I would like to thank my advisor, Professor Ruxandra Botez, for the opportunity to conduct my doctoral research at the Research Laboratory in Active Controls, Avionics and Aeroservoelasticity (LARCASE), and for her guidance and motivation throughout the doctoral program. I would also like to thank Professor Botez, and express my gratitude for the financial support received during my research at LARCASE.
Many thanks to the Green Aviation Research and Development Network (GARDN) and CMC Electronics - Esterline for their support of the research on flight trajectory optimization conducted at the LARCASE, thus, for the research presented in this thesis. In particular, I would like to thank Messrs. Yvan Blondeau, Claude Provençal, Oussama Abdul-Baki, and Mehdi Benzaza for their excellent collaboration throughout this research.
To CMC Electronics-Esterline, and Fonds de développement de l'ÉTS (FDÉTS), I would like to express my appreciation and gratitude for the recognition of the academic achievements, and thus for the financial encouragement represented by the scholarships awarded by them during my doctoral program.
Also, I would like to acknowledge the contributions of my LARCASE colleagues. Oscar, for sharing his knowledge, and for ensuring very good conditions for carrying-out the research activities. Benoit, Samy, and Soufiane for their active participation in the development of the geometrical vertical flight plan optimization algorithms.
A special thank to my family for their constant motivation, encouragements and unwavering support throughout the duration of the doctoral program.
NEW METHODS AIMING TO IMPROVE THE PERFORMANCES OF AIRCRAFT FLIGHT TRAJECTORY OPTIMIZATION ALGORITHMS
Bogdan Dumitru DANCILA
ABSTRACT
In this thesis, three investigations aimed to explore new ways for improving the performances and capabilities of the flight trajectory optimization algorithms used by the Flight Management System.
The first investigation explored a new method of selecting the geographical area considered in the flight trajectory optimization, and the construction of a corresponding routing grid. The geographical area selection method ensured the separate control over the maximal trajectory distance between the departure and destination airports, and the size of the operational area around the airports. The performances of the proposed method were analyzed using flight data from three commercial flights corresponding to short and long-haul flights. The analysis showed that the grids constructed using the proposed method had a lower number of grid nodes than the rectangular grids covering the same maximal and minimal latitudes, and longitudes. Thus, an optimization algorithm would have to evaluate a smaller number of waypoints. The analysis also showed that the proposed method was more adapted for medium and long-haul flight trajectories than for short flight trajectories.
The second investigation explored a new method for reducing the volume of recurring segment performance computations, and the execution times demanded by a flight trajectory optimization algorithm. The proposed method constructed a look-up structure, defining the still-air performance parameters of the ensemble of vertical flight path segments available for the construction of the optimal trajectory. It also constructed a corresponding graph which could be used for aiding in the selection of the vertical flight path segments. The look-up structure and graph construction used the same aircraft performance model and data as the FMS trajectory computation algorithms. The following limitations were imposed in the development of this method: 1) the set of segments defined one climb and multiple horizontal constant-speed cruise, climb-in-cruise, and descent flight paths connecting the Take-Off and the End Of Descent; 2) for each flight phase, the segments correspond to a consigned speed schedule, defined as a couple of Indicated Air Speed and Mach values, and a consigned air temperature; the cruise altitudes were limited by the imposed minimal value, and by the maximal value allowed by aircraft performances, at intervals of 1,000 ft; the number of descent paths was selected through the number of aircraft Gross Weights at the End Of Descent. A number of nine test scenarios were used to analyze the performances of the proposed method, such as: 1) the number of segments composing the look-up structure; 2) the number of graph nodes; 3) the number of possible vertical flight paths connecting the Take-Off to an End Of Descent; 4) the minimal and maximal flight time and distance values,
and their corresponding vertical flight paths; 5) the distribution of the vertical flight paths’ flight time versus flight distance values; and 6) the execution times required to construct the look-up structures and graphs.
The third investigation explored a new method used for the geometrical construction of an optimal vertical flight plan as a function of the lateral flight plan waypoints’ along-the-track distance from the initial waypoint, their altitude and gradient restrictions, and a set of preferred gradient values defined as a function of flight phase and altitude. The main advantage of the proposed method resides in its reduced complexity, and in its increased processing speed relative to the speed of the methods employing the aircraft performance model. A second advantage is the generation of a ground-fixed optimized vertical flight plan, not affected by changing wind conditions. Two implementations of the proposed method adopting different segments construction strategies for consecutive segments leading to conflicting gradient and horizontal segment length requirements were analyzed using 48 test scenarios.
Keywords: flight trajectory optimization, geographical area selection, routing grid, lateral
NOUVELLES MÉTHODES CIBLANT L’AMÉLIORATION DES PERFORMANCES DES ALORITHMES D’OPTIMIZATION DES TRAJECTOIRES DE VOL DES
AVIONS
Bogdan Dumitru DANCILA
RÉSUMÉ
Dans cette thèse, trois investigations ont ciblé l’exploration de nouvelles façons pour améliorer les performances des algorithmes d’optimisation des trajectoires de vol des avions utilisés par les systèmes de gestion du vol.
La première investigation a exploré une nouvelle méthode de sélection de la zone géographique considérée dans l’optimisation de la trajectoire de vol, et la construction d’une grille de routage associée. La méthode de sélection de la zone géographique a rendu possible le contrôle indépendant de la distance maximale entre les aéroports de départ et de destination, et la taille des zones opérationnelles autour des deux aéroports. Les performances de la méthode proposée ont été analysées en utilisant des données de vol en provenance de trois vols commerciaux correspondant aux courtes et longues portées. L’analyse a montré que les grilles construites en utilisant la méthode proposée ont obtenu un nombre de nœuds inférieur au nombre de nœuds correspondant aux grilles rectangulaires couvrant les mêmes intervalles minimales et maximales de latitudes et longitudes. Ainsi, un algorithme d’optimisation devra évaluer un nombre moins important de points de cheminement. L’analyse a montré, aussi, que la méthode proposée a été mieux adaptée pour des trajectoires de vol aux moyennes et longues portées.
La deuxième investigation a exploré une autre nouvelle méthode pour réduire le volume de calculs récurrents des performances des segments, et les temps d’exécution requis par les algorithmes d’optimisation des trajectoires de vol. La méthode proposée a créé une structure de recherche qui définit des paramètres de performance pour des conditions en air permanent, pour l’ensemble de segments des profils verticaux de vol disponibles pour la construction de la trajectoire optimale. La méthode proposée a créé aussi un graphe associé peuvant être utilisé pour la sélection des segments du profil vertical de vol. La structure de recherche et le graphe sont construits en utilisant les mêmes données et modèles de performance des avions que celles des algorithmes d’optimisation de trajectoires dans les systèmes de gestion du vol existants. Les limitations imposées dans le développement de la présente méthode ont été les suivantes : 1) l’ensemble de segments définissant des profils verticaux connectant le point de décollage et le point représentant la fin de la descente; ces segments correspondent à un chemin de montée et plusieurs chemins de vol de croisière à altitude et vitesse constantes, chemins de montée en croisière et chemins de descente; 2) pour chaque phase de vol, les segments correspondent à des consignes de vitesse définies comme des paires composées par une vitesse indiquée et un indice mach, et des températures de l’air constantes; 3) les altitudes de croisière sont limitées en bas par une valeur minimale imposée, et en haut par une valeur maximale permise par les performances de l’avion à des intervalles de 1,000
pieds; 4) le nombre de chemins de descente est défini par le nombre de valeurs du poids brut de l’avion associés au point de fin de descente. Au total, neuf scénarios de test ont été utilisés pour analyser les performances de la méthode proposée, tel que : 1) le nombre de segments composant la structure de recherche; 2) le nombre de nœuds du graphe; 3) le nombre total de profils verticaux connectant le point de décollage et chaque point de fin de descente; 4) les valeurs minimales et maximales pour les temps et distances de vol et les profils verticaux correspondants; 5) la distribution des valeurs de distance versus les valeurs de temps de vol pour l’ensemble de profils verticaux; 6) les temps d’exécution pour la construction de la structure de recherche et pour le graphe.
La troisième investigation a exploré une nouvelle méthode utilisée pour la construction géométrique du profile vertical optimal en fonction du plan de vol horizontal (notamment les distances des points de cheminement composant le plan latéral de vol par rapport au premier point de cheminement, et les contraintes d’altitude et gradient associées à chaque point de cheminement) et d’un ensemble de valeurs de gradients préférés définis en fonction de la phase de vol et l’altitude. L’avantage principal de la méthode proposée réside dans sa simplicité et dans sa vitesse de traitement augmentée par rapport à la complexité et la vitesse des méthodes utilisant le modèle de performance des avions. Un deuxième avantage est la génération des profils verticaux optimisés qui sont fixés par rapport au sol, dont qui ne changent pas avec la variation des conditions atmosphériques. Deux implémentations adoptant des stratégies différentes pour les cas dans lesquels la construction de segments consécutifs conduisent aux conflits par rapport aux requis relatifs à l’emploi des valeurs de gradients préférables, et à la longueur des segments horizontaux. Les deux implémentations ont été analysées en utilisant une série de 48 cas de tests.
Mots clé: optimisation des trajectoires de vol, sélection d’une zone géographique, grille de
TABLE OF CONTENTS
Page
INTRODUCTION ...1
CHAPTER 1 LITERATURE REVIEW ...5
1.1 Flight trajectory optimization, context and objectives ...5
1.2 Flight trajectory optimization ...8
1.3 Opportunities of improvement for the trajectory optimization algorithms ...15
CHAPTER 2 APPROACH AND ORGANIZATION OF THE THESIS ...19
CHAPTER 3 ARTICLE 1: GEOGRAPHICAL AREA SELECTION AND CONSTRUCTION OF A CORRESPONDING ROUTING GRID USED FOR IN-FLIGHT MANAGEMENT SYSTEM FLIGHT TRAJECTORY OPTIMIZATION ...25
3.1 Introduction ...26
3.2 Geographical area selection ...32
3.2.1 Ellipse area selection on a plane surface ... 33
3.2.2 Area selection on an ellipsoid ... 39
3.2.3 Implementation ... 40
3.3 Construction of the routing grid ...42
3.4 Results ...44
3.5 Conclusions ...46
CHAPTER 4 ARTICLE 2: VERTICAL FLIGHT PATH SEGMENTS SETS FOR AIRCRAFT FLIGHT PLAN PREDICTION AND OPTIMIZATION ...49
4.1 Introduction ...51
4.2 Existing algorithms’ vertical and lateral flight path segment parameters’ computation ...55
4.3 Description of the proposed method ...59
4.3.1 Input configuration data ... 63
4.3.2 Gross weight and center of gravity position ... 64
4.3.3 Maximum flying altitude as function of the gross weight ... 65
4.3.4 The climb flight path and the Top Of Climb ... 66
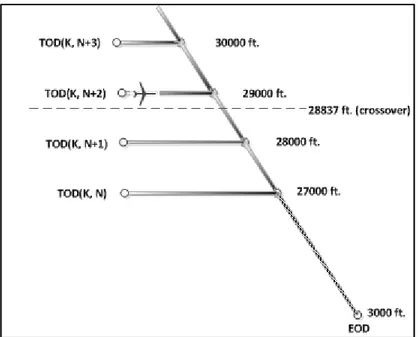
4.3.5 Descent flight paths and the set of Top of Descent points ... 69
4.3.6 Cruise vertical flight paths ... 72
4.3.6.1 Step-climb vertical flight paths ... 73
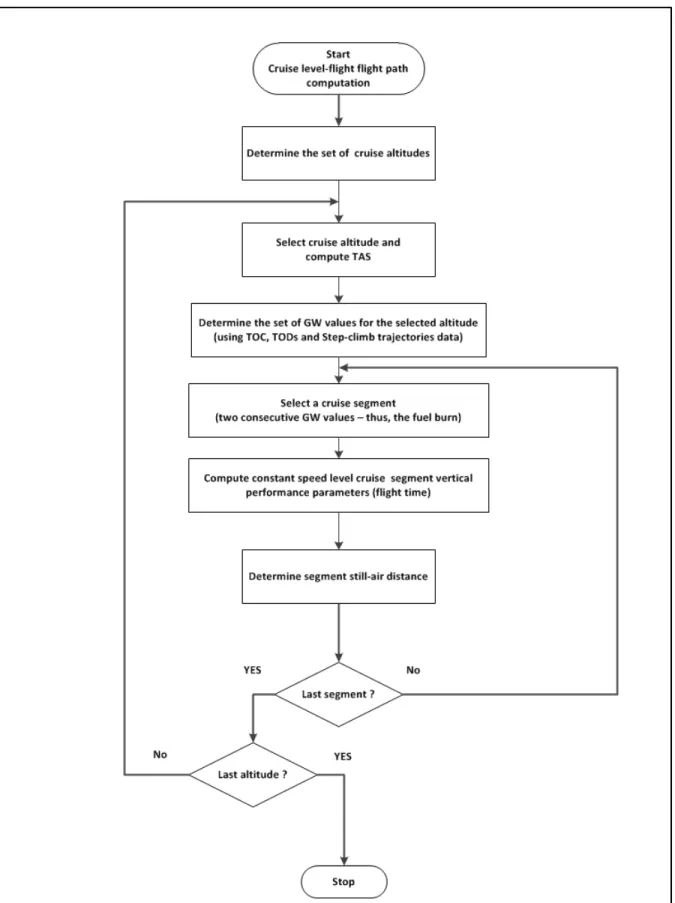
4.3.6.2 Level-flight cruise vertical flight paths ... 73
4.3.7 The vertical flight path look-up structure and the vertical flight path graph ... 75
4.3.8 The vertical and lateral flight plan computation using the vertical flight plan look-up structure and the vertical flight plan graph ... 78
4.5 Conclusions ...92
CHAPTER 5 ARTICLE 3: OPTIMAL VERTICAL FLIGHT PLAN CONSTRUCTION AS FUNCTION OF FLIGHT PHASE AND ALTITUDE ...97
5.1 Introduction ...99
5.2 The Optimization Methodology ...103
5.2.1 Pre-processing ... 105
5.2.2 Vertical Flight Plan Optimization ... 110
5.3 Results ...116
5.4 Conclusion ...124
CHAPTER 6 DISCUSSION OF THE RESULTS ...127
CONCLUSION AND RECOMMENDATIONS ...135
LIST OF TABLES
Page Table 3.1 The relationship between the ellipse’s parameters for the cases described
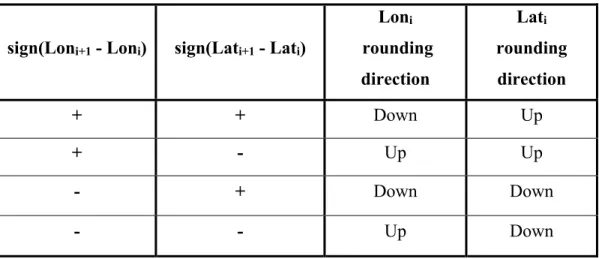
n Figure 3.4 and Appendix I, Figure-A I-1 to Figure-A I-6 ...38 Table 3.2 Selected contour point’s latitude and longitude rounding logic used
for determining the routing grid’s coordinates structure ...43 Table 4.1 The set of test configuration parameters common to the nine scenarios ...86 Table 4.2 The sets of test configuration parameters specific to each test case ...87 Table 4.3 The topologies of the sets of flight paths described by the resulting
vertical flight path look-up structures and vertical flight path graphs ...88 Table 4.4 The vertical flight path graphs’ total number of flight paths, the minimum and
maximum flight times and still-air distances ...89 Table 5.1 The preferred gradient versus horizontal segment insertion trade-off
implemented by algorithms “A” and “B” ...117 Table 5.2 The phase and altitude-dependent preferred gradients ...117 Table 5.3 The flight plan data (atd, constraint, alt1 and alt2) corresponding to
Figure 5.5 and Figure 5.6 ...118 Table 5.4 The flight plan data (atd, constraint, alt1 and alt2) corresponding to
Figure 5.7 and Figure 5.8 ...120 Table 5.5 The flight plan data (atd, constraint, alt1 and alt2) corresponding to
Figure 5.9 and Figure 5.10 ...122 Table 5.6 Algorithm execution times for the “A” and “B” implementations,
LIST OF FIGURES
Page
Figure 3.1 The constructive parameters of an ellipse ...34
Figure 3.2 The elements of the ellipse considered for the construction of the routing grid...35
Figure 3.3 The segments composing a trajectory between P1 and P2 intersecting the contour of the ellipse ...36
Figure 3.4 The shape of an ellipse as a function of its eccentricity (e) values presented in Table 1 ...39
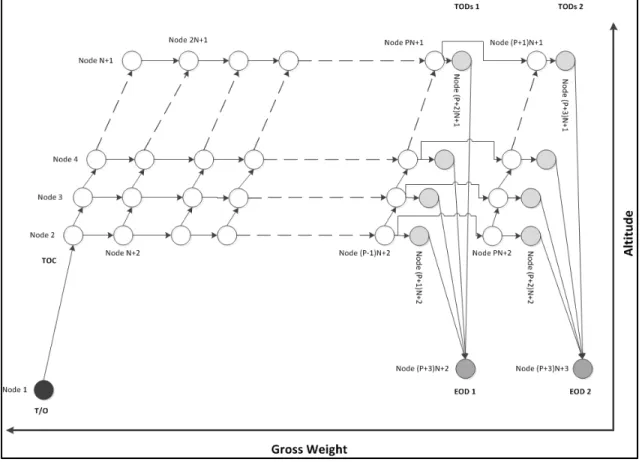
Figure 4.1 The vertical flight path graph corresponding to a look-up structure describing a climb path, a cruise phase composed of N cruising altitudes, P step-climb flight paths, and two sets of descent flight paths corresponding to two expected landing gross weights ...62
Figure 4.2 The climb vertical flight path computation workflow ...67
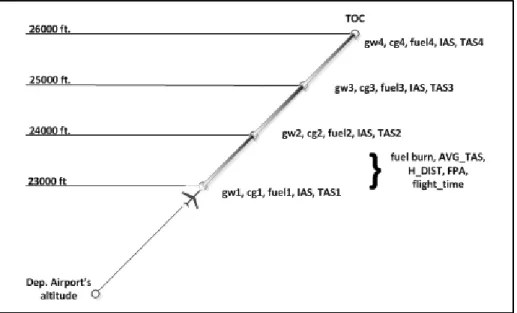
Figure 4.3 The pre-computed climb vertical flight path parameters ...68
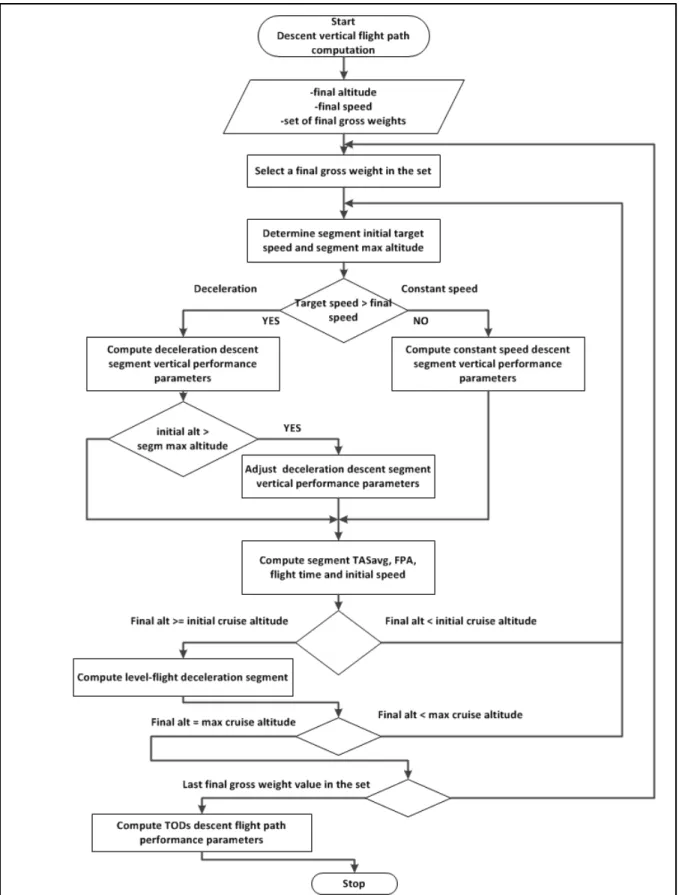
Figure 4.4 The descent vertical flight paths’ computation workflow ...70
Figure 4.5 Example of a descent flight path – the deceleration and descent segments ...71
Figure 4.6 The level-flight cruise vertical flight path computation workflow ...74
Figure 4.7 The vertical flight path look-up structure and vertical flight path graph computing workflow ...77
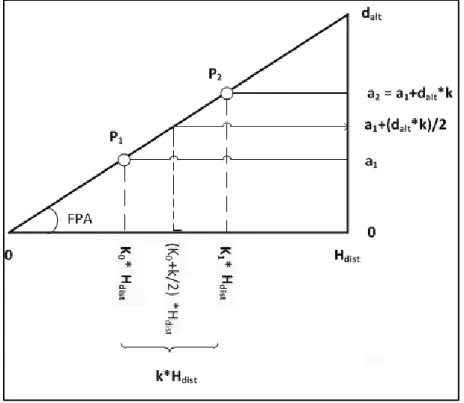
Figure 4.8 Example of fractional constant-speed climb segment performance computation...79
Figure 4.9 The flight plan computation workflow ...83
Figure 4.10 The flight plan segment’s computation workflow ...84
Figure 5.1 Example of successful “Gradient” waypoint insertion: a) original flight plan, b) pre-processed flight plan ...108
Figure 5.2 Example of failed “Gradient” waypoint insertion: a) original flight plan, b) pre-processed flight plan ...108
Figure 5.3 Example of a pre-processed flight plan and the corresponding
domains parsing ...110 Figure 5.4 Optimal flight plan computation flowchart ...113 Figure 5.5 Comparative vertical flight plan segment count differences due to algorithms’
adopted trade-offs: altitude profiles relative to the flight envelope ...119 Figure 5.6 Comparative vertical flight plan segment count differences due to algorithms’
adopted trade-offs: gradient profiles ...119 Figure 5.7 Comparative vertical flight plan segment count differences due to algorithms’
segment gradient selection: altitude profiles relative to the
flight envelope ...121 Figure 5.8 Comparative vertical flight plan segment count differences due to algorithms’
segment gradient selection: gradient profiles ...121 Figure 5.9 Comparative vertical flight plan differences due to algorithms’ segment
gradient selection: altitude profiles relative to the flight envelope ...123 Figure 5.10 Comparative vertical flight plan differences due to algorithms’ segment
LIST OF ABREVIATIONS
2D Two dimensional
3D Three dimensional
4D Four dimensional
ATC Air Traffic Control
ATD Along-the-Track Distance
ATM Air Traffic Management BADA Base of Aircraft DAta
BTS Bureau of Transportation Statistics CDA Continuous Descent and Approach CO2 Carbon dioxide
CYUL Montreal – Pierre Elliott Trudeau International Airport CYYZ Toronto – Pearson International Airport
DST Decision Support Tools
EHAM Amsterdam Airport Schiphol
EOD End Of Descent
ETE Estimated Time En-route FMS Flight Management System
GA Genetic Algorithms
GAME General Aircraft Modeling Environment
GARDN Green Aviation Research and Development Network GRIB GRIdded Binary Format
LARCASE Research Laboratory in Active Controls, Avionics and Aeroservoelasticity LFPG Paris Charles de Gaulle Airport
NextGen Next Generation Air Transport System NOx Nitrous Oxide gases
OTS Organized Track System RTA Requested Time of Arrival T/O Take-Off
TOC Top Of Climb
TOD Top Of Descent
WMO World Meteorological Organization
LIST OF SYMBOLS AND UNITS OF MEASUREMENTS
a ellipse semi-major axis length (Nm) altitude altitude (ft)
alt1 waypoint first altitude constraint (ft) alt2 waypoint second altitude constraint (ft) atd Along-the-Track Distance (Nm)
b ellipse semi-minor axis length (Nm)
c ellipse main-axis extension distance (Nm or deg) cg center of gravity position (%MAC)
CGREFDIST aircraft center of gravity reference point’s position, as a distance from the aircraft’s reference point (m)
constraint waypoint constraint type (None, At, AtOrBelow, AtOrAbove, Gradient, or Window)
Crossover altitude altitude at which the TAS values corresponding to a Speed schedule’s IAS and Mach are equal
d half-distance between the departure and destination airports (Nm) d1,d2 waypoint 1 and 2 Along-the-Track Distance values (Nm)
dalt altitude variation (ft)
e ellipse eccentricity (dimensionless) f ellipse focal distance (Nm)
FPA Flight Path Angle (deg) ft feet
fuel fuel weight (Kg)
gradient ground-referenced segment rate of climb or descent (ft/Nm)
graph node a graph point corresponding to the intersection of two or more graph edges
graph edge a graph transition corresponding to a vertical flight path segment stored in the look-up structure
GNDdist ground-referenced horizontal distance (Nm) GNDspeed ground referenced horizontal speed (Kts)
GS ground speed (Kts)
gw gross weight (Kg)
h hour
h1, h2 altitudes at waypoints 1 and 2 (ft)
Hdist horizontal distance (Nm)
Hspeed horizontal speed (Kts) IAS indicated airspeed (Kts)
ISA_Dev air temperature deviation from the value corresponding to the standard atmosphere (°K or °C)
LEMAC the leading-edge, mean aerodynamic chord position with respect to the datum (m)
Look-up structure structure storing the set of pre-computed climb, cruise and descent vertical flight path segments
Kg kilogram
Kts knots
lat latitude (deg)
lb pound
min minute
Ma aircraft moment (Kg m)
MAC Mean Aerodynamic Chord (m)
Mach Mach index (dimensionless)
Mf fuel moment (Kg m)
MIN_DIST horizontal segment imposed minimal distance (Nm)
Nm nautical mile
Step-climb constant speed climb segment used for increasing the cruise altitude Step-descent constant speed climb segment used for decreasing the cruise altitude TAS true air speed (Kts)
tclb climb segment flight time (h) tcrz level-flight segment flight time (h)
Vspeed vertical speed (Kts)
zfgw zero fuel gross weight (Kg)
zfwcg zero fuel weight center of gravity position (%MAC) α segment climb/descent angle (deg)
γ segment slope (ft/Nm)
INTRODUCTION
Similarly to other industries, the aviation industry is fulfilling present and future economical and environmental responsibilities by ceaselessly exploring new ways of improving the operational efficiency (fuel burn, flight times, and costs), and by reducing the volume of pollutant gas emissions.
As shown by the Bureau of Transportation Statistics (2017) (BTS), the volume of fuel consumed by the US Carriers in 2016 on domestic and international scheduled flights amounted to 17,044.7 million gallons (equivalent to 54,197.8 million kilograms), for a fuel cost of 24,654 million US dollars. According to the 2005 emission indexes presented in Kim et al. (2007, p. 332, Table 3), each kilogram of fuel burned by an aircraft produces 3.155 kilograms of Carbon Dioxide (CO2) and 0.0142 kilograms of Nitrous Oxide gases (NOx),
respectively. This translates to a total quantity of 170,994 million kilograms of CO2 and
769.6 million kilograms of NOx emitted in the atmosphere in 2016. By assuming an average
reduction of the fuel burn by 1%, the annual fuel cost reduction would amount to 246.54 million dollars, and determine a reduction of gas emissions of 1,709.9 million kilograms of CO2 and 7.69 million kilograms of NOx. Additional cost reductions would be produced by
the decreases in total flight times.
Given the wide range of aircraft types currently in operation, their age and technological diversity, and by consequence their performances and capabilities variations, the fastest and most feasible method for attaining the economical and environmental objectives, applicable to all aircrafts, is the employment of optimal flight trajectories.
A flight trajectory represents the path of an aircraft in four-dimensional (4D) space – latitude, longitude, altitude, and time - from its actual position to the destination airport, and is described by a flight plan which is decomposed in two components: 1) the lateral flight plan characterizing the sequence of geographical locations overflown by the aircraft, and 2) the
vertical flight plan describing the profile of altitudes (which depends on the aircraft’s performances) along the lateral flight plan.
The optimization can be performed relative to the lateral, vertical, or the entire flight plan. The actual objectives of a flight trajectory optimization are adapted to the different contexts in which they are being used. On the ground, in the context of Air Traffic Management (ATM), various Decision Support Tools (DSTs) employ trajectory optimization algorithms with objectives corresponding to reducing aircrafts’ flight times and gas emissions in the control center’s responsibility area, increasing the traffic flow, and reducing the number of conflicts. The optimization may be performed as a function a number of factors such as: atmospheric conditions (winds, storm activity, etc.), the aircrafts’ performances, altitudes, speeds or Requested Time of Arrival (RTA) constraints, presence of No-Fly Zones, and airports’ traffic limitations (Swierstra & Green, 2003).
In the context of airline operations services, the optimization algorithms are used for determining the optimal trajectories minimizing flight time, fuel burn and gas emissions, flight cost corresponding to the entire flight plan, or just to specific sections of the flight plan. However, on-board aircraft optimization functions’ capabilities are not as advanced as the on-ground algorithms due to the limited computing power of the Flight Management System (FMS) (Liden, 1992a; Liden, 1992b).
In 2010, at the ETS, the Laboratory of Research in Active Controls, Aeroservoelasticity and Avionics (LARCASE) started the investigation of new FMS methods and algorithms for reducing aircrafts’ environmental footprint, in partnership with CMC Electronics-Esterline, as part of a research program launched by the Green Aviation Research & Development Network (GARDN). The optimization methods were conceived, among others, to compute optimal altitudes (Dancila, Botez & Labour, 2012), optimal vertical profiles for given lateral flight plans (Murrieta Mendoza, Beuze, Ternisien & Botez, 2015), or optimal vertical and lateral flight plans (Félix Patrón, Kessaci, Botez & Labour, 2013). A detailed list of the results of the investigations conducted at the LARCASE laboratory, as part of the GARDN
program is available on the laboratory’s website (http://en.etsmtl.ca/Unites-de-recherche/ LARCASE/Recherche-et-innovation/Publications?lang=en-CA.)
The objective of the research presented in this thesis was to explore new methods of enhancing the performances and capabilities of the flight trajectory optimization algorithms. This research was performed as a continuation of the investigations conducted by the author during his M.Eng. program at the LARCASE laboratory (Dancila et al., 2012 ; Dancila, Botez & Labour, 2013).
The research focused on three main subjects:
1. Development and evaluation of a new method for selecting the set of candidate waypoints used by the optimization algorithm by means of determining the contour of the geographic area confining the candidate waypoints. The first hypothesis was that the proposed method of selection of the geographic area used for the computation of the optimal flight trajectory provides the means to control the size of the operational area around the departure and destination airports, and the maximal trajectory distance between the two airports. The second hypothesis was that a grid constructed to closely circumscribe this selected area would minimize the number of grid nodes considered in the trajectory optimization process, while allowing the exploration of all geographic areas that meet the criteria set relative to the trajectory maximal distance, and to the sizes of operational areas around the two airports.
2. Development and evaluation of a new method of reducing or eliminating the need for repetitive time and resource-intensive performance calculations for the computation of an optimal trajectory, by decoupling the lateral and vertical flight plan calculations, and by the employment of pre-computed vertical flight path data. The first hypothesis was that the proposed method is capable of computing and assembling the still-air performance data for vertical flight path segments corresponding to all flight phases. The second hypothesis was that the set of still-air vertical flight path segments data allows the construction of a range of full vertical flight paths necessary for flight trajectory optimization.
3. Development of a new method for geometrical construction of an optimal vertical flight plan (climb, cruise, and descent) based on the specifications of an input lateral flight plan (waypoints’ Along-the-Track Distance (ATD), and altitudes constraints), and a set of preferred gradient values defined as a function of the flight phase and altitude. The hypothesis verified in this research was that the proposed method is capable of constructing an optimal vertical flight plan minimizing the number of vertical segments, using a geometrical approach.
A description of the organization of the thesis and the methodology employed in each research is presented in Chapter 2 “Approach and Organization of the Thesis”.
CHAPTER 1 LITERATURE REVIEW 1.1 Flight trajectory optimization, context and objectives
A detailed description of the concepts, implementation and economical and environmental benefits of performance-based operations, represented by optimal trajectories determined function of the aircraft’s performances and atmospheric conditions is presented by SESAR Joint Undertaking (2015).
Palopo, Windhorst, Suherwardy & Lee (2010) conducted a comparative study of recorded and wind-optimal flight routes, for a period of 365 days, and concluded that the wind-optimal flights yielded an overall economy of 210 lb of fuel, and 2.7 minutes of flight time reduction per flight. Their study showed that these economies were obtained without a significant impact on the airport arrival rates, and reduced the number of conflicts by an average of 29%. In another investigation, on the advantages of using continuous descents at the Atlanta airport, Wilson & Hafner (2005) showed potential flight time reductions of up to 45 hours per day, and fuel cost reductions of 80,000 dollars per day, which amounts to 29 million dollars per year, accompanied by a 50% reduction in the number of potential conflicts.
Dancila, Botez & Ford (2014), and Murrieta Mendoza, Botez & Ford (2016) studied the negative effect of a missed approach (that can be caused, among others, by approach trajectory and runway conflicts, or by adverse atmospheric conditions) on flight time, fuel burn, gas emissions, and costs. These studies show the importance of predicting flight trajectories free of conflicts, especially in the approach and landing phases of the flight.
Currently, the flight trajectory optimization is subject to intense research aiming to extend the performances and capabilities of the optimization algorithms by taking advantage of the new, and more powerful computation platforms, new navigation principles and policies, better weather predictions, advancements in aircraft modeling and performance predictions, etc.
A direction of research addressed the lateral and the vertical fight trajectory performance prediction variations due to the differences in platform implementation, as shown in the analysis performed on a set of test benches and simulators from seven different manufacturers by Herdon, Cramer & Nicholson (2009).
In their paper, Swierstra & Green (2003) noted that ATM DSTs may use various prediction algorithms, each algorithm having distinct capabilities that are dependent on the particular objective of the DST application. This variety of capabilities translates into different levels of accuracy and uncertainty of the predicted trajectories, and of the computation speeds which in turn affect the quality of the decisions, thus, the aircrafts’ trajectories. Their research focused on finding the important performance and design factors to be taken into account in the development of trajectory prediction algorithms; the resulting algorithms aimed to ensure common capabilities, balance the prediction algorithms’ accuracy and speed, and be applicable on a large spectrum of ATM DSTs uses.
Paglione, Garcia-Avello, Swierstra, Vivona & Green (2005) described a methodology providing common capabilities for the validation of the trajectory predictors. This methodology makes use of a database containing actual Air Traffic Control (ATC) aircraft flight data, and environmental recordings, in Extensible Markup Language (XML)
A synthetic overview of the concepts, key components, operational principles and policies defined by the Next Generation Air Transport System (NextGen) as a guideline for future improvements of the DSTs used in improving aircraft trajectories, traffic flow, and flight safety was provided by Souders, McGettigan, May & Dash (2007). The new principles and policies opened the way for user preferred routes which, in comparison with the current operational policies based on a fixed set of waypoints and airways, can take better advantage on the wind conditions and aircraft performances.
Steiner et al. (2007) presented a new theoretical solution for expanding the weather information used by the ATM DSTs by generating and incorporating probabilistic weather
information constructed from a set of 10 to 50 distinct sets of forecasts, each forecast corresponding to a time frame and a geographic area. The probabilistic information characterizes the prediction uncertainty and opens the way for better adapted flight routing, and traffic management strategies and decisions based on information that cannot be ascertained from individual forecasts.
Another important aspect of the trajectory optimization is the aircraft performance model. Suchkov, Swierstra & Nuic (2003) discussed the impact of the aircraft performance model used in trajectory prediction on the accuracy, efficiency, and safety of ATM operations. Their analysis considered four types of performance data: manufacturer data described in the aircraft manuals, look-up tables, performance model based on the dynamic model of the aircraft such as the Base of Aircraft DAta (BADA), and on a parametric-based kinematic model such as the General Aircraft Modeling Environment (GAME). They emphasized the strong influence of the aircraft’s take-off weight on its performances, thus, on the trajectory prediction. The analysis of the operational data from two major airlines showed that the gross weight determined climb trajectory flight time and distances variations between 390 and 2390 seconds, and between 42 and 270 Nm, respectively. Gerretsen & Swierstra (2003) also showed that the aircraft weight has a major influence on its climb performances, but its effects on the descent performances are much smaller.
Ghazi, Botez & Tudor (2015) presented a methodology for the generation of an aircraft’s look-up table-based performance model for the climb phase using the aero- propulsive model identified from the data recorded during flight tests. The method was successfully applied and validated on a Cessna Citation X aircraft model, using a number of 70 flights performed on a level D flight simulator. Murrieta Mendoza, Demange, George & Botez (2015) developed a method for the design of an aircraft’s look-up table-based performance model using the fuel burn data acquired during flight tests. The method was successfully validated on a Cessna Citation X aircraft model, using a number of 66 flights performed on a level D flight simulator.
Dancila (2011) developed a method for predicting the fuel burn for constant speed and constant altitude cruise segments. This method, as opposed to the classical model allowing only the calculation of fuel burn as function of flight time on segments limited to a maximal distance, has the advantage of allowing calculation of flight time as function of specified fuel burnt and eliminating the limitations regarding the segment’s length. The new method converts the classic look-up table-based performance model, requiring multi-dimensional interpolations, into a new look-up structure requiring interpolations only function of flight time (for fuel burn calculations as function of a specified flight time), or fuel burn (for flight time calculation as function of a specified fuel burn). This method was subsequently used in the development of a flight trajectory optimization algorithm determining the optimal altitude minimizing the total cost for flying a constant speed and constant altitude cruise segment, function of the aircraft gross weight at the start of the segment, and of the segment’s length (Dancila, 2011; Dancila et al., 2012).
1.2 Flight trajectory optimization
Huang, Lu & Nan (2012) presented a survey of the numerical algorithms used in aircraft trajectory optimization.
Liden (1992a), and Liden (1992b) presented methods for constructing optimal flight profiles that use cruise step climbs, and the effects of the Cost Index (CI) on the minimal cost flight profile, and found two categories of discontinuities for trajectories with Requested Time of Arrival (RTA), that were caused by the modification of the optimum step climb points; Liden (1992a) further proposed approaches for removing these discontinuities.
Bilimoria & Shepard (1989) studied the performances of cruise trajectory optimization using an aircraft range and gross weight state variables–based dynamic model, and three strategies relative to the constant / variable altitude and speed. They also identified the configuration of
cruise trajectories as a function of a parameter defining the balance between the aircraft flight time and its fuel burn.
Murrieta Mendoza, Beuze et al. (2015) used a Branch-and-Bound algorithm to determine the optimal speed and altitude profiles defining the still-air optimal vertical flight trajectory. This trajectory had minimized the total flight cost of an aircraft whose performance model was described using look-up tables.
Bonami, Olivares, Soler & Staffeti (2013) investigated an aircraft trajectory optimization algorithm based on mixed integer non-linear programming, by using continuous and discrete variables representing aircraft state and decision variables, respectively. The algorithm was implemented using Gauss-Lobatto direct collocation and Branch-and-Bound algorithms.
In their paper, Tong, Schoemig, Boyle, Scharl & Haraldsdottir (2007) presented a set of factors related to the selection of a ground-referenced geometric path for a Continuous Descent and Approach (CDA), and the compromises entailed by low and idle thrust descents. Their study analyzed the characteristics of idle and constant path angle profiles for two aircraft types (B777-200 and B737-700), and a number of aircraft descent configurations. They showed that while an idle descent provided the best performances relative to fuel and gas emissions, its ground-referenced path could not be predicted due to variations in aircraft performances, configurations, and wind conditions. On the other hand, descents following a predetermined geometric path, requiring low thrust were predictable and, thus, usable in a high traffic ATC environment.
Rivas, Valenzuela & de Augusto (2012) described an aircraft global trajectory calculation tool that employed a kinetic modeling approach, and the aircraft’s drag polar and engines performance models. The tool was investigated on a flight between Madrid and Frankfurt, and the results showed that the take-off weight had a major impact on the climb profile, and on the total fuel consumption. The results also showed that wind had an important effect on the predicted trajectory, while non-standard atmosphere conditions had a smaller effect.
Grabbe, Sridhar & Cheng (2006) investigated the advantages of user preferred trajectories over the East Central Pacific. For this investigation, they developed a dynamic programming algorithm (using a dynamic programming grid) capable of determining the wind-optimal trajectory minimizing the flight time. The performances of the algorithm were evaluated using flight data of 911 west and east-bound flights over the East Central Pacific. The results showed that the wind-optimal trajectories led to average flight time reductions of 9.9 minutes, and to distance reductions of 36 Nm. These results also showed that for the wind-optimal trajectories, the number of conflicts was larger than for the nominal trajectories.
Bousson & Machado (2010) presented a direct method for the optimization of 4D trajectories with time constraints at each waypoint by using a pseudo-spectral integration approach and Chebyshev polynomials.
Biljsma (2009) showed that trajectory optimization algorithms based on the control problem of Bolza were prone to convergence issues, i.e. achieving the convergence or converging to a local minimum. He proposed a new method which employs the heading and the speed as control variables, and determines the global minimal (optimal) solution every time.
Jardin & Bryson (2012) developed two methods for calculating optimal trajectories minimizing the flight time in an atmosphere characterized by strong winds, and they further analyzed their performances on a flight route between San Francisco and New York JFK airports, flown at 36,000 feet, with winds reaching 160 Kts. The first method entailed the backward computation of optimal trajectories (extremals) from each of the two airports to a set of other airports in the geographical area of interest. Subsequently, the memorized optimal trajectories were used to determine the optimal trajectory’s headings and flight time as function of the aircraft’s latitude and longitude, by interpolation. The second method, called “neighboring optimal wind routing”, was devised by linearizing the kinematic and optimal heading angle equations near an assumed optimal route. The investigation concluded that the method generated near-optimal trajectories which closely approximated the global optimal trajectories when the wind conditions along the assumed optimal route and the
neighboring optimal route were similar. For the optimal trajectories from San Francisco to New York, the first method flight time was 252 minutes, the second method flight time was 253 minutes, and the geodesic trajectory flight time was 258 minutes. For the flight from New York to San Francisco, the first method flight time was 349 minutes, the second method flight time was 368 minutes, and the geodesic trajectory flight time was 385 minutes.
Hagelauer & Mora-Camino (1998) presented a method for computing an optimal 4D trajectory with multiple time constraints by using dynamic programming and computing time reduction techniques such as the diminution of the search space, by applying pre-execution and execution-time elimination tests, and by using neural networks for aircraft performance and flight cost computations.
Knapp, Jameson, Measure & Butler (2008) presented an aviation routing tool to predict unfavorable weather areas for a given trajectory and time period, and to determine the optimal 4D trajectory that avoids these areas.
Kamgarpour, Dadok & Tomlin (2010) presented a method for determining aircraft trajectories that circumvent adverse weather areas by employing regularly updated weather forecasts, and a receding horizon-based computation method for trajectory update and optimization.
Another research, conducted by Irvine, Hoskins, Shine, Lunnon & Froemming (2012) analyzed and classified three Summer and five Winter North Atlantic weather patterns that influence the optimal routing, and defined simple representations of the atmospheric pollution as function of the flight time, season, latitude, flight time in stratosphere etc. Their study of the optimal trajectories for the New York–London flights showed the connection between the Jetstream position and optimal trajectory latitudes, the dependency function of eastward or westward flights, and showed optimal trajectory flight times variations of up to more than 60 minutes.
Marceau Caron & Hadjaz (2011) proposed a multi-objective ATM trajectory optimization methodology that employs a description of the ground-referenced airspace as a dynamic mesh. In this mesh, all possible aircraft trajectories were defined by considering the existing airways (a static component of the mesh), and the conflict avoidance trajectories (the dynamic component of the mesh). Subsequently, the authors proposed the employment of multi- objective optimization approaches such as “lexicographic order”, or “Pareto front” to determine the optimal solutions. An implementation of the proposed method by considering a mesh covering the whole European airspace, and lexicographic order optimization criteria have resolved more than 98% of the possible conflicting flight trajectories.
Girardet, Lapasset, Delahaye, Rabut & Brenier (2013) proposed a method for generating a wind-dependent free-flight optimal trajectory minimizing the flight time, by using the Ordered Upwind algorithm. This algorithm computes the trajectory headings by minimizing the flight time, and assumes constant altitude and True Air Speed (TAS) values. The method used in the algorithm employs an unstructured triangulated mesh for wavefront calculation and propagation, and has a complexity of O(N logN) where N is the number of points composing the mesh.
Rippel, Bar-Gill & Shimkin (2005) investigated the suitability of global graph search methods such as Dijkstra, reduced-state Dijkstra, A*, and their hierarchical versions for flight trajectory prediction and optimization algorithms whose cost objective model included flight time, altitude, passengers’ comfort and pilot workload. The investigation was performed using a kinematic aircraft model and a 3D graph constructed from a 50 meters resolution grid representation of a 100 by 100 kilometers digital map. The comparison of the results for “reduced-state” and “hierarchical reduced state” versions of Dijkstra and A* algorithms with the results obtained using only the Dijkstra algorithm showed computation time improvements between 60 and 261 times with corresponding cost degradations between 2.9% and 4.4%.
Zillies et al. (2014) analyzed the effectiveness of employing wind-optimal flight trajectories in the European airspace, and the atmospheric circumstances that warrant optimal trajectories diverged from the geodesic, and the magnitude of their deviations. The optimization algorithm used in this research employed a BADA aircraft performance model, meteorological data in the GRIdded Binary (GRIB) format defined by the World Meteorological Organization (WMO) (WMO, 2003), and Dijkstra algorithm on a 4D network representation of the European airspace, with a cost objective minimizing the fuel burn. The evaluation of the algorithm was performed with respect to the fuel burn and flight time using actual air traffic data from 28,153 short, medium and long-haul flights within the European airspace, and performed during one day. The analysis showed that the wind conditions had a strong influence on the optimal trajectories, and long-haul flights warranted larger deviations from the geodesic – up to 172 Nm with fuel burn reductions of up to 0.75%, and flight time reductions of 0.83%.
Ng, Sridhar & Grabbe (2012) developed a trajectory optimization algorithm minimizing the flight time and fuel burn. This algorithm performed the computations in two steps. First, the optimal vertical flight profile is computed for a pre-defined route and altitude constraints using the BADA aircraft performance model. Then, the algorithm determines the optimal horizontal trajectory corresponding to the computed vertical profile, by interpolation using a set of extremals computed using the method presented by Jardin and Bryson (2012). The performances of the proposed algorithm were evaluated on 12,500 long-haul cargo flights from Anchorage to 10 destinations in Asia and U.S.A., performed using five types of aircrafts, and generated flight time and fuel burn decreases up to 54 minutes and 7.6 tons.
Félix Patrón, Kessaci et al. (2013) developed a flight trajectory optimization algorithm that minimizes the flight time, by using a Genetic Algorithm (GA) and a routing grid whose nodes were situated on the geodesic connecting the departure and destination airports, and on four additional “parallel” tracks – two on each side of the geodesic – for a total of five tracks. The distance between the tracks, as well as the number and distance between the nodes were adjustable.
Rodionova, Sbihi, Delahaye & Mongeau (2014) proposed a method for optimizing the aircraft flight trajectories and the traffic throughput over the North Atlantic, between Europe and North America. The method employed a GA and a grid of points constructed using a number of tracks of the Organized Track System (OTS) defined by the International Civil Aviation Organization (ICAO) (ICAO, 2013) where each track had a selected, equal number of waypoints.
Murrieta Mendoza, Botez & Félix Patrón (2015) developed an optimization algorithm for a cruise flight trajectory flown at a constant speed. The optimization algorithm used a look- up table based aircraft performance model, a 2D grid for the set of possible altitudes at each waypoint, and a GA to select the flight plan waypoints’ altitudes minimizing the cost of the cruise phase.
Gil (2011) investigated a method for the optimization of cruise flight trajectories as function of the wind conditions, which used a rhomboidal-shaped routing grid. He noted that for all considered test scenarios, the nodes close to two of the corners were evaluated but not retained in the final solution, which he recognized as an algorithm inefficiency. Subsequently, the areas corresponding to the two corners were eliminated, thus, leading to a hexagonal-shape routing grid.
Devulapalli (2012) investigated flight trajectory optimization methods minimizing the flight distance, capable of achieving any of the lateral, vertical, or 3D trajectory optimizations, using an aircraft dynamics performance model, the available wind information, and observing the set of potential constraints associated with the flight such as waypoints, altitudes and zone restrictions. The methods used Dijkstra and A* algorithms for implementing the trajectory optimization. To decrease the computation time, the implementation using the Dijkstra algorithm also reduced the number of grid nodes, which were contained inside an elliptical contour constructed by setting the ellipse’s foci at the departure and destination nodes, and the eccentricity value was adjusted so that the resulting
grid was compatible with the aircraft’s turn performance and heading constraints at the departure and destination nodes.
1.3 Opportunities of improvement for the trajectory optimization algorithms
The reviewed literature showed the strong interest in the exploration of new optimization algorithms, and the wide range of trajectory optimization algorithms developed to date. The review also emphasized the importance of the support algorithms used by the optimization process such as the selection of the set of candidate waypoints, the aggregation of the necessary weather information, and the aircraft performance prediction computations. The capabilities of the support algorithms (such as the position and number of selected candidate waypoints, the accuracy of the weather information, or the speed and accuracy of the aircraft performance predictions) have a determining contribution to the performances (speed and accuracy) of the optimization algorithms. These observations led to the interest to also investigate new methods for improving the accuracy and capabilities of the support algorithms.
A first area that warranted further investigation was the selection of the candidate waypoints considered in the process of optimization. As shown by Gil (2011), the selection of a set of candidate waypoints disposed as a rhomboidal grid may lead to algorithm inefficiencies due to the evaluation of waypoint that will never be retained in the final trajectory. Other selection methods such as waypoint grids built based on the OTS, investigated by Rodionova et al. (2014), or on a set of parallel tracks situated on both sides of the geodesic (Félix Patrón, Kessaci et al., 2013) may lead to the exploration of geographic areas that do not take full advantage of the favorable wind conditions. These methods, too, may lead to optimization algorithm inefficiencies. The solution presented by Devulapalli (2012) allowed a better adaptation of the grid to the position of the departure and destination points, and to aircraft turn performances. However, upon an in-depth review regarding the construction of the ellipse, it could be observed that the proposed method had an important drawback – directly linking the shape of the ellipse and the grid, controlled by the eccentricity, to the aircraft’s
turn performance and terminal nodes’ heading constraints. Depending on the airports’ positions and the aircraft’s turn performances, this fact may also lead to the selection of geographic areas which could be too wide (including candidate nodes situated too far, thus, not part of the solution) or too narrow (excluding geographic areas and candidate nodes that could be part of the optimal solution). Therefore, this method may also lead to computation inefficiencies.
A second area that warranted further investigation was represented by the aircraft performance modeling and aircraft trajectory prediction methods. Irrespective of the optimization method used, a solution is selected following an iterative computation and evaluation of a series of trajectories or trajectory segments’ performances. Moreover, the optimization algorithm may be executed at regular time intervals in order to update the optimal trajectory as function of the evolution of the wind conditions, aircraft position and its state parameters. Therefore, an optimization algorithm could be improved by employing new aircraft performance calculation and/or trajectory prediction methods that would provide more accurate trajectory predictions, allow the evaluation of more candidate optimal trajectories in a given time frame, and / or ensure faster optimization algorithms’ response times. An example of such algorithm was presented by Dancila (2011) and Dancila et al. (2013).
A third area of interest was the trajectory optimization itself. More specifically, the investigation of a new method addressing the geometrical optimization of the vertical flight plan, having as principal objectives the reduction of the flight plan computation complexity and time. This method would facilitate the trajectory optimization when the succession of waypoints is pre-imposed. As well, this method would provide a fast and straightforward way for computing a full lateral and vertical flight plan when the set of waypoints is not imposed (such as the case with general trajectory optimization algorithms).
The three algorithms proposed in this thesis have addressed the three investigation areas identified above:
1) the selection of the candidate waypoints considered in the optimization; 2) new ways of predicting the performances of a flight trajectory;
3) the geometrical optimization of the vertical flight plan.
While the proposed algorithms were developed for their intended use on FMS platforms, their applicability could be extended to satisfy the needs of the ATM environment.
CHAPTER 2
APPROACH AND ORGANIZATION OF THE THESIS
The research exploring new methods of improving the performances and capabilities of the flight trajectory optimization algorithms, presented in this thesis, was accomplished in four phases as follows:
1. Statement of the problems addressed in the research following a review of existing optimization algorithms, their limitations and impact on optimization performances, and identification of opportunities for improvement.
2. Investigation of a new method for the selection of the geographical area used in the trajectory optimization, and construction of a routing grid circumscribing the selected area.
3. Investigation of a method for the construction of an ensemble of vertical flight path segments, covering the aircraft’s flight envelope, used for flight plan prediction and optimization.
4. Investigation of a method used for the geometrical construction of an optimal vertical flight plan as a function of the flight phase and altitude-dependent preferred gradient values.
In the initial phase of the research, a review of existing optimization algorithms helped to identify the optimization strategies, the steps used by these algorithms and their limitations. Following this review, two directions of investigation aiming to improve specific elements of the optimization were identified: 1) the selection of the set of candidate waypoints considered by the optimization algorithm (geographic area and layout), and 2) the reduction or elimination of the repetitive, time and resource-intensive aircraft performance-based computations used for flight plan prediction and optimization.
In the second phase, a new proposed method addressed the selection of the geographic area containing the candidate waypoints, as a function of the size of the operational areas around the departure and destination airports, and the imposed maximal trajectory distance. An analytical investigation was used to characterize the relationship between the design parameters (mentioned above) and the geometry of the selected area. Also, the proposed method addressed the construction of a routing grid circumscribing the selected geographic area. Finally, the geographic areas selected for pairs of airports describing short and long-haul flights were compared with actual aircraft data of commercial flights connecting these airports.
In the third phase, a new method addressed the construction of an ensemble of vertical flight plan segments data, organized as a look-up structure and a corresponding graph, to be used by the optimization algorithm. This set of data eliminates the need for repetitive computations using the aircraft’s performance model during the calculation of the optimal flight trajectory. A number of nine test configurations were used to investigate the influence of the input configuration parameters on the proposed method’s performances. This investigation focused on the time required to generate the look-up structure and graph, the total number of vertical flight plan segments and total number of vertical flight plan trajectories described by the look-up structure, and the flight time – still-air distance distribution of the vertical flight plan trajectories.
In the fourth phase, upon the identification of the interest shown by CMC Electronics-Esterline, the research focused on the investigation of a new method addressing the construction of an optimal vertical flight plan employing a geometrical approach. Two implementations adopting distinct trade-offs, identified during the design phase, regarding the conflicting vertical flight path construction constraints were evaluated using 48 test configurations.
Chapters 3 to 5 present the set of three journal papers generated, as main author, as result of this research. The three papers were submitted for publication in peer-reviewed journals, one
paper was published and another two papers are currently in the process of review. Additionally, a number of three conference papers were published, two as main author and one as co-author. The conference papers provided a summary presentation of the results obtained in the initial stages of the investigations addressing the construction of an ensemble of vertical flight path segments, and the geometrical construction of an optimal vertical flight plan, respectively.
The research was conducted with the support and advice of Dr. Ruxandra Botez, who also co-authored the journal and conference papers generated as a result of these investigations. Mr. Benoit Beulze, as internship student, participated on the fourth phase of the research and worked on one of the algorithms’ implementations presented in the third paper, which he co-authored. In the initial stage of the fourth phase of the research, Messrs. Benoit Beulze, Sammy Bottollier-Lemallaz and Soufiane Herda, internship students, worked on two out of the three implementations used in the initial exploration of different strategies for the geometrical construction of the optimal vertical flight plan. A comparative presentation of the results of the three implementations was published as a conference paper, authored by Mr Beulze, and co-authored by the author of the present thesis, Messrs. Bottollier-Lemallaz, Herda, and Dr. Botez (Beulze, Dancila, Botez, Bottollier-Lemallaz & Herda, 2015).
The first research paper, “Geographical area selection and construction of a corresponding routing grid used for in-flight management system flight trajectory optimization” (Dancila & Botez, 2016), presented in Chapter 3, was published in Proceedings of the Institution of Mechanical Engineers, Part G: Journal of Aerospace Engineering, in April 2016. It presented a method of selecting an elliptical-shaped geographic area which allowed the simultaneous control of the size of the operational areas around the departure and destination airports, and the maximal distance of the trajectory connecting the two airports. Subsequently, a method was proposed for constructing a routing grid circumscribing the selected geographical area. The mathematical equations, applied to flat surface model, were used to characterize the dependencies between the input design parameters (geodesic distance between the two airports, size of the operational areas, and maximal trajectory distance), the ellipse
constructive parameters and its shape. The method was then applied on three test cases corresponding to pairs of airports representing short and long-haul flights. For each test case, the set of geographical areas, constructed for a number of ellipse eccentricity values (controlling the maximal trajectory distance) were compared with actual trajectory data of commercial aircraft flights connecting the selected pairs of airports, retrieved from FlightAware (2014). For each test case and maximal trajectory distance value, the corresponding numbers of grid nodes were compared with the numbers of nodes of a rectangular-shaped grid covering the same maximal and minimal latitudes and longitudes, thus ensuring the same operational areas around the airports.
The second research paper, “Vertical Flight Path Segments Sets for Aircraft Flight Plan Prediction and Optimization”, was submitted for review and publication to The Aeronautical Journal in November, 2016.
Firstly, the paper presented the methods currently employed for the construction of the vertical and lateral flight plan using the aircraft performance model. Secondly, the paper presented the methods used for computing the still-air parameters (flight time, still-air distance, initial and final altitudes, initial, final and average speeds, fuel burn, and aircraft gross weight) of the sets of segments composing each phase of flight (climb, constant speed level-flight cruise, climb in cruise, or descent segments) by using the aircraft performance model. Thirdly, the paper presented the assembly of the set of flight plan segments into a look-up structure organized following the aircraft’s gross weight and altitude, and the generation of a corresponding vertical flight plan graph used for the selection and retrieval of the flight plan segments’ data stored in the look-up structure. The set of segments composing the look-up structure and the graph describe one climb path and multiple level-flight constant speed cruise paths, climb in cruise paths, and descent paths. Fourthly, the paper proposed a method for the computation of a lateral and vertical flight plan using the vertical flight plan look-up structure, and the vertical flight plan graph. Finally, a set of nine scenarios were used to investigate the construction and properties of the resulting look-up structures and graphs including: the times required for their construction, the number of level-flight cruise,
climb-in-cruise and descent paths, the total number of graph nodes, the total number of vertical flight paths connecting the start of the climb path to the end of a descent path, the maximal and minimal vertical flight plans’ flight times and still-air distances, and the flight-time versus still-air distance distribution of the vertical flight plans.
The third research paper, “Optimal Vertical Flight Plan Construction As Function Of Flight Phase And Altitude”, was submitted for review and publication to The Aeronautical Journal in November, 2016.
Firstly, this paper provided a general overview of the optimization problem which included the description of the inputs (lateral flight plan, and the sets of preferred gradient values function of the flight phase and altitude), and the constraints and limitations imposed in the construction of the optimal vertical flight plan. Next, the paper presented the method used for the computing of the optimal flight plan, its decomposition into the sequence of processing steps, and the corresponding guiding logic and mathematical equations. The first step, prior to the actual optimization, performed a pre-processing of the input lateral flight plan and had two objectives: 1) generating a new representation of the lateral flight plan that would be easily interpreted and processed during the optimization calculations; 2) determining the sequence of climb, level flight, and descent domains, and the lateral flight plan waypoints delimiting them. The second step performed the actual optimization of the vertical flight plan one domain at a time, starting with the first domain, from its first waypoint to its last waypoint. Finally, two sets of results were generated and analyzed, corresponding to two implementations of the optimization algorithm each adopting distinct trade-offs regarding the precedence of one of two constraints imposed in the construction of the optimized vertical flight plan, in the situations that render them mutually exclusive. The two constraints were: 1) the gradients of the vertical flight plan climb and descent segments hade the closest possible values to the preferred values; 2) consecutive climb and descent, or descent and climb segments must be separated by a horizontal flight path segment whose length is equal or larger than a specified value. Each of the two sets of results were generated considering a
series of 48 test scenarios, and allowed the comparative analysis and identification of the effects and influence of the implementation constraints and trade-offs.
CHAPTER 3
ARTICLE 1: GEOGRAPHICAL AREA SELECTION AND CONSTRUCTION OF A CORRESPONDING ROUTING GRID USED FOR IN-FLIGHT MANAGEMENT
SYSTEM FLIGHT TRAJECTORY OPTIMIZATION
Bogdan Dumitru Dancila and Ruxandra Mihaela Botez École de Technologie Supérieure, Montréal, Canada
Laboratory of Research in Active Controls, Aeroservoelasticity and Avionics
This article was published1 in Proceedings of the Institution of Mechanical Engineers, Part G:
Journal of Aerospace Engineering, Vol. 231, No. 5, pp. 809 – 822, April 13, 2016, Paper No. 643104 DOI:10.1177/0954410016643104
Résumé
Cet article propose une nouvelle méthode pour la sélection d’une zone géographique ayant un contour ellipsoïdal et pour la construction d’une grille de routage qui circonscrit le contour de la zone sélectionnée. La grille ainsi construite décrit l’ensemble de points utilisés par les algorithmes d’optimisation des trajectoires de vol pour la détermination de la trajectoire optimale de vol d’un avion en fonction des conditions atmosphériques. Cette méthode a été développée pour son utilisation par des algorithmes d’optimisation des trajectoires, dans le contexte des systèmes de gestion de vol, mais elle est aussi utilisable dans l’environnement de gestion du trafic aérien. La grille de routage limite la distance au sol maximale (entre les aéroports de départ et d’arrivé), maximise la zone géographique (pour une meilleure exploration des conditions atmosphériques) et minimise le nombre de nœuds de la grille. La nouveauté de la méthode proposée réside dans le fait qu’elle permet un paramétrage et contrôle de la surface totale de l’ellipse, et de la taille des zones autour des aéroports de départ et destination requises pour les procédures de décollage et d’atterrissage. Le contour elliptique construit utilisant cette méthode est donc très bien adapté à la
1 The paper presented in this chapter contains minor modifications relative to the version printed in Proceedings
of the Institution of Mechanical Engineers, Part G: Journal of Aerospace Engineering, Vol. 231, No. 5, pp. 809 – 822, April 13, 2016. These modifications were made at the request of the members of the Board of Examiners.