Science Arts & Métiers (SAM)
is an open access repository that collects the work of Arts et Métiers Institute of Technology researchers and makes it freely available over the web where possible.
This is an author-deposited version published in: https://sam.ensam.eu
Handle ID: .http://hdl.handle.net/10985/19602
To cite this version :
Qiang CHEN, George CHATZIGEORGIOU, Fodil MERAGHNI - Extended Mean-Field
Homogenization of Viscoelastic-Viscoplastic Polymer Composites Undergoing Hybrid Progressive Degradation Induced by Interface Debonding and Matrix Ductile Damage - International Journal of Solids and Structures - Vol. 210-211, p.1-17 - 2020
Extended Mean-Field H
omogenization of Viscoelastic-Viscoplastic Polymer Composites Undergoing Hybrid Progressive Degradation Induced by InterfaceDebonding and Matrix Ductile Damage
Qiang Chen, George Chatzigeorgiou, Fodil Meraghni*
LEM3-UMR 7239 CNRS, Arts et Métiers ParisTech Metz, 4 Rue Augustin Fresnel Metz 57078, France * Corresponding author. Email address: fodil.meraghni@ensam.eu
Date: 2020-10-31
Abstract
In this contribution, a probabilistic micromechanics damage framework is presented to predict the macroscopic stress-strain response and progressive damage in unidirectional glass-reinforced thermoplastic polymer composites. Motivated by different failure modes observed experimentally, the damage mechanism in the vicinity of the fibers (namely, the interphase) is characterized by initiating and growing voids. The mechanisms can be formulated through a Weibull probabilistic density function. In contrast, the ductile progressive degradation of matrix initial stiffness is analyzed via the continuum damage theory. To accommodate different damage mechanisms in the matrix and the interphase, a three-phase Mori-Tanaka (MT) method and transformation field analysis approach (TFA) are established within a unified framework that allows simulation of both ductile and discrete damages in different phases. Moreover, the rate-dependent viscoelastic and viscoplastic response of the polymer matrix phase is modelled through a phenomenological model consisting of four Kelvin-Voigt branches and a viscoplastic branch under the thermodynamics framework. The reliability and efficiency of the modified mean-field damage model, based on TFA and Mori-Tanaka scheme, are assessed by comparing the simulated stress-strain response
loading paths at different loading rates. The developed model provides an efficient alternative to the finite-element based full-field homogenization schemes or other mean-field micromechanics techniques that may be compared, as well as a framework for a potential extension of the theory for simulating damage evolution in composites with random reinforcement orientations.
Keywords: Evolving Damage; Probabilistic Density Function; Mori-Tanaka Homogenization;
Transformation Field Analysis; Viscoelastic-Viscoplastic Behavior; Interphase
1. Introduction
Polymeric matrix composites are known to exhibit substantial rate-dependent inelastic stress-strain behavior and accordingly have been simulated by viscoelastic and viscoplastic constitutive models. The inelastic behavior is typically more pronounced in the presence of micro-damage, which significantly affects the macroscopic stress-strain response and the subsequent load-bearing capability of the polymeric matrix composites under transverse tensile, transverse shear, and axial shear loading conditions.
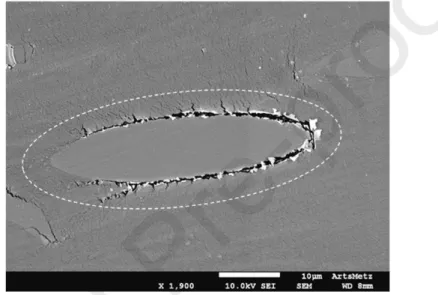
Relative to the monolithic polymers, simulating damage initiation and evolution in fiber-reinforced composites is a more challenging problem due to the myriad damage mechanisms and modes, as well as their complex nature that may be activated at different scales. Hence the nature of inelastic response at the homogenized level in polymeric composites is not always well-understood. Figure 1 illustrates the micrograph of a glass/polyamide composite (PA66/GF30) exhibiting damage accumulation in the matrix surrounding the reinforcement (coating) and at the interface as studied by Arif et al. (2014) as well as by Horst and Spoormaker (1997). It is clear that at least two different damage modes can be identified. Specifically, in the vicinity of the stiff fiber phase, the damage is catastrophic with little energy dissipation and is characterized by the occurrence and the coalescence of voids or defects. From a mechanics point of view, the
appearance of the discrete damage in the near-fiber region is induced by a sudden release of strain energy by debonding at the fiber/matrix interface and propagating by coalescence due to the high stress concentrations or the manufacturing defects appeared in this region. Away from the fibers, however, the matrix failure occurs in a rather slowly progressing manner with higher energy dissipation. Conversely to the interphase, no visible cracks occur in the polymer matrix. Therefore, progressive stiffness degradation is the primary manifestation of this type of ductile damage.
Figure 1 Micrograph of glass/polyamide (PA66/GF30) composites with interfacial damage induced by void growth and coalescence
The potential benefits that may be obtained from the use of composites have led to reviving interest in developing accurate and efficient micromechanical models in order to understand the overall response and underlying failure mechanisms of composite materials from a constituent phase (or microstructure) level. In the past two decades, a large body of work has already been done in the literature to address the above issues, which in general consists of two major categories. The first group of approaches that study the damage and microcracking in heterogeneous materials utilizes the full-field analysis approaches, such as finite-element (Häussler-Combe et al., 2020; Park et al., 2016) and finite-volume numerical techniques (Chen and Pindera, 2020; Chen et al.,
The stress and displacement fields in the analysis domain involving complex geometries, material properties, and boundary conditions can be accurately determined. A major disadvantage of the numerical techniques is the fact that they require substantial effort during the problem definition stage, namely, the mesh discretization of the analysis domain, and may not be easily employed in the parametric studies aimed at understanding the property-structure relationships. Another complication associated with damage simulation encountered in the numerical approaches is the convergence and numerical issues due to the singular stress fields in the vicinity of the cracks and fiber ends. Extensive mesh refinement may be required to ensure the equilibrium of stress in the affected region. An alternative approach to the classical finite-element homogenization is the Fast Fourier Transforms (FFT) (Lahellec and Suquet, 2007; Moulinec and Suquet, 1998). The FFT method avoids mesh discretization and does not require the formation of a stiffness matrix. This approach, however, requires a large number of iterations to obtain convergence in the case of elastic-perfectly plastic matrix reinforced by stiff inclusion (Moulinec and Suquet, 1998). The elasticity-based locally-exact homogenization technique proposed by Wang and Pindera (2016) is a promising exception, but has been only employed thus far in the prediction of the interfacial separation process in unidirectional composites with elastic constituent phases (Wang et al., 2019).
The second group of approaches is based on classical or mean-field homogenization methods. Relative to the full-field analysis approaches, these approaches are more computationally affordable and are semi-analytical. The preparation of the input data is extremely simple and fast, without resorting to computationally demanding discretization of the analysis domain. Simulating interphase with arbitrary thickness is achieved without experiencing convergence issues common to the finite-element approach (Despringre et al., 2016). Many classical or mean-field approaches are found in the literature aimed at understanding the interfacial damage behavior in composite
materials, cf., Matous (2003), Lee and Pyo (2008), Pyo and Lee (2010), Lim et al. (2020), Dinzart and Sabar (2017), Shu and Stanciulescu (2020), and Zhou and Huang (2020). However, to the authors’ best knowledge, thus far, there has been no reported work that is devoted to addressing both ductile and discrete types of damages in mean-field micromechanics-based models in the open literature.
Herein, the modified three-phase Mori-Tanaka TFA approach recently developed by the present authors (Barral et al., 2020; Chatzigeorgiou and Meraghni, 2019), which was limited to modelling the inelastic response of composites with undamaged phases, is further extended to naturally track the evolution of different local damage modes as observed experimentally in Figure 1. In addition to the polymer matrix ductile damage, the developed model accounts for the discrete damage induced by the interphase progressive degradation resulting from the fiber-matrix debonding. The modified Mori-Tanaka model consists of three distinct phases, that is, the fiber, matrix, and interphase. The introduction of the interphase shell has two objectives. First, it allows us to address the excessive overestimation of the macroscopic stress-strain response using the classical Mori-Tanaka approach through an inelastic correction tensor, as demonstrated by Barral et al. (2020). This differs from the linear comparison composite approach developed by Lahellec and Suquet (2007) which requires solving a nonlinear system of equations for identifying the properties of the comparison composites. More importantly, it enables simulating different failure modes in the near-fiber interphase and the matrix area by choosing different damage models. The new approach makes use of a phenomenological viscoelastic-viscoplastic-damage model, developed under the thermodynamics framework by Praud et al. (2017a), to simulate the inelastic dissipations at the polymer matrix phase. The latter is combined with the Weibull probabilistic function to simulate the initiation and the coalescence of micro-cracks in the vicinity of the
reinforcement (referred as the interphase). The model is then extensively validated against the full-field finite-element analysis (FEA) approach using the Abaqus code, which provides a gold standard considered as a reference solution. The comparison is conducted at different loading rates under unidirectional transverse normal, transverse shear, and axial shear loading conditions, as well as more complex nonproportional multiaxial loading conditions. These numerical results demonstrate a good level of accordance between the mean-field Mori-Tanaka TFA and finite-element approaches, suggesting that the proposed method is can capture the complex viscoelastic and viscoplastic deformation mechanisms in polymer composites. The main contribution of the present work includes:
The first time that two different damage modes (discrete damage in the vicinity of the fibers and continuum damage in the polymer matrix region) in composites are analyzed and their effects are predicted using a modified Mori-Tanaka TFA approach.
A comparable finite-element model with the same damage models is implemented in Abaqus via the user material subroutine to verify the modified Mori-Tanaka TFA damage framework.
Demonstration that the modified Mori-Tanaka TFA approach is capable to capture and predict the complex viscoelastic-viscoplastic-damage behavior under various loading conditions generated by the full-field finite-element analysis.
The remainder of the present work is organized as follows: Section 2 introduces the theoretical framework of the probabilistic Mori-Tanaka TFA approach accounting for the evolutionary interfacial debonding and the progressive ductile damage of the matrix region. Section 3 illustrates the numerical implementation and the related iterative strategy used in the
modified Mori-Tanaka scheme. Section 4 demonstrates the effect of Weibull parameters on the interfacial damage growth. The capability of the proposed damage framework for simulating the inelastic response of unidirectional thermoplastic/glass composites is validated in Section 5 vis-à-vis the finite-element results under various loading paths. Discussion and future development of the proposed method is presented in Section 6. Section 7 presents the pertinent conclusions.
2. Theoretical Framework
2.1 Mori-Tanaka based TFA Framework Accounting for the Interphase: A Brief Overview and New Developments
The details of the Mori-Tanaka based TFA framework accounting for the interphase layer, in the absence of damage, can be found in the papers by Chatizigeorgiou and Meraghni (2019) and Barral et al. (2020). Herein, a brief exposition is given to follow the employed methodology in accurately predicting the inelastic response of unidirectional composites.
Like all other micromechanics models, the central problem of the Mori-Tanaka scheme (Mori and Tanaka, 1973) is to determine the strain concentration fourth-order tensor
A
r that relates the average strain in the 𝑟th phaseε
r to the applied macroscopic strain (prescribedε
strain) in the form:(2)
:
r
rε
A ε
In the case of nonlinear constituent phases, the total macroscopic strain is decomposed into elastic εe and inelastic εin contributions as follows:
(3)
e in
ε ε ε
In the TFA method, proposed by Dvorak (1992) and Dvorak and Benveniste (1992), the averaged phase strain is expressed as a function of the applied macroscopic strain and the inelastic strains from all phases as:
(4) 1 : N in : in r r rp p p
ε A ε A εwhere Ainrp represents the fourth-order inelastic concentration tensor. In the classical Mori-Tanaka approach, the elastic and inelastic strain concentration tensors
A
r and Ainr are calculated by embedding a single fiber in the matrix phase and applying the far-field boundary conditions (Mori and Tanaka, 1973). Herein, to account for the void creation and growth in the interphase (coating layer), the modified Mori-Tanaka approach recently developed by Chatizigeorgiou and Meraghni (2019) is adopted. The composite is modelled by three distinct phases, that is, the matrix phase (denoted by subscript 0), the interphase (denoted by subscript 2), and the inclusion (denoted by subscript 1). The ratio between fiber and interphase volume contents is defined as:𝑐1 𝑐2(5) 1 1 2 c c c
Figure 2 A three-phase Mori-Tanaka model with interphase containing voids.For a three-phase composite, Eq. (4) can be rewritten as: (6) 0 0 1 1 2 2 : in : in in: in in: in r r r r r ε A ε A ε A ε A ε
where 𝑟 = 0, 1, 2. The elastic concentration tensor
A
r is given by:(7)
1 0 c0 0 c1 1 c2 2 , 1 1: 0, 2 2: 0 A T T T A T A A T Awhere
T
r denotes the elastic interaction tensor which is expressed for the three phases by:(8)
1 0 , 1 10 (1 ) 20: 12 , 2 12: 1 T I T N N N T N Tis the fourth-order identity tensor and is the Kronecker delta.
/ 2ijkl ik jl il jk
I 𝛿𝑖𝑗
The inelastic concentration tensors Ainrp are calculated by (Chatzigeorgiou and Meraghni, 2019): (9) 00 0 1 10 2 20 01 0 1 11 2 21 02 0 1 12 2 22 10 1 00 10 11 1 01 11 12 1 02 12 20 2 : , : , : , : , : , : , : in in in in in in in in in in in in in in in in in in in c c c c c c A A T T A A T T A A T T A T A T A T A T A T A T A T A00in T20in, Ain21 T A2: 01in T21in, Ain22 T A1: in02 T22in
where Trpin denotes the inelastic interaction tensor which is given by:
(10)
10 1 0 0 11 1 0 20 2 1 12 1 0 20 2 2 20 12 10 21 12 11 2 1 22 12 12 2 2 : : , : (1 ) : : , (1 ) : : : , , : , : in in in in in in in in in T T P T T P N P T T P N P T N T T N T P T N T P where is the matrix volume fraction. 𝑐0
0 ,
1 and
2 are the secant moduli of the matrix, fiber, and interphase phases, respectively. Moreover,(11)
10 0 1 0 20 0 2 0 12 2 1 2 : , : , : N I P N I P N I P (12)
1 0 0 0 1 2 2 2 : , : P S P S where S
0 andS
2 are the Eshelby tensors (Eshelby, 1957) which depend on the properties of the matrix and the interphase, and the geometry of the fiber, respectively. In the case of infinitely long cylindrical fibers embedded in an isotropic matrix, an explicit expression for the Eshelby tensor may be found in the literature (Mura, 1987). Otherwise, the Eshelby tensor must be evaluated numerically using the technique developed by Gavazzi and Lagoudas (1990).In the present work, the elastic moduli of the undamaged matrix and interphase are assumed to be identical, denoted by
C
0, with the viscoelastic and viscoplastic responses modelled using the same constitutive law. Moreover, it is important to note that the classical Mori-Tanaka scheme significantly overestimates the nonlinear response, namely elastoplastic or viscoelatoplastic response, hence the post-yield stress-strain response, as it is based on the average matrix stress assumption. To compensate for the overestimation of the nonlinear response and the apparent nonuniform strain concentration observed in the full-field homogenization technique, a correction tensorY
originally proposed by Barral et al. (2020) is introduced to represent the difference between matrix and interphase inelastic strains:(13)
2 : 0
in in
ε Y ε
For a unidirectional fiber-reinforced composite with fiber oriented in direction, the 𝑥3
correction tensor takes the following form:
(14) 0 0 0 0 0 0 0 0 0 0 0 0 1 0 0 0 0 0 0 0 0 0 0 0 0 0 0 0 0 0 0 N N ST SL SL Y
where
N,
ST, and
SL reflect the inelastic strain concentration components associated with transverse tensile, transverse shear, and axial shear loading modes, respectively.In the case that the fiber is linearly elastic and undamageable, the total phase strains are obtained by substituting Eq. (13) into Eq. (6):
(15)
0 0 0 1 1 0 2 0 0 1 1 0 1 0 0 2 0 0 0 : : : ( ) ( ) : ( ) : : : ( ) : ( ) : ( ) : ε A ε A T S S I Y ε ε T ε T S ε ε ε S I Y ε in in in c cwhere the inelastic strain ε0in is evaluated incrementally using an appropriate phase constitutive law described in the sequel.
It should be noted that the original three-phase Mori-Tanaka TFA framework developed by Chatizigeorgiou and Meraghni (2019) and Barral et al. (2020) was limited to modelling the inelastic response of composites with undamaged phases. Herein, this approach is further extended for simulating progressive damage in composite materials with viscoelastic-viscoplastic phases. The ductile damage in the matrix and the discrete damage in the interphase of the three-phase Mori-Tanaka TFA approach are implemented through the stiffness degradation of the corresponding phases. Therefore, the stiffness tensors
0 and
2 (respectively for the matrix and interphase) in the calculation of matrices associated with the interaction tensors, Eq. (10), are the secant moduli taking into account the damage status. In fact, the stiffness tensors
0 and
2 are estimated using a mechanism-driven evolution law and differ from the initial elastic stiffness tensors that are so far used in the papers by Chatizigeorgiou and Meraghni (2019) and Barral et al. (2020). Specifically, in the former case, the matrix stiffness tensor is updated by the ductile damage variable, driven by the viscoplastic mechanism, whereas the interphase stiffness tensor evolvesaccording to a damage variable related to the microcrack density that follows the Weibull probabilistic function.
2.2 Interfacial Damage with Void Initiation, Accumulation and Probabilistic Evolution
Motivated by the experimental observations in Figure 1, the damage initiation and evolution in the vicinity of the fibers (interphase) are modelled by the initiation and the accumulation of ellipsoidal voids in the interphase layer. The overall stiffness reduction in this layer is characterized by a fourth-order tensor D
c which gradually degrades the initial stiffness tensorC
0 of the interphase layer. The determination of D
c is obtained as a function of void volume fraction (also
c referred as the microcrack density) by assuming the scale separation between the voids and the homogenized interphase medium. One can recall that for a two-phase porous composite, the overall stiffness is given by (Praud et al., 2017b; Praud et al., 2020):(16)
2 c C0D c 1 c C A0: m c
where Am
c is the strain concentration tensor of the net matrix surrounding the voids. In the above equation, the voids are taken into account by assigning zero stiffness to the void inclusion phase. Using the classical Mori-Tanaka approach, the concentration tensor Am
c is calculated directly from the following formula (Praud et al., 2017b; Praud et al., 2020):(17)
1 : 1 m
c m
c m
c c Α T T Twhere
T
m
I
, Tc I S C
0 1 and S C
0 is the Eshelby tensor depending on the stiffness tensor of the net matrix material surrounding the voids and the ellipsoidal geometry of the voids. Substituting Eq. (17) into Eq. (16) produces the following equation for the overall stiffness tensor of the damaged interphase (Praud et al., 2017b):(18)
2 c C0D c C0 cC T A0: c: m c
hence, D
c cC T A0: c: m
c . It is important to point out that the damage in the interphase is assumed to be isotropic. Although the tensors S C
0 ,T
c andA
m do not have major symmetry, the stiffness reduction tensor D
c always does.Progressive interfacial damage, characterized by void initiation and accumulation, may occur under increasing deformation and significantly degrades the overall stress-strain response of the composite. The use of the statistical failure criterion can be justified by scaling concepts and reliability approaches (Hitchon and Phillips, 1978; Wisnom, 1991). Therefore, the evolutionary microcracks in the interphase region are modelled as a two-parameter Weibull probabilistic density function (Weihull, 1951) that is commonly used in the micromechanics-based model to characterize various types of damage mechanisms in composite materials (Despringre et al., 2016; Lee and Pyo, 2008; Meraghni et al., 2002; Praud et al., 2017b). The cumulative probability function of void volume fraction is then expressed in the following form:
(19) 2 max 1 exp eff a c c
where denotes the void volume fraction (or microcrack density) in the interphase.
c
c and are the Weibull parameters that control how rapid interphase microcrack may grow.
a denotes the damage threshold activating the microcrack initiation in the interphase. indicates the Macaulay bracket.
2eff indicates the effective stress in the homogenized interphase medium.
maxhistory. For the sake of simplicity,
a is prescribed as 0 MPa in the following calculations. Under such circumstance, damage can be activated at low stresses, but with very low probability.It is worth noticing that the employed Weibull probability function is subjected to the condition
c
0
since the damage evolution is irreversible. In addition, the von Mises failure criterion is utilized for void initiation whose evolution follows a Weibull-like cumulative probabilistic law. The latter provides a physical-based background for the interfacial decohesion modelling in composites since it is convenient for such a statistical damage mechanism, and it is commonly adopted in micromechanics. The choice of the von Mises failure criterion is motivated by the fact that only two parameters need to be identified. In fact, the formalism of the Weibull function can be easily applied for other types of criteria. The readers are referred to works dealing with interface debonding, among them the study of Lee and Pyo (2008) that incorporates the hydrostatic pressure or studies that adopt a Coulomb based criterion (Desrumaux et al., 2000), or even a quadratic criterion based on interfacial normal and tangential stresses (Jendli et al., 2009). These advanced models may describe better the material behavior but require additional parameters that may be difficult to identify experimentally, especially when combined with micromechanical analyses. Since the objective of this contribution is to investigate the progressive void creation in heterogeneous materials, the failure criterion has been kept simple in the modified Mori-Tanaka TFA approach.3. Numerical Implementation 3.1 Constitutive Model
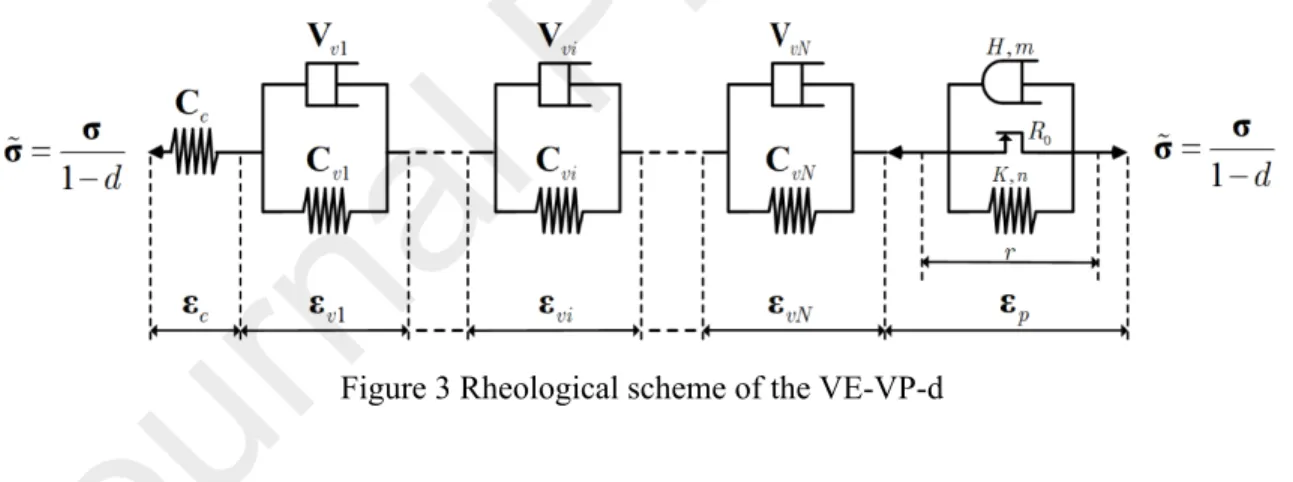
The inelastic phase strains εin0 appearing in the right-hand side of Eq. (15) are evaluated using the viscoelastic and viscoplastic (VE-VP) constitutive model, developed by Praud et al. (2017a), for
semi-crystalline polymers under the infinitesimal deformation assumption and isothermal conditions. Figure 3 illustrates the rheological model comprised of Kelvin-Voigt viscoelastic 𝑁 branches and a viscoplastic branch placed in series. Moreover, different from the discrete damage in interphase, the damage in the matrix phase of the three-phase Mori-Tanaka model is ductile and characterized through continuum damage theory based on the well-known principle of effective stress introduced by Lemaitre and Chaboche (1994). For the isotropic damage, the definition of effective stress is given by:
(20) 1 d σ σ
where denotes the ductile damage variable represented as a scalar quantity that characterizes the 𝑑 state of damage and transforms the homogenized stress σ into the effective stress . The subscript
σ
0 representing the matrix phase is omitted for the sake of simplicity.Figure 3 Rheological scheme of the VE-VP-d
Under the thermodynamics framework, the matrix medium state laws are given by a Helmholtz potential: (21)
1 1 1 , , , , : 1 : 2 1 : 1 : 2 N N vi vp vi vp e vi vp i i N r vi vi vi r d d d R d
ε ε ε ε ε ε C ε ε ε ε C εwhere
C
e (representing the stiffness tensorsC
0) andC
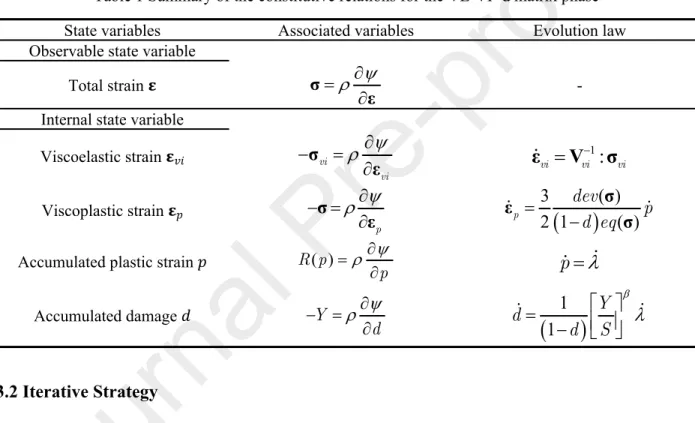
vi are the elastic stiffness tensor and the viscoelastic stiffness tensor of the 𝑖th branch, respectively. The associated thermodynamic variables are expressed by derivation of the potential with respect to their corresponding state variables, which are summarized in Table 1, whereV
vi are the fourth-order viscous tensors,σ
vi are the viscoelastic stresses, dev( ) designates the deviatoric stresses, eq( ) is the equivalent von 𝛔 𝛔 Mises stress.Table 1 Summary of the constitutive relations for the VE-VP-d matrix phase State variables Associated variables Evolution law Observable state variable
Total strain 𝛆
σ
ε
-Internal state variable
Viscoelastic strain 𝛆𝑣𝑖 vi vi
σ ε 1: vi vi vi ε V σ Viscoplastic strain 𝛆𝑝 σ ε p
3 ( ) 2 1 ( ) p devd eq p σ ε σ Accumulated plastic strain 𝑝 R p( )
p p
Accumulated damage 𝑑 Y d
1 1 Y d d S 3.2 Iterative StrategyThe inelastic strains are evaluated using the radial return mapping technique (Chatzigeorgiou et al., 2018; Simo and Hughes, 1998). The backward Euler time implicit numerical scheme states that the value of a given quantity can be expressed as the previous converged value 𝐱 𝐱(𝑛) plus an increment Δ𝐱(𝑛 + 1) resulting from the imposed value : 𝐱(𝑛 + 1)= 𝐱(𝑛)+ Δ𝐱(𝑛 + 1). Such an implicit relation is solved iteratively based on the Newton-Raphson method, as detailed in the reference
book by Simo and Hughes (1998). The current value is updated for each constitutive law correction iteration by: 𝑘 𝐱(𝑛 + 1)(𝑘 + 1)= 𝐱(𝑛 + 1)(𝑘)+𝛿𝐱(𝑛 + 1)(𝑘) until 𝐱(𝑛 + 1) converges.
Herein, the local strain in the 𝑟th phase in Eq. (6) is then rewritten as:
(22) 1 ( )
1
( 1)( ) 0 : N : n k n n in in n k r r rp p r
ε A ε ε A εwhere εin np( 1)(0) εin np( ). The alternative approach for calculating the viscoelastic response is to solve the transformed viscoelastic function in the Laplace domain using the correspondence principle (Lévesque et al., 2007). But this approach depends on the accuracy and efficiency of the chosen Laplace inversion scheme.
3.3 Homogenized Constitutive Equation
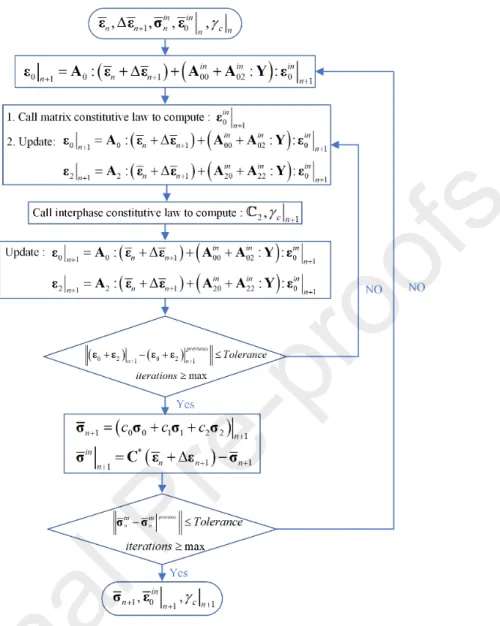
The modified Mori-Tanaka TFA approach developed herein makes use of the secant stiffness matrix approach to compute the homogenized stress-strain response. Figure 4 illustrates the flowchart of the computational algorithm of the modified Mori-Tanaka TFA simulation. The macroscopic constitutive equation can be expressed as:
(23)
* in
σ C ε σ
where C* is the initial homogenized stiffness matrix of the three-phase composite given by:
(24) * 0 0: 0 1 1: 1 2 2: 2 c c c C C A C A C A
where
C
0,C
1, andC
2 (C
2=C
0), are the undamaged (elastic) stiffness tensors of the matrix, fiber, and interphase phases, respectively. It should be noted that the calculation of * isC
performed just once, regardless of the amount of damage and inelastic strains. For a given applied macroscopic strain
ε
, the inelastic stress σin C ε σ needs to be solved iteratively because it. The convergence of is achieved till either the difference between two successive iterations
c
σinis within a specified tolerance or the iterations reach a prescribed maximum number. The homogenized stress used in the calculation of
σ
σin is obtained directly by adding up all the average phase stresses as follows:(25) 0 0 1 1 2 2
c
c
c
σ
σ
σ
σ
where (26)
0 0 0 0 0 0 0 1 1 1 1 1 2 2 2 0 0 2 0 : 1 : : : : : : : in in in in c d σ ε ε C ε ε σ ε C ε σ ε Y ε C D ε Y ε Figure 4 Flowchart of the computational algorithm in modified Mori-Tanaka TFA simulation
It is worth mentioning that the secant stiffness matrix approach adopted herein is advantageous compared to the tangent moduli approach typically employed in the full-field analysis approaches such as the finite-element technique in several aspects. It eliminates the development of the fourth-order tangent operator that must be updated at each iteration of every load step which involves a lot of computational efforts. Secondly, in the case of simulating composite materials where the large property contrast between the constituent phases produces
large stress and deformation gradients, the tangent stiffness matrix approach may encounter convergence issues and numerical instabilities, especially in the presence of nonlinear constituent phases and microcracks. This problem, however, is not observed in the secant stiffness matrix approach.
4. Sensitivity Study
In this section, the modified Mori-Tanaka TFA framework developed in this work is employed to describe the load/unload nonlinear stress-strain response of unidirectional composites with evolving damage. The material system investigated herein is a glass/polyamide (PA66) composite, whose constituent phase material properties which are taken from Praud et al. (2020) are listed in Table 2. The large property mismatch between the glass fiber and thermoplastic matrix phase yields large deformation and stress gradients in the vicinity of the fibers (interphase), hence providing a demanding test of the correctness and robustness of damage framework. While the glass fiber is taken as linearly-elastic, the polyamide matrix exhibits ductile damage coupled to viscoelastic-viscoplastic behavior. The latter is modelled through four viscoelastic Kelvin-Voigt branches and a viscoplastic branch, which captures a wide range of strain rates while keeping a reasonable computation amount. The glass fiber volume fraction and the ratio of the fiber and interphase volume are fixed at 𝑐1= 20% and 𝜑 = 57%, respectively as detailed by Barral et al.
(2020). In practice, the volume fraction of the interphase can be identified upon securing the micrograph of the cross section of coated reinforcements exhibiting discrete damage in the vicinity of the reinforcements. The values of the three components of the inelastic correction tensor are assumed to be constant (invariant of the loading path and the strain level) and
N, ST,SL
Y
are identified through the optimization strategy detailed by Barral et al. (2020) by calibrating with the reference full-field homogenization results over all the volume fraction range under various
loading conditions. The correction tensor previously identified for the thermoplastic matrix reinforced by glass fiber by Barral et al. (2020) is directly utilized herein. Last but not least, since the observed damage mechanism in the matrix phase away from the fiber is ductile, the following damage saturation function
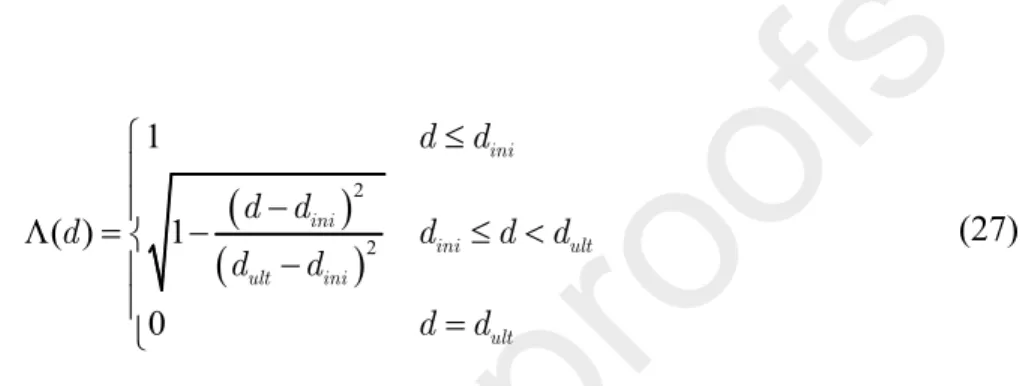
d is employed at the matrix phase such that the damage coefficientwill not exceed its limit: 𝑑 (27)
2 2 1 ( ) 1 0 ini ini ini ult ult ini ult d d d d d d d d d d d d where 𝑑𝑖𝑛𝑖 and 𝑑𝑢𝑙𝑡 denote the initial and ultimate damage saturation limits, respectively, which,
in practice, are estimated in a simple tensile experiment of a monolithic polyamide specimen. In the present work, the damage saturation limits 𝑑𝑖𝑛𝑖= 0.45, and 𝑑𝑢𝑙𝑡= 0.6 are utilized such that the
finite-element simulation for comparison with the Mori-Tanaka TFA approach described in Section 5 will not run into numerical and convergence problems.
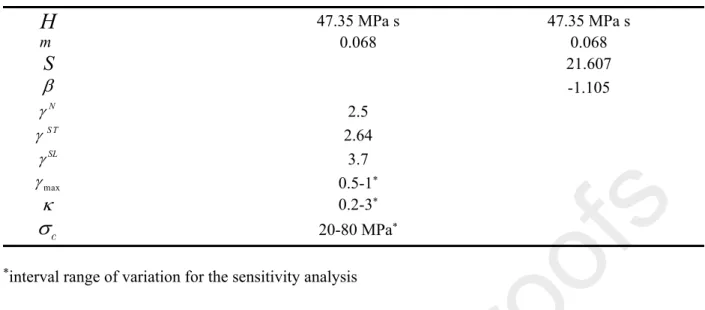
Table 2 Material Properties used in the calculation (Barral et al., 2020; Praud et al., 2020)
Fiber Interphase Matrix
E
72.4 GPa 2731 MPa 2731 MPa𝜐 0.22 0.3 0.3 1 v E 8766 MPa 8766 MPa 1 v 1395 MPa s 1395 MPa s 2 v E 13754 MPa 13754 MPa 2 v 165601 MPa s 165601 MPa s 3 v E 15010 MPa 15010 MPa 3 v 457955 MPa s 457955 MPa s 4 v E 11634 MPa 11634 MPa 4 v 1307516 MPa s 1307516 MPa s 0 R 4.86 MPa 4.86 MPa
K
1304.33 MPa 1304.33 MPaH
47.35 MPa s 47.35 MPa s m 0.068 0.068S
21.607 -1.105 N 2.5 S T 2.64 SL 3.7 max 0.5-1* 0.2-3* c
20-80 MPa**interval range of variation for the sensitivity analysis
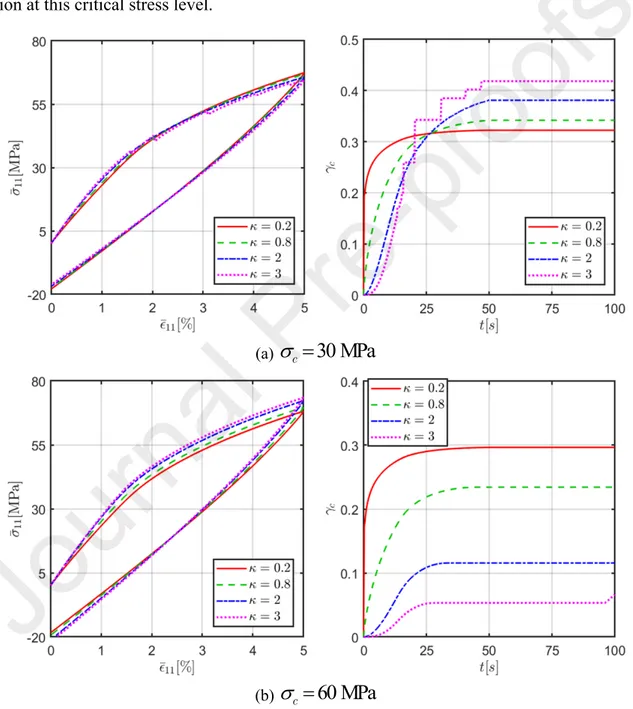
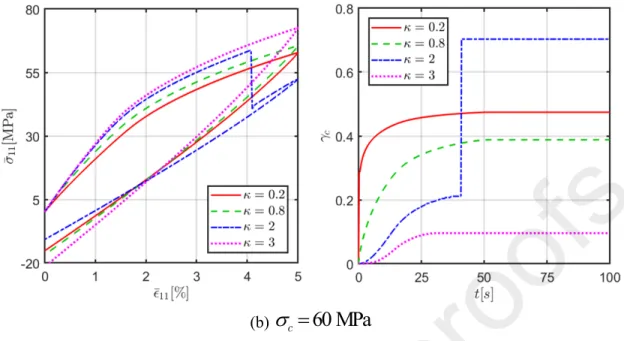
To demonstrate the modelling capabilities of the proposed probabilistic damage micromechanical framework based on Weibull function, the effect of Weibull parameters on the nonlinear stress-strain response of the glass/polyamide composites is first examined and discussed. Figure 5 illustrates the load/unload response of the glass/polyamide composite and evolution of porosity volume fraction as a function of time in the interphase layer, at two different critical stresses
c
30MPa
and
c
60MPa
and for various Weibull exponents 𝜅 = 0.2 0.8 2 and 3, , , . The saturation limit for the interfacial void volume fraction (or microcrack density)
max
0.5
is employed for all cases. The composite is subjected to strain-controlled uniaxial transverse stress loading (𝜎11≠0) with a strain rate of 1 × 10―3/s.As observed, in the case of
c
30 MPa
, the effect of the Weibull exponent on the stress-strain behavior is negligible but is more pronounced on the evolution of interfacial defect volume fraction (or the microcrack density). At low Weibull exponent cases, the interfacial damage reaches rapidly the saturation limit. However, in the case of high Weibull exponent, for instance, , the overall stress-strain response and the evolution of microcrack volume fraction are 𝜅 = 3to the occurrence of abrupt microcracks initiation due to the sudden release of strain energy. In the case of
c
60 MPa
, increasing the Weibull exponent promotes an apparent stiffer overall stress-strain response, as the formation of new voids is partially constress-straint at large critical stress cases. No abrupt jump is observed in the stress-strain response nor the evolution of microcrack volume fraction at this critical stress level.(a)
c
30 MPa
(b)
c
60 MPa
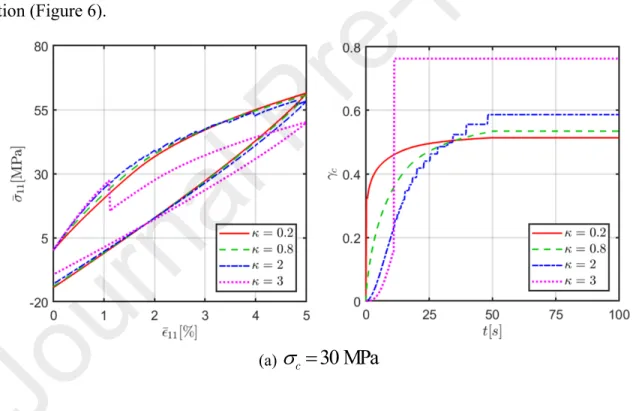
Figure 6 presents the load/unload stress-strain response and the evolution of interfacial defect volume fraction when the void saturation limit is increased to
max
0.8
while other parameters have been kept the same. Hence, the differences between Figures 5 and 6 are due to the differences in the interfacial damage saturation limit. It is clear that increasing the damage saturation limit
max accelerates the formation (initiation) and the density of the interfacial voids. A cursory examination of Figures 5 and 6 reveals that the composite with higher interfacial damage saturation limit is softer as more damage is allowed to develop in the interphase layer and the influence of Weibull parameters on the stress-strain response of the composite is more drastic. More abrupt jumps are also observed in the stress-strain response and evolution of void volume fraction (Figure 6).(b)
c
60 MPa
Figure 6 Effect of Weibull parameters
c and on the homogenized stress-strain response of a composite subjected to transverse tensile loading for void saturation limit of
max
0.8
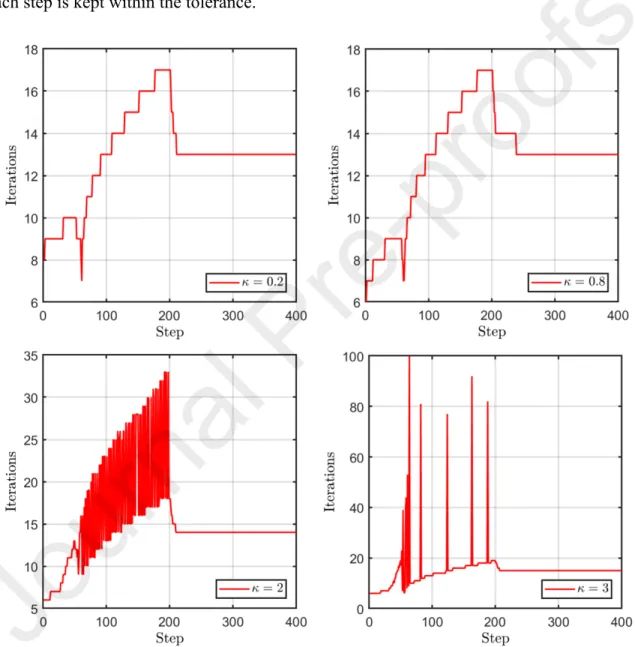
.It should be pointed out that even in the case with the sudden formation of interfacial voids characterized by the abrupt decrease in the stress-strain response, the modified Mori-Tanaka damage framework can complete the analysis and does not encounter any numerical issue, which is not the case in the finite-element analysis. Figure 7 describes the global iteration number as a function of load step for different Weibull exponents in the case of 𝜅
c
30 MPa
and
max
0.5
, to obtain the converged response for σin. In these computations, two criteria are utilized to terminate the iterative process: (a) the difference between two successive iterations should be within a specified tolerance, namely: 1 × 10―6; or (b) the iterations reach the prescribed maximum number 100. It is seen that in the case of 𝜅 = 0.2 and 0.8, the convergence is achieved with as few as 17 maximum iterations. Increasing the Weibull exponent to 𝜅 = 2 requires at most 33 iterations to ensure global convergence. In the case where there is abrupt jump in the stress-strain curve, case of , a significantly larger number of iterations is required compared to the cases wherehas a low value ranging between 0.2 and 0.8. It should be mentioned that at step 65 of the case 𝜅
of 𝜅 = 3, the iterations reach the allowable number 100 for the given tolerance 1 × 10―6. It has been verified that the homogenized stress-strain response and evolution of void volume fractions are not altered when the allowable iteration number is increased to 200 while the error generated at each step is kept within the tolerance.
Figure 7 Comparison of the global iteration number as a function of load step for different in the case of 𝜅 and .
30 MPa
c
5 Numerical Results
In order to assess the correctness of the modified Mori-Tanaka TFA damage framework in simulating progressive damage in heterogeneous materials, the present mean-field predictions are compared with the full-field finite-element homogenization simulations in Abaqus which is a gold standard. Further assessment and experimental validation of the proposed framework will be performed elsewhere in our future studies. To this end, the constitutive law implemented into the Abaqus code for the polymer matrix phase is exactly the same as that employed in the modified Mori-Tanaka TFA approach. The inelastic behavior is characterized by the viscoelastic-viscoplastic with ductile damage model; hence it is not repeated in this section. The reader can refer to the work by Praud et al. (2017a) for the numerical details of the implementation using a UserMATerial subroutine (UMAT). In the interphase layer, a viscoelastic-viscoplastic model with micromechanics-based damage described in the following is developed to characterize the nonlinear behavior and the damage in the interphase layer.
5.1 Micromechanics-based Damage in Interphase: Finite-Element Implementation
For the sake of simplicity, the subscript 2 indicated for the interphase is omitted since this section is totally devoted to the interphase layer. The macroscopic stress accounting for damage is 𝛔 taken into account through the formula:
(28)
1 c
c :
in
σ σ ε ε
where σC0:
ε ε in
is the stress in the net matrix phase, andwhere (29)
T 1 0 1 : : : : in in c m c m m c c in in m c ε B ε B C A ε ε A ε ε (in Eq. 27) is the overall stiffness tensor of the interphase given by Eq. (16). is the
c Am
cconcentration tensor of the net material given by Eq. (17). The void volume fraction is directly given in terms of the homogenized von Mises stress through the Weibull probabilistic function, Eq. (19). The net polymer matrix is modelled as a viscoelastic-viscoplastic medium, represented by four Kevin-Voigt viscoelastic branches and a viscoplastic branch. The inelastic strain εin is obtained iteratively using the radial return mapping technique described in Section 3.2.
The interphase and polymer matrix nonlinear constitutive models are implemented in Abaqus through two user material subroutines. The global finite-element solver requires the tangent moduli t at each integration point which describe the current rate of change of stress with a change in total strain. The tangent moduli for the polymer matrix phase t0 have already been developed by Praud et al. (2017a) using the convex cutting plane and the radial mapping algorithm. For the interphase material, the following form of tangent moduli is obtained using the linearization scheme introduced by Praud et al. (2017a):
(30)
2 1 0: : t c m in C A I where (31)
1 : : : in in m in m I E I A E A The expression for the matrix
E
in that relates the
ε
to εin :(32) :
in in
ε E
εis provided in the paper by Praud et al. (2017a). It should be noted that at the present stage of the research, we focus on the comparison of implementing the interphase constitutive model in two computational approaches. The validity of the proposed interphase constitutive model to reproduce
the experimental response of composites with randomly oriented fibers will be conducted in our future studies.
5.2 Unidirectional Loading
Figure 8 shows the three-phase finite-element unit cell model used for comparison with the modified Mori-Tanaka TFA approach, which is discretized into 11951 C3D10 elements. Periodic boundary conditions were applied on opposite faces of the unit cell, the details of which can be found in the paper by Praud et al. (2020). To avoid duplication, the Weibull parameters are fixed as:
c
30 MPa
, 𝜅 = 0.8, and the interfacial void saturation limit is set as:
max
0.5
. The choice of the aforementioned parameters is motivated by the fact that the actual macroscopic stress-strain response of the glass-reinforced thermoplastic polyamide composite is ductile, with an added advantage that the Abaqus simulation will not run into numerical problems since these parameters are capable of generating smooth stress-strain response with gradual growth of interfacial microcracks as it is commonly expected for this polymer composite and observed in the Mori-Tanaka TFA simulations.Figure 8 Finite-element unit cell discretization of a three-phase composite used for comparison with the modified Mori-Tanaka approach
Comparison of the load/unload stress-strain response is conducted at strain rates 1 × 10―3
and for three different loading modes, namely, transverse tensile, transverse shear,
/s 5 × 10―2/s
and axial shear loading, respectively, as presented in Figure 9.
Under transverse tensile loading by 𝜎11≠ 0, the modified Mori-Tanaka TFA and the
reference solution obtained through full-field numerical homogenization predict approximately the same response at both loading rates during the entire loading range, providing good support and assessment for the proposed modified Mori-Tanaka TFA damage framework. Under transverse shear loading by 𝜎12≠ 0 and axial shear loading by 𝜎13≠ 0, the Mori-Tanaka predictions correlate
with the reference simulations in the early loading stage but exhibit a slight difference at larger applied strains, especially in the higher strain rate case 5 × 10―2/s. For all the loading cases, increasing the loading rate promotes stiffer stress-strain response, indicating the proposed method is able to capture properly the rate effect.
It must be noted that the observed maximum difference of 6.7% and 7.6% noticed respectively for transverse and axial shear loading conditions can be attributed to the fact that the inelastic strain correction tensor , taken directly from Barral et al. (2020), is identified based on Y
a different unit cell configuration, namely, in a hexagonal arrangement. Particularly, as discussed by Khatam et al. (2009), the hexagonal unit cell loses transverse isotropy in the nonlinear region of the stress-strain overall response, hence it is discarded in the present work. While the transversely isotropic relations between the transverse Young’s moduli and transverse shear modulus no longer exist, the square unit cell yields isotropic response under transverse tensile loading in the plane perpendicular to the fiber direction, which is what one expects for the statistical homogeneous medium. As a result, in the identification procedure, the elements Y
1,1 and Y
2, 2 of the correction tensors associated with transverse tension are found equal due to Ythe symmetry of the response in square array. In contrast, the hexagonal unit cell will produce different stress-strain responses
11
11 and
22
22 under transverse tensile loading, which contradicts with the expected outcome. Nonetheless, the overall agreement between the mean-field predictions and full-field simulations is still promising for the possible use of the developed approach to simulate the progressive damage in composite structures given their reduced computational costs.Figure 9 Comparison of homogenized load/unload stress-strain response generated by modified Mori-Tanaka TFA (MT-TFA) approach and full-field homogenization using finite-element analysis under uniaxial transverse tensile 𝜎11
, transverse shear , and axial shear loading at two strain rates, respectively. It is noted that the
≠ 0 𝜎12≠ 0 𝜎13≠ 0
strain rates under the shear loading refer to the engineering strain rates.
Figure 10 illustrates the evolution of interphase microcrack density and matrix ductile
c damage as a function of applied strains during the loading stage, under three different loading dmodes. It is observed that for the interphase discrete damage, increasing the loading rate promotes a significant increase in microcrack density at the same load level. At the beginning of deformation, the accumulation of interphase microcracks is rather rapid, indicating the interphase failure is catastrophic. The rate of microcrack or void accumulation decreases gradually with the increase of applied strain. At higher applied strains, the interphase microcrack density ceases to grow and tends to a constant value because the continuum formation of microcracks is suppressed due to the local fracture in the affected region. In contrast, in the event of matrix ductile damage, the effect of loading rate on damage accumulation is less dramatic. Increasing strain rate produces a slight decrease in ductile damage accumulation. Additionally, the ductile damage increases with applied strain in a quasi-linear fashion after the onset of the matrix ductile damage. Figure 10 also demonstrates that the damage evolution in considered composites material system is induced by
interfacial debonding in the vicinity of the reinforcements and followed by propagating through the matrix.
Figure 10 Evolution of interphase microcrack density and matrix ductile damage generated by the MT-TFA
c d approach as a function of applied strains during the loading stage.5.2 Nonproportional Multiaxial Loading
The reliability of the modified Mori-Tanaka TFA damage framework is further demonstrated by comparison with the finite-element simulations carried out for nonproportional multiaxial loading paths. The complex loading path is first conducted under the in-plane tensile-tensile loading: at stage 1, 𝑡 = 0 ― 𝑡0, a strain-controlled uniaxial transverse tension by 𝜎11≠ 0 is applied, where
increases linearly up to a maximum strain of . At stage 2, , while the
𝜀11 𝜀11= 5% 𝑡 = 𝑡0― 2𝑡0 𝜀11
is kept constant 𝜀11= 5%, the composite is under the strain-controlled biaxial loading by both 𝜎11
and until . At stage 3, , both and are
≠ 0 𝜎22≠ 0 𝜀22= 2.5% 𝑡 = 2𝑡0― 3𝑡0 𝜀11= 5% 𝜀22= 2.5%
held constant. Stage 4, 𝑡 = 3𝑡0― 4𝑡0, is the stress-controlled unloading, where both 𝜎11 and 𝜎22
decrease linearly to 0 MPa.
The combined inplane tensile-tensile loading is performed at two different loading speeds that correspond to 𝑡0= 50s and 𝑡0= 4s. Figures 11 (a) and 12 (a) illustrate the comparison of
macroscopic normal strains 𝜀11, 𝜀22, and 𝜀33 as a function of time generated by the modified
two computational approaches are remarkable. Figures 11 (b) and 12 (b) describe the corresponding homogenized stress responses 𝜎11 and 𝜎22 as a function of time. The difference
between the modified Tanaka and the reference solution is negligible. The modified Mori-Tanaka TFA approach captures sufficiently well the long-term stress relaxation which is characterized by the continuous decrease of 𝜎11 and 𝜎22 at stage 3 when both 𝜀11 and 𝜀22 are held
constant.
(a) strain VS time (b) stress VS time
Figure 11 Comparison of homogenized strain and stress response as a function of time generated by Mori-Tanaka and Abaqus under combined nonproportional in-plane tensile-tensile loading. At the first stage 𝑡 = 0 ― 50s, the composite is under the strain-controlled transverse tensile loading by 𝜎11≠ 0 up to a maximum strain of 𝜀11= 5%. At the second stage 𝑡 = 50 ― 100s, while the 𝜀11 is kept constant, the composite is under the strain-controlled biaxial loading by 𝜎11
and up to a maximum strain of . The fourth stage is stress-controlled ≠ 0 𝜎22≠ 0 𝜀22= 2.5% 𝑡 = 150 ― 200s
(a) strain VS time (b) stress VS time
Figure 12 Comparison of homogenized strain and stress response generated by Mori-Tanaka and Abaqus under combined nonproportional in-plane tensile-tensile loading. At the first stage 𝑡 = 0 ― 1s, the composite is under the strain-controlled transverse tensile loading by 𝜎11≠ 0 up to a maximum strain of 𝜀11≠ 5%. At the second stage , while the is kept constant, the composite is under the strain-controlled biaxial loading by and
𝑡 = 1 ― 2s 𝜀11 𝜎11≠ 0
up to a maximum strain of . The fourth stage is stress-controlled unloading. 𝜎22≠ 0 𝜀22= 2.5% 𝑡 = 3 ― 4s
The assessment of the modelling capability of the modified Mori-Tanaka TFA approach under combined nonproportional transverse tensile-transverse/axial shear loading conditions is further tested. Figure 13 shows the strain-controlled loading path applied to the same composite material system as the previous one. At stage 1, 𝑡 = 0 ― 𝑡0, the composite is subjected to uniaxial
transverse tensile loading by 𝜎11≠ 0. During this stage, the 𝜀11 increases to 5% at a constant speed
whereas 𝜀12 (or 𝜀13) has been kept zero. At stage 2, 𝑡 = 𝑡0― 2𝑡0, the transverse shear strain 𝜀12
(or axial shear strain 𝜀13) is applied until 𝜀12= 2.5% (or 𝜀13= 2.5%) while the 𝜀11 remains at 𝜀11
5%. Stage 3, , is the stress relaxation stage due to the viscoelastic effect, where
= 𝑡 = 2𝑡0― 3𝑡0
and (or ) are held constant. At stage 4, , the composite is under the
strain-𝜀11 𝜀12 𝜀13 𝑡 = 3𝑡0― 4𝑡0
Figure 13 Illustration of strain-controlled combined nonproportional transverse tensile-transverse/axial shear loading/unloading.
Figures 14 (a) and 15 (a) show the comparison of transverse tensile stress 𝜎11 and
transverse shear stress 𝜎12 as a function of time generated by the modified Mori-Tanaka TFA
approach and the Abaqus at strain rates 𝜀11= 1 × 10―3/s and 𝜀12= 2.5 × 10―4/s, respectively.
The comparison of the corresponding normal strains 𝜀22 and 𝜀33 due to Poisson’s effect is
presented in Figures 14 (b) and 15 (b). The modified Mori-Tanaka approach gives satisfactory results for both strain rates.
(a) stress VS time (b) strain VS time
Figure 14 Comparison of homogenized stress and Poisson's (strain) response generated by Mori-Tanaka and Abaqus under combined nonproportional transverse tensile 𝜎11≠ 0 -transverse shear 𝜎12≠ 0 loading at the strain rates 𝜀11
and .
= 1 × 10―3/s 𝜀
12= 2.5 × 10―4/s
(a) stress VS time (b) strain VS time
Figure 15 Comparison of homogenized stress and Poisson's (strain) response generated by Mori-Tanaka and Abaqus under combined nonproportional transverse tensile 𝜎11≠ 0 - transverse shear 𝜎12≠ 0 loading at the strain rates 𝜀11
and .
Figures 16 (a) and 17 (a) show the comparison of transverse tensile stress 𝜎11 and axial
shear stress 𝜎13 as a function of time generated by the modified Mori-Tanaka TFA approach and
the FEA homogenization (reference solution) at strain rates 𝜀11= 1 × 10―3/s and 𝜀13= 2.5 ×
, respectively. The comparison of the corresponding normal strains and due to
10―4/s 𝜀22 𝜀33
Poisson’s effect is presented in Figures 16 (b) and 17 (b). Once again, the difference between the two computational approaches is very small, indicating that the modified Mori-Takana approach is robust and capable of mimicking progressive damage evolution in composites generated via the full-field FE analysis approach under complex loading conditions.
(a) stress VS time (b) strain VS time
Figure 16 Comparison of homogenized stress and Poisson's (strain) response generated by Mori-Tanaka and Abaqus under combined nonproportional transverse tensile 𝜎11≠ 0 - axial shear 𝜎13≠ 0 loading at the strain rates 𝜀11
and .
= 1 × 10―3/s 𝜀
(a) stress VS time (b) strain VS time
Figure 17 Comparison of homogenized stress and Poisson's (strain) response generated by Mori-Tanaka and Abaqus under combined nonproportional transverse tensile 𝜎11≠ 0 - transverse shear 𝜎13≠ 0 loading at the strain rates 𝜀11
and .
= 5 × 10―2/s 𝜀13= 2.5 × 10―2/s
6. Discussion and Future Work
This paper, for the first time, presents a mean-field homogenization method, based on the modified Mori-Tanaka method and TFA technique, for simulating hybrid damage mechanisms in polymeric composites. In general, the modified Mori-Tanaka TFA approach provides satisfactory results when compared with the full-field approach predictions under various loading paths. Relative to the numerical techniques such as finite-element analysis, the main strengths of this model are three-fold. First, the modified Mori-Tanaka TFA approach avoids the computationally demanding mesh discretization required by the finite-element unit cell analysis. The construction of the input data file is extremely simple and fast. Second, the convergence of the proposed method, formulated based on the secant stiffness matrix approach, is rather rapid even with very demanding Weibull parameters, without experiencing the convergence and numerical issues common to the finite-element homogenization technique. Third, the execution time of the present method is negligible
when compared with the finite-element approach. To run a nonproportional loading case such as Figure 17, the Mori-Tanaka TFA approach implemented in an uncompiled MATLAB environment consumes about 115 seconds while the Abaqus consumes about 200 minutes, producing a substantial reduction of execution time by 90%. Therefore, the present method may be easily employed in the parametric studies aimed at understanding property-structure relationships.
To make the full use of the potential offered by the proposed mean-field damage framework, the current work will be extended in three different directions. First of all, further assessment and experimental validation of the proposed framework are needed to justify the choice of the proposed constitutive laws. Particularly, the present damage framework employs the von Mises type failure stress in the Weibull probabilistic function, indicating the interphase failure will not occur under the hydrostatic stress state. More advanced failure criteria may be explored such as using J2 -I1
based criterion (Ghorbel, 2008) that takes into account the effect of hydrostatic pressure commonly admitted for the polymer matrix. Secondly, to increase the applicability to a wider class of materials and structures, the extension of the current Mori-Tanaka model for simulating composites with random or oriented reinforcements is an important task for future development. Simulating three-dimensional microstructures is a challenging issue in finite-element analysis as it requires a great deal of computing power and can be incredibly slow. Thirdly, identification of the physically realistic parameters associated with the Weibull law for debonding initiation and evolution based on experimental data is vital for the accurate characterization of the macroscopic composite response. To address this need, the MT-TFA damage framework can be implemented into an optimization algorithm, such as particle swarm optimization (Chen and Wang, 2019).
7. Summary and Conclusion
The challenge in simulating progressive damage in polymer matrix composites is that both ductile and discrete types of damage may appear at different regions in the matrix, as observed in the experiment (Arif et al., 2014). To address the above issues, the modified Mori-Tanaka TFA approach has been proposed by incorporating an additional interphase layer to accommodate different damage mechanisms in the vicinity of the fibers and in the matrix. Specifically, the damage mechanism in the interphase layer is represented by growing voids modelled using the Weibull probabilistic density function while at the matrix region, the ductile damage is characterized by progressive stiffness degradation modelled using continuum damage theory. Moreover, the rate-dependent resin response is modelled as viscoelastic-viscoplastic, represented by four Kelvin-Voigt branches and a viscoplastic branch under the thermodynamics framework.
Parametric studies were conducted extensively and aimed at demonstrating the effect of Weibull parameters on the homogenized stress-strain response and interfacial crack initiation and accumulation in unidirectional thermoplastic matrix composites. Physically realistic Weibull parameters are obtained that yield smooth stress-strain curve as expected for a thermoplastic matrix composite. Furthermore, these parameters ensure convergent response for comparison with the finite-element results with the fewest iterations. In addition, the modified Mori-Tanaka TFA damage framework is validated vis-à-vis finite-element simulations based on Abaqus which provides a gold standard (reference solution). Good agreement between the two approaches is observed for various loading paths, providing good support for the proposed damage framework.
References
Arif, M.F., Meraghni, F., Chemisky, Y., Despringre, N., Robert, G., 2014. In situ damage mechanisms investigation of PA66/GF30 composite: Effect of relative humidity. Composites Part B: Engineering 58, 487-495.