HAL Id: hal-01807481
https://hal.archives-ouvertes.fr/hal-01807481
Submitted on 4 Jun 2018
HAL is a multi-disciplinary open access
archive for the deposit and dissemination of
sci-entific research documents, whether they are
pub-lished or not. The documents may come from
teaching and research institutions in France or
abroad, or from public or private research centers.
L’archive ouverte pluridisciplinaire HAL, est
destinée au dépôt et à la diffusion de documents
scientifiques de niveau recherche, publiés ou non,
émanant des établissements d’enseignement et de
recherche français ou étrangers, des laboratoires
publics ou privés.
Visualization of audio data using stacked graphs
Mathieu Lagrange, Mathias Rossignol, Grégoire Lafay
To cite this version:
Mathieu Lagrange, Mathias Rossignol, Grégoire Lafay. Visualization of audio data using stacked
graphs. 19th International Society for Music Information Retrieval Conference, Sep 2018, Paris,
France. �hal-01807481�
VISUALIZATION OF AUDIO DATA USING STACKED GRAPHS
Mathieu Lagrange
∗, Mathias Rossignol, Gr´egoire Lafay
∗∗
LS2N, CNRS, ´
Ecole Centrale de Nantes
[email protected]
ABSTRACT
In this paper, we study the benefit of considering stacked graphs to display audio data. Thanks to a care-ful use of layering of the spectral information, the result-ing display is both concise and intuitive. Compared to the spectrogram display, it allows the reader to focus more on the temporal aspect of the time/frequency decomposition while keeping an abstract view of the spectral information. The use of such a display is validated using two per-ceptual experiments that demonstrate the potential of the approach. The first considers the proposed display to per-form an identification task of the musical instrument and the second considers the proposed display to evaluate the technical level of a musical performer. Both experiments show the potential of the display and potential applications scenarios in musical training are discussed.
1. INTRODUCTION
The visual display of quantitative information [13] is at the core of the growth of human knowledge as it allows human beings to go beyond the limitation of natural languages in terms of precision and scale.
Defining what is the essence of a good visual display of quantitative data is non trivial and usually domain specific. That said, in most scientific fields, such displays serve two majors goals: 1) the routine interaction of the researcher with the data or the physical phenomenon and 2) the need of the researcher to motivate its claim to its peers. Both tasks require the display to fulfill the simplicity rule both in terms of production and design. First, the display shall be computed and adapted according to the need of the re-searcher very efficiently in order to allow an effective ex-ploration of the data. Second, the display shall be able to convey at the first glance an important qualitative aspect about the data.
This paper is about the visualization of audio data, and audio data is originally made to be listened to. There-fore, we shall keep in mind that ”all visual projections of sounds are arbitrary and fictitious” [11]. That said, even if recorded versions of sounds can now be played back
c
Mathieu Lagrange∗, Mathias Rossignol, Gr´egoire
Lafay∗. Licensed under a Creative Commons Attribution 4.0 Interna-tional License (CC BY 4.0). Attribution: Mathieu Lagrange∗, Mathias Rossignol, Gr´egoire Lafay∗. “Visualization of audio data using stacked graphs”, 19th International Society for Music Information Retrieval Con-ference, Paris, France, 2018.
at convenience, it is still useful to represent them graph-ically as listening depends on time. On contrary, the vi-sual display allows the reader to grasp a global view of the waveform at a glance. Also, the eye is less subject to stimulation fatigue and the visual display is very powerful to convey evidence as we are still fully into the print cul-ture that since the Gutenberg invention gives an ”uncritical acceptance [to] visual metaphors and models” [8].
We propose in this paper a display of audio data that is intuitive and gives information about the main dimensions of sound in a compact manner using stacked graphs [3]. The display can be computed easily and efficiently1. In
order to put this display into context, an overview of the routinely used type of displays is given, respectively from the perspective of the musician composer in Section 2 and the physicist in Section 3. We shall argue that the proposed display fully described in Section 4 can be thought of as the physicist’s counterpart to a notational system introduced by Schafer [11].
The display is then evaluated and compared to the com-monly used waveform and spectrogram displays with two perceptual experiments. In the first experiment, the sub-jects have to distinguish between tones of different musi-cal instruments by listening to the sounds or by consider-ing the visual displays under evaluation. The protocol and the results for this experiment are presented in Section 5. In the second experiment, the subjects are asked to distin-guish between saxophone performances of different level of instrumental expertise by listening to the sound and by considering the displays under evaluation. The protocol and the results for this experiment are presented in Sec-tion 6.
2. ABOUT NOTATION
From the phonetic alphabet for speech to the musical score for music, notation consists in putting together on a one or two-dimensional space symbols describing specific sound events. In a manner probably inherited from writing, time sequencing is usually depicted from left to right in the Western musical culture. Specific to the musical score is the use of the vertical axis to depict the pitch. A musi-cal tone is therefore solely described in terms of time of appearance, duration, pitch and sometimes intensity. As such, the score is largely prescriptive and gives a tremen-dous amount of freedom to the musical performer in terms
1A reference implementation as well as all the data discussed in
this paper is available at https://bitbucket.org/mlagrange/ paperaudiostackgraph
Attack Body Decay Duration moderate non-existent slow Frequency steady low
Fluctuations transient steady-state Dynamics loud to soft
Duration ←− 3 seconds −→
Figure 1: Annotation of a church bell from Schafer [11].
of interpretation.
In an intent to provide a more descriptive notation of musical objects, Schaeffer [10] designed a ”solf`ege des object musicaux” that extensively apprehend the descrip-tion of any kind of sound object. Perhaps because of its complexity this notation is hardly used today. In an ef-fort to simplify this notation, Schafer proposed a notational system that can be considered for describing any kind of sound, be it a unique event or any kind of compound. The main rationale is to split the temporal axis from left to right into 3 parts corresponding to the attack, sustain and decay. For each part, its duration, frequency (related to the notion of mass as introduced by Schaeffer), fluctuations (related to the notion of grain as introduced by Schaeffer) and dy-namics are displayed from top to bottom. Except for the frequency content that is depicted as a rough spectrogram contour, the other dimensions are described according to a specific alphabet of a few symbols. An example taken from [11] of such annotation is given on Figure 1 for the sound of a church bell.
3. ABOUT MEASURE
When dealing with sound as a physicist, one wants to quan-tify mechanical properties and display them precisely. As in notation, the main aspect that is commonly looked for is the distribution of energy across frequency and time. The distribution of energy as a function of the modulation rate and the frequency scale of observations are less considered in the signal processing literature [2, 4] but are shown to be perceptually important [5, 14].
Therefore, in order to display a sound on a two-dimensional plane, one has to resort to a choice or a com-promise. Either timing is emphasized and frequency ne-glected as in the waveform display 2a or frequency is emphasized and timing neglected as in the display of the Fourier spectrum 2b. A compromise is made by consider-ing time and frequency respectively as horizontal and ver-tical axes of the two-dimensional plane as with the popu-lar spectrogram magnitude of the short term Fourier trans-form, see Figure 2c. In such display, the use of a color code conveys information about energy.
That said, we believe that the spectrogram display still favors frequency over time. Spectral structure can be ana-lyzed precisely, for example harmonicity, modulations, etc. Conversely, temporal dynamics and structure are harder to appreciate, as the way energy fluctuates in each sub bands has to be reconstructed from the color code.
The spectrogram is a display that is thus in our opinion very powerful for close inspection of a sound event that is
(a) Waveform
(b) Spectrum
(c) Spectrogram
Figure 2: Standard displays of the sound of a church bell.
active over a short period of time. Indeed, enlarging the time resolution quickly blurs the frequency resolution and may lead to a completely non informative display.
4. VISUALIZING SPECTRAL CONTENT USING STACKED GRAPH
With those limitations in mind, we propose in this paper to take a compromise that conversely favors time over fre-quency. In such display, the plane is therefore organized with time and energy as the horizontal and vertical axes respectively. The frequency is displayed as stacked layers displaying the level of energy across frequency sub bands of growing frequency range. Those layers can have colors assigned.
per-Mel scaled magnitude spectrogram
Stacking
Audio spack
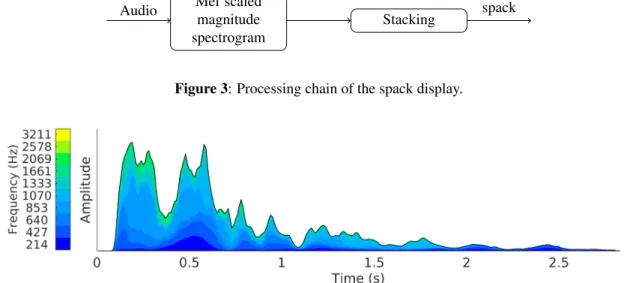
Figure 3: Processing chain of the spack display.
Figure 4: Spectral stack display (spack) of the sound of a church bell. The color code conveys nicely the modulation within each frequency band and the overall disappearance of the high frequency range.
ceptually meaningful. Therefore, we consider spectral data projected on a Mel-scale [12].
In order to improve legibility, colors are assigned to frequency layers according to their ranges with a color code ranging from blue (low frequency) to yellow (high frequency). The blue color is often associated with large phenomena, with the following adjectives: celestial, calm, deep, whereas the yellow color is often associated with transient phenomena that are highly energetic. Kandinsky in [7] states that ”Blue is comparable to low pitched organ sounds. Yellow becomes high pitched and can not be very deep”. The color code is then chosen to be a linear gradi-ent from blue (low frequency range) through green (middle frequency range) to yellow (high frequency range). In this paper, the gradient follows the LCH color model specified by the Commission Internationale de l’ ´Eclairage (CIE) so that the perceived brightness appears to change uniformly across the gradient while maintaining the color saturation. We argue that this display, termed spectral stack (spack), convey useful information about the sound. In particular, it conveys nicely, aside of fine details, the im-portant dimensions retained by Schafer, see Figure 1.
To compute the spack display, a mel-scaled magnitude spectrogram is computed from the audio, see Figure 3. To each mel spectral band is assigned a given color code from dark blue (low frequency) to yellow (high frequency). At each time frame, the spack display is a stacking of the mag-nitude values of each mel frequency band, see Figure 4.
5. TASK 1: IDENTIFYING THE MUSICAL INSTRUMENT
The identification of the musical instrument used to play a tone rely largely on 2 factors, the spectral envelope and the attack [1, 6]. The spack display shall be able to conve-niently display those factors. Indeed, the spectral envelope, i.e. the distribution of the energy across frequency is en-coded using the stacking axis and color code. The attack is
Figure 5: Classification performance of the different dis-plays on Task 1 (identifying the musical instrument): sound (S) waveform (W), spectrogram (Spe) and spack (Spa). The star shows the average performance and the length of the vertical line is twice the standard deviation.
also well displayed as the spack focuses on the display of energy through time.
5.1 Protocol
Several tones played by four musical instruments: piano, violin, trumpet, and flute are considered as stimuli. Each instrument is played mezzo forte at 5 different pitches: C, D, E, F and G. For each sound, three visual representa-tions are evaluated: waveform (W), spectrogram (Spe) and spack (Spa). For reference, the sound (S) is also consid-ered2.
The test is a forced-choice categorization task. The sounds are displayed by gray dots on a 2 dimensional plane displayed on a computer screen. The dots can be moved
2The sounds and the visual displays are available on the companion
freely within this plane and colored using 4 different col-ors, each corresponding to a given instrument. The corre-spondence is given to the subjects at the beginning of the experiment by the instructor: piano (black), violin (red), trumpet (magenta), and flute (green). If the sound modal-ity is tested, the sound is played when the dot is clicked. If a visual modality is tested, the corresponding display is shown when the dot is clicked using the mouse.
Eight subjects, studying at the Engineering school ”Ecole Centrale de Nantes”, aged from 24 to 26 years, performed the test. Each subject reported normal hearing. They performed the test at the same time in a quiet en-vironment using headphones. The sound level was set to a comfortable level before the experiment. A short intro-duction was given by the instructor for each display with a focus on the meaning of the axes and the color code. The subjects performed the evaluation using the sound modal-ity first. The order of the three remaining modalities are ordered randomly among subjects to reduce the impact of precedence. The test is over when the subjects have as-signed a color to each dot, this for all the evaluated modal-ities.
5.2 Results
Classification performance is evaluated as the number of couple of sounds played by the same instrument that have been assigned the same color divided by the number of couples. As can be seen on Figure 5, the task is trivial when listening to the sound, as the subjects achieve per-fect classification. On overall, the classification is quite good for each of the graphical displays with a higher av-erage performance for the spack display. Subjects verbally reported ease of use for the spack display.
6. TASK 2: ASSESSING THE LEVEL OF A SAXOPHONE PERFORMANCE
The control of the breath while playing the saxophone is crucial and can be monitored to assess the technical level of a saxophone player [9]. For example, playing a single tone with sharp attack and constant amplitude during the steady state is non trivial and requires years of practice.
Professional players typically practice such exercises on a daily basis as warm-ups and perform them with a trainer to get criticisms in order to improve their skills. Using graphical displays of their performance could be useful for them to spot during or after the performance. In order to be efficient, such display shall be intuitive with a few degrees of freedom in order to be easy to understand.
The validation of the spack display for such pedagog-ical needs is out of the scope of this paper. Nonetheless, we designed here a task that can demonstrate how several meaningful characteristics of the saxophone performance can be identified only by considering the graphical displays under evaluation.
In this kind of training, it could be useful for the trainer to have some kind of display of its performance. As the crucial part is to be able to control the air flow while play-ing in order to keep a stable amplitude and timbre, we
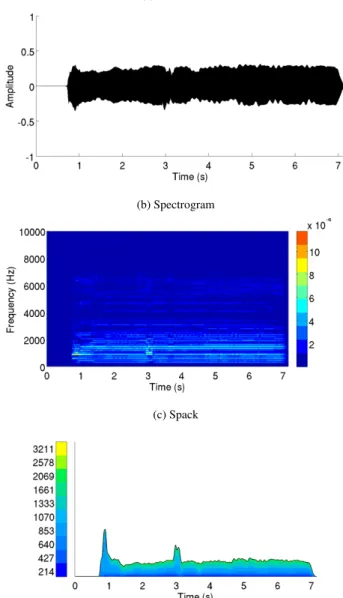
hy-(a) Waveform
(b) Spectrogram
(c) Spack
Figure 6: Graphical displays of forte B tone. Several per-formance issues can be observed: lack of airflow control at the attack, change of pitch and loudness at 3 seconds and lack of steady airflow during the whole performance.
pothesize that the spack display may be a good candidate for such a task.
6.1 Protocol
The stimuli considered in this experiment are recorded per-formances of four saxophone players with a technical level assumed to be high or low (2 low, 2 high). Each player played several tones at pitch B and G. They were asked to play each note in three different ways: piano, forte and crescendo decrescendo3.
The test follows a XXY structure, where three perfor-mances are shown to the subject, one is at a given level (high or low) and the other two of the other level (low or high). The subject is then asked, based solely on the modality at hand, to select the one that is different from the two others. 24 triplets are randomly selected from the
3The sounds and the visual displays are available on the companion
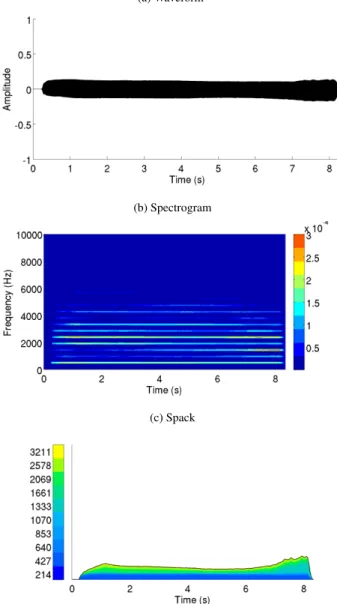
(a) Waveform
(b) Spectrogram
(c) Spack
Figure 7: Graphical displays of another forte B tone. Sev-eral performance issues can be observed, for example: lack of sharpness at the attack, change of timbre and loudness at 5 seconds.
valid combinations of the above described stimuli. 16 subjects, studying at the Engineering school ”Ecole Centrale de Nantes”, aged from 24 to 28 years, performed the test in two sessions, 9 for the first session, and 7 for the second session. Each subject reported normal hear-ing. For each session, they performed the test at the same time in a quiet environment using headphones. The sound level was set to a comfortable level before the experiment. A short introduction was given by the instructor for each display with a focus on the meaning of the axis and the color code. The subjects performed the evaluation using the sound modality first. The order of the three remain-ing modalities are ordered randomly among subjects to re-duce the impact of precedence. The test is over when the subjects have examined the 24 triplets for the 4 evaluated modalities.
Figure 8: Boxplot display of the differentiation perfor-mance of the different displays on Task 2 (detecting the level of the saxophone player): sound (S), waveform (W), spectrogram (Spe) and spack (Spa).
Table 1: Results of the repeated measure ANOVA evalu-ating the effect of the type of display on the performance.
sum sq. df mean sq. F p-value Type 0.13 3 0.045 5.3 0.003 Error 0.38 45 0.008
6.2 Results
For each modality, the number of correct selection is aver-aged among the 24 triplets and then averaver-aged among sub-jects. As can be seen on Figure 8, the task is more complex than task 1, as the score achieved using the sound modality is lower than task 1. This might be due to the fact that the task is less explicit than task 1. For the visual displays, the same ranking as task 1 is observed with a larger difference between each modality.
A repeated measure ANOVA is used to test the poten-tial significance of the type of display on the differentia-tion performance. A mauchly test reveals that the default of sphericity is not significant, thus no correction of the degrees of freedom of the Fisher test is needed. Table 1 presents the results of the Fisher test showing that the ef-fect of the representation is significant p = 0.003. In addition, a multiple comparison test shows that the only significant differences are between Waveform and Spack p = 0.03 and Waveform and Sound p = 0.003. No signifi-cant difference is found between the remaining modalities: the Sound, the Spectrogram and the Spack displays.
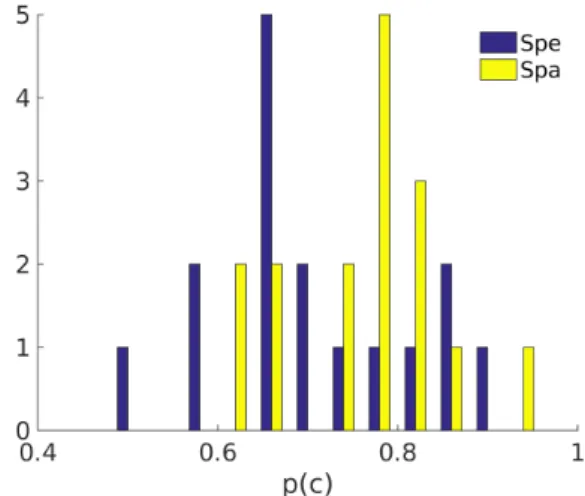
Thus, if considering the graphical displays solely, only the Spack displays significantly improves upon the Wave-form display. As can be seen on Figure 8, The spectro-gram display have the largest dispersion of correct answer rate, i.e. the ratio of correct responses over the number of possible responses, termed p(c) in the following. Consid-ering the distribution of p(c) for the spectrogram display shown on Figure 9, two modes can be observed contrary to the one of the spack display. Even though each
sub-jects have been given the same introduction to each of the graphical displays, their familiarity with the standard dis-plays may vary since some subjects had previous training in signal processing courses. This may explain the higher mode in the distribution of the spectrogram display. Even if this observation shall be considered with care due to the rather low number of subjects, this can lead us to conjec-ture about the influence of the familiarity of the subjects with the spectrogram display on the reported performance. The spack display does not exhibit the same distribution profile and prior familiarity cannot be assumed as the dis-play was equally new to all subjects.
Figure 9: Histogram of the classification performance for the spectrogram (Spe) and the spack (Spa) displays. Only the spectrogram display exhibit two modes, suggesting dif-ferent levels of expertise of the subjects.
7. CONCLUSIONS
In this paper, we proposed a display based on the stacking of the envelopes of logarithmically spaced band pass fil-ters. We have shown qualitatively that this kind of display may have some potential as it conveys nicely the distri-bution of the energy across time and frequency in a way that is an alternative to the one taken when considering the spectrogram.
When considering two evaluation tasks: 1) identifying the type of instrument played, and 2) identifying at which skill level a saxophone tone is played, the spack display compares favorably to more conventional displays, such as the waveform and spectrogram displays. Subjects reported ease of understanding and quick access to important as-pects of the sounds.
Future work will focus on the design of validation tasks for the spack display using a wider range of audio data, namely speech and environmental data.
As the spack display is both compact and intuitive, it can be considered as an inspection tool while practicing a musical instrument in order to monitor the control of the nuance and the timbre while playing. Evaluation of the spack display in such a training use case would thus be of interest.
8. ACKNOWLEDGMENTS
The authors would like to acknowledge support for this project from ANR project Houle (grant ANR-11-JS03-005-01) and ANR project Cense (grant ANR-16-CE22-0012).
9. REFERENCES
[1] Trevor R Agus, Clara Suied, Simon J Thorpe, and Daniel Pressnitzer. Fast recognition of musical sounds based on timbre. The Journal of the Acoustical Society of America, 131(5):4124–4133, 2012.
[2] Joachim Anden and Stephane Mallat. Multiscale Scat-tering for Audio Classification. In ISMIR, 2011. [3] L Byron and M Wattenberg. Stacked Graphs-Geometry
& Aesthetics. IEEE Trans. Vis. Comput. Graph., 2008. [4] Taishih Chi, Powen Ru, and Shihab Shamma. Multires-olution spectrotemporal analysis of complex sounds. The Journal of the Acoustical Society of America, 118(2):887, 2005.
[5] Torsten Dau, Birger Kollmeier, and Armin Kohlrausch. Modeling auditory processing of amplitude modula-tion. i. detection and masking with narrow-band carri-ers. The Journal of the Acoustical Society of America, 102(5):2892–2905, 1997.
[6] John M Grey. Multidimensional perceptual scaling of musical timbres. the Journal of the Acoustical Society of America, 61(5):1270–1277, 1977.
[7] W. Kandinsky. Concerning the spiritual in art. Dover publications, 1954.
[8] M McLuhan. The Gutenberg Galaxy. University of Toronto Press, 1963.
[9] Matthias Robine and Mathieu Lagrange. Evaluation of the technical leval of saxophone performers by consid-ering the evolution of spectral parameters of the sound. In ISMIR, pages 79–84, 2006.
[10] P Schaeffer. Trait´e des objets musicaux. ´Editions Du Seuil, 1966.
[11] RM Schafer. The soundscape: Our sonic environment and the tuning of the world. Destiny books, Rochester, Vermont, 1977.
[12] SS Stevens, J. Volkmann, and E. B. Newman. A scale for the measurement of the psychological magnitude pitch. The Journal of the Acoustical Society of Amer-ica, 185(8), 1937.
[13] E.R. Tufte. The Visual Display of Quantitative Infor-mation, volume 7. Graphics press Cheshire, CT, 1983. [14] Xiaowei Yang, Kuansan Wang, and Shihab A Shamma. Auditory representations of acoustic signals. IEEE transactions on information theory, 38(2):824–839, 1992.
![Figure 1: Annotation of a church bell from Schafer [11].](https://thumb-eu.123doks.com/thumbv2/123doknet/12209837.316689/3.892.465.816.71.784/figure-annotation-church-bell-schafer.webp)