HAL Id: hal-01816574
https://hal.archives-ouvertes.fr/hal-01816574
Submitted on 15 Jun 2018
HAL is a multi-disciplinary open access
archive for the deposit and dissemination of
sci-entific research documents, whether they are
pub-lished or not. The documents may come from
teaching and research institutions in France or
abroad, or from public or private research centers.
L’archive ouverte pluridisciplinaire HAL, est
destinée au dépôt et à la diffusion de documents
scientifiques de niveau recherche, publiés ou non,
émanant des établissements d’enseignement et de
recherche français ou étrangers, des laboratoires
publics ou privés.
Energy/Reliability Trade-off of LoRa Communications
over Fading Channels
Xuan-Chien Le, Baptiste Vrigneau, Matthieu Gautier, Malo Mabon, Olivier
Berder
To cite this version:
Xuan-Chien Le, Baptiste Vrigneau, Matthieu Gautier, Malo Mabon, Olivier Berder.
En-ergy/Reliability Trade-off of LoRa Communications over Fading Channels. International Conference
on Telecommunication, Jun 2018, Saint-Malo, France. �hal-01816574�
Energy/Reliability Trade-off of LoRa
Communications over Fading Channels
Xuan-Chien Le, Baptiste Vrigneau, Matthieu Gautier, Malo Mabon, Olivier Berder
Univ Rennes, CNRS, IRISA 6 rue de Kerampont, 22300 Lannion, France
{xuan-chien.le, baptiste.vrigneau, matthieu.gautier, malo.mabon, olivier.berder}@irisa.fr
Abstract—LoRa is a technology for long range wireless com-munications that allows the development of new applications in domains such as smart agriculture, smart city or smart industry. Many in-field deployments and measurement campaigns have been performed in recent years, showing the sensibility of such communication to fading channels. In this paper, the LoRa transmission reliability is evaluated in simulations for different fading channels. Moreover, as the energy consumption also depends on the configurations, a trade-off between energy consumption and reliability needs to be considered when selecting a LoRa configuration. To this aim, experimental energy measure-ments are performed on a Semtech device, showing that energy difference between various configurations can reach up to two orders of magnitude. Results highlight that LoRa configuration impacts the energy/reliability trade-off and the best one strongly depends of the type of channel.
I. INTRODUCTION
In recent years, Low-Power Wide-Area Networks (LP-WANs) have been widely studied and deployed in many areas, particularly in smart agriculture applications, enabling large range of Internet of Things. The main advantage of LPWANs is that energy consumption is kept low for long communication ranges. This characteristic allows an end-device, powered by a battery or energy harvesting sources, to enhance its lifetime. Among various LPWAN technologies (SigFox, Adaptrum or Weightles . . . ), LoRa [1] physical layer has the particularity to be highly configurable regarding the spreading factor (SF ), bandwidth (BW ), coding rate (CR) and transmission power (PT x), which are critical parameters permitting a trade-off
between energy consumption, data rate and transmission range. Many studies address this flexibility in the LoRa config-uration choice and the resulting performance trade-offs. An experimental analysis is performed in [2] to evaluate the coverage capacity of a base station in LoRa-based LPWAN using the LoRa default configuration. An area of 1380 km2
can potentially be covered by one base station located 470 m above the sea level. Another study [3] experimentally evaluates the LoRa network coverage in a suburban area. It is shown that the range can be increased from 650 m to 3.4 km by changing the configuration. In [4], the trade-off between the energy consumption and the sensibility in LoRa communications is studied. Experimental results show that if the consumed energy is reduced when using configurations with high data rate, the communication range also decreases. The sensibility to device mobility is studied in [5]. Measurement campaigns
highlight that the LoRa modulation is reliable when the device velocity is maintained lower than a threshold depending on the configuration, e.g. 38 km/h with SF =12 and BW =125 kHz. Moreover, lower SF s allow higher velocities. Meanwhile, in [6], the limitations of LoRaWAN are studied in different use cases, which require different types of data transmission patterns, latency and geographical features. Apparently, the constraints on delay and data rate prevent this technology from applying in some applications such as smart transportation and logistics or video surveillance, while small SFs are selected to reduce the time on air when deploying LoRaWAN for agriculture real time monitoring.
Therefore, configuration selection plays an important role in any LoRa communication. This feature is already used in the LoRaWAN standard that implements an Adaptive Data Rate (ADR) scheme which adapts both end-device configuration and transmission power according to the received Signal-to-Noise Ratio (SNR). However, ADR scheme does not take into account the LoRa sensitivity to fading channels and this sensitivity has just been experimentally observed in state-of-the-art studies. In this paper, the fading channel influence is quantitatively evaluated using a Rice fading channel with a Doppler frequency. To this aim, six configurations with differ-ent data rates are considered and the reliability is imposed by a target Packet Error Rate (PER). Moreover, as the configuration also impacts the consumed energy [7], the aim of the paper is to link the reliability with the energy consumption. Thus, the energy consumption of each configuration is achieved using experimental measures on a Semtech LoRa device. Finally, the trade-off between energy consumption and reliability for LoRa communications according to Rice fading is analyzed.
In the remaining, the LoRa technology is introduced in Section II. Section III presents the channel models. Simulation results are shown in Section IV as well as the energy/reliability trade-off is discussed. Conclusions are given in Section V.
II. LORATECHNOLOGY
LoRa is a long range communication technology promoted by the LoRa Alliance. The LoRa physical layer, which allows long-range, low-power and low data rate communications, is developed by Semtech [8][9]. LoRa communications can use frequency bands of 433 MHz and 868 MHz in Europe (respectively 915 MHz in US and 783 MHz in China) and its data rate can reach up to to 50 kbps. It uses the Chirp
Spread Spectrum (CSS) modulation with a linear variation of frequency on time [10][11], which allows the reduction of both interference and Doppler effects. LoRa modulation can be configured with three parameters: BW , SF and CR.
In LoRa, SF is defined as the logarithm in base 2 of the number of chirp per symbol. LoRa operates with SF from 6 to 12. LoRa uses three bandwidths: 125 kHz, 250 kHz and 500 kHz. A LoRa symbol is therefore composed of 2SF
chirps covering the entire bandwidth, starting with a series of upward (or downward) chirps from an initial frequency, which represents for a code word. The frequency will wraps around to the minimum frequency (or maximum frequency with down-chirp) when the maximum (minimum with down-down-chirp) of the bandwidth is reached. A linear chirp signal is usually defined by: s(t) = A⇥ ej ⇣ 2⇡⇣f0t+µt22 ⌘ + 0 ⌘ , (1)
where 0 is the initial phase, A the amplitude, µ the
chirp rate, f0 the starting frequency of chirp and (t) =
2⇡⇣f0t +µt 2 2
⌘
+ 0is the instantaneous phase at time t. The
corresponding instantaneous frequency is derived by:
f (t) = d (t)
2⇡dt = f0+ µt. (2) Applying CSS to LoRa modulation, each frequency f0in the
band represents a code word. The frequency is swapped at the maximum value of bandwidth, the instantaneous frequency is therefore represented as a modulo operator of BW , given by:
f (t) = fmin+ [( f0+ µt) mod BW ] , (3)
where f0= f0 fmin and fmin is the minimum frequency
of the bandwidth.
With 2SF chirps per symbol, a code word can contain
SF information bits. The duration Ts of a symbol is given
by: Ts = 2SF/BW. For a given bandwidth, increasing the
spreading factor by one unit doubles the Time-on-Air (ToA) to transmit the same amount of data, resulting in the decrease of bit rate. The bit rate is calculated by:
Rb= SF⇥
BW
2SF. (4)
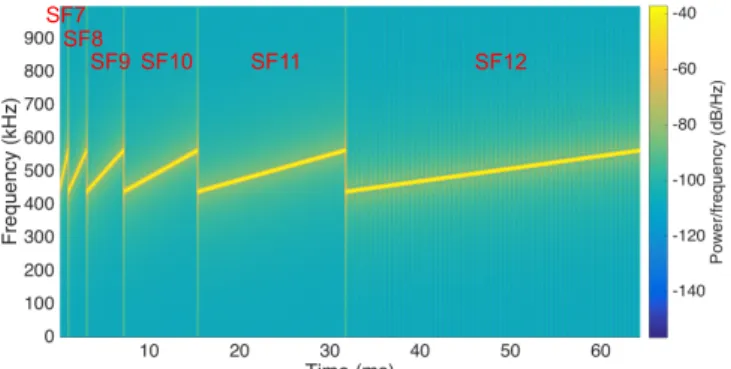
Fig. 1 shows an example of LoRa transmitted symbols with different values of SF from seven to twelve.
The third parameter in the configuration of LoRa modula-tion is the code rate. LoRa can use Forward Error Correcmodula-tion (FEC) code for each block of four information bits. The number of redundant bits for each block varies from one to four, corresponding to CRs of 4/5, 4/6, 4/7 and 4/8. Then, the bit stream is processed by an interleaver to make FEC code more robust to burst errors. Additionally, a whitening structure can also be used to make the signal like white noise, thus avoiding frequency selective channel penalties.
SF12 SF11 SF10 SF9 SF8 SF7
Fig. 1: LoRa transmitted symbols with different values of SF .
III. CHANNELMODELS WITH MOBILITY
The performance of LoRa transmission is evaluated using both Rayleigh and Rice models. Moreover, Additive White Gaussian Noise (AWGN) is considered to model path-loss effects.
A. Rayleigh fading channel
In real-field deployment, the environment between the end-device and base station has many obstacles such as buildings, trees, etc. These obstacles reflect the transmitted signal and generate other paths of transmission. The received signal at the base station is the combination of these replicas and corresponds to multi-path fading channel. In the case of Non Light-of-Sight (NLoS) paths between the end-device and base station, the channel gain h(t) can be considered as a sum of in-phase and quadrature-phase components, i.e. h(t) = hI(t) + jhQ(t). In some scattering environment, hI(t)
and hQ(t)are independent Gaussian variables with zero mean
and variance 2
hat any time t. Therefore, the amplitude |h(t)|
follows a Rayleigh distribution. In this study, the Rayleigh fading channel is generated using the Jakes model [12] defined by: h(t) = p1 L L X l=1 ej(2⇡fDcos ( l)t+✓l), (5)
where L is the number of NLoS paths, ✓l and l are the
initial phase and incident angle of l-th path, respectively. The Doppler shift fD is due to the movement of the end-device
and can be estimated by fD ⇡ vrc/fc, where vr is the relative
velocity between the end-device and base station on the radius direction, c is the light celerity and fcis the carrier frequency.
The Doppler shift affects the coherence time of the channel, given by Tc= f1D. As a consequence, when Ts> Tc, or vr>
cBW
f02SF, fast fading occurs that leads to signal distortion [5].
The channel generated by (5) is normalized by 1/pL to normalize the average gain. The initial phase ✓l is assumed
In Jakes model, the incident signal is assumed to come from all directions. Therefore, if assigning 0 as a random value
uniformly chosen in [0, 2⇡), then lis given by
l= 0+ 2⇡
l 1
L with l = 1, 2, . . . , L. (6) B. Rice fading channel
In the case of LoS environment, hI(t)and hQ(t)are
inde-pendent Gaussian variables but with non-zero means, denoted hI(t) and hQ(t), respectively. Besides, hI(t) and hQ(t) are
supposed to have the same variance 2
h at any time t. Then,
the amplitude of h(t) follows a Rice distribution. A method to determine the value of hI(t)and hQ(t)is introduced in [13],
in which hI(t) and hQ(t) are modeled as deterministic
time-varying parameters:
hI(t) = cos (2⇡fDcos ( 0)t + ✓0) (7)
hQ(t) = sin (2⇡fDcos ( 0)t + ✓0), (8)
where 2= h
I(t)2+ hQ(t)2 is the non-centrality parameter
of Rice distribution, fDcos ( 0) and ✓0 are the Doppler
frequency and the phase of the LoS path, respectively. The Rice fading channel can be set with the Rice factor K, defined as the ratio between the power of the direct path
2 and the power of NLoS paths 2 2
h, i.e. K = 2 2 2
h. When
K = 0, the channel becomes a Rayleigh channel, while when K = 1, the channel does not have fading phenomenon anymore. Without loss of generality, the average power of the channel is normalized to 1 and the power of LoS and NLoS paths can be defined with the Rice factor as:
2 = K K + 1 (9) 2 2 h = 1 K + 1. (10) Therefore, a Rice fading channel is composed of two com-ponents: the first one is generated by the NLoS paths and follows Rayleigh distribution with power 2 2
h= 1/(K + 1);
the second one is the LoS path with deterministic time-varying parameters hI(t) and hQ(t) calculated by (7) and (8), with
power 2 = K/(K + 1). The first scattered component
hNLoS(t)is generated by (5) and normalized in order to get the
power of 1/(K+1), and the second part hLoS(t)corresponds to
the LoS component determined by hLoS(t) = hI(t) + jhQ(t).
As a conclusion, the Rice channel gain can be obtained by: h(t) =p 1 K + 1 h hNLoS(t) +pKej[2⇡fDcos ( 0)+✓0 i , (11) with 0 and ✓0 uniformly distributed in [0, 2⇡).
IV. LORATRANSMISSIONSIMULATION
A. LoRa Setup
To evaluate the transmission performance, six configurations of LoRa are used for both experiments and simulations. The configurations are detailed in Table I, the first one has the lowest data rate, while the last one has the highest. Con-figuration 3 is the LoRa default setup. For the simulations,
TABLE I: LoRa configuration parameters and energy mea-surements for different transmission power levels.
Configuration 1 2 3 4 5 6 CR 4/8 4/5 4/5 4/5 4/8 4/5 SF 12 8 7 7 7 6 BW (kHz) 125 125 125 500 500 500 Rb(kbps) 0.37 3.91 6.84 27.34 27.34 46.88 ToA (ms) 1712.13 102.91 56.58 14.14 19.52 7.71 E (mJ) (PT x= 2dBm) 240 14.43 7.9 2.01 2.77 1.1 E (mJ) (PT x= 10dBm) 379.12 22.74 12.41 3.15 4.32 1.72 E (mJ) (PT x= 14dBm) 507.37 31.96 17.45 4.55 6.13 2.48
the performance of LoRa is measured in term of PER, 2000 packets with 25 bytes of payload per packet are transmitted for each configuration.
B. Energy measurements
First, energy measurements have been performed to estimate the energy per transmitted packet, a payload of 25 bytes per packet is considered. This energy is measured for each configuration and for three levels of PT x: 2 dBm, 10 dBm
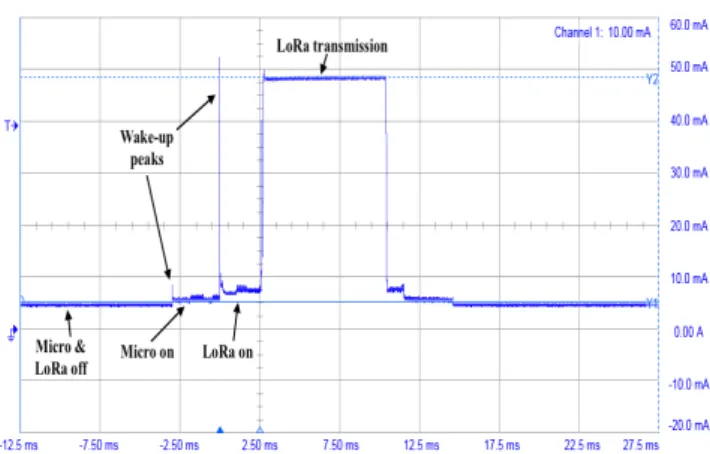
and 14 dBm. The experimental setup consists in a LoRa end-device prototype and a high sensitive current analyzer. The prototype is composed of a Texas Instrument MSP430FR6989 micro-controller and a Semtech SX1276 transceiver. The mea-surements were obtained using an Keysight CX3324A current waveform analyzer (1 GSample/s, 100 pA accuracy). Fig. 2 shows an example of the current waveform when using the configuration 5. The different steps can be observed from the sleep mode to the transmission mode. Latency due to turning on the micro-controller and configuring the transceiver can be
Fig. 2: Microbenchmark showing the current waveform of transmitting a packet with configuration 5.
-30 -20 -10 0 10 20 30 SNR (dB) 10-3 10-2 10-1 100 PER Config 1 Config 2 Config 3 Config 4 Config 5 Config 6 AWGN Rayleigh v = 30km/h
Fig. 3: LoRa performance in AWGN channel and Rayleigh channel (with an end-device velocity of 30 km/h).
observed as well as high current peaks that must be taken into account when powering the platform.
Energy measurement results are shown in Table I. The energy required to send a packet using the highest data rate is 200 times lower than the one required to send a packet using the lowest data rate. The energy per packet is obviously increasing with the transmission power, about twice more between 2 dBm and 14 dBm.
C. Reliability evaluation
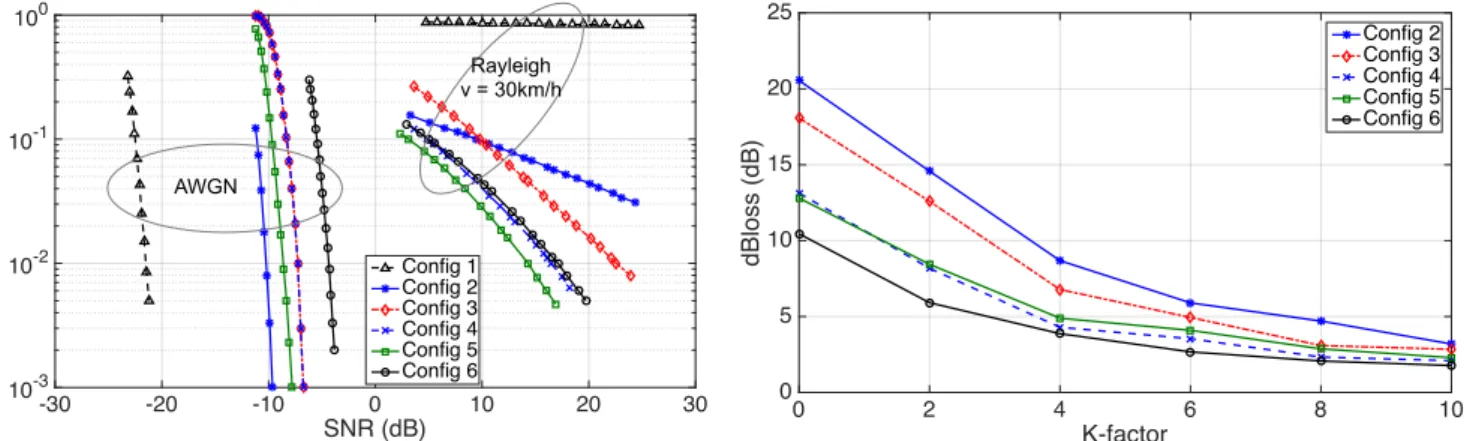
To evaluate the LoRa reliability over different channels, performance in terms of PER is obtained using simulations for all the configurations. The results are shown is Fig. 3 for both AWGN channel and Rayleigh channel with end-device velocity of 30 km/h, PER are given according to the Signal-to-Noise Ratio (SNR) at the receiver. In a non-fading AWGN channel, LoRa transmission using the first configura-tion (SF 12, 125 kHz of BW ) shows the best performance, and can reach a PER of 10 1at SNR = -22.5 dB and 10 2at
SNR = -21.5 dB. Meanwhile, configuration 6 (SF 6, 500 kHz of BW ) shows the worst performance with a PER of 10 1
at SNR = -5.47 dB and 10 2 at SNR = -4.36 dB. In AWGN
channel, performance is globally better when increasing the spreading factor. On the other hand, the bandwidth does not affect the performance as configuration 3 (SF 7, 125 kHz of BW, CR 4/5) and configuration 4 (SF 7, 125 kHz of BW , CR4/5) achieve the same performance. Finally, using a FEC code improves the performance and a 1.4 dB gain at PER = 10 1can be achieved between configuration 4 (SF 7, 125kHz
of BW , CR 4/5) and configuration 5 (SF 7, 125kHz of BW , CR 4/8).
In contrast, when Rayleigh fading channel is considered, the first configuration shows the worst performance with a PER always higher than 80%. This result can be explained by the symbol time of this configuration close to the coherence time of the channel at 30 km/h, i.e. Ts = 32.8ms and
Tc ⇡ 41.5 ms, respectively. The long symbol duration of
configuration 1 makes it highly sensitive to fading channel.
0 2 4 6 8 10 K-factor 0 5 10 15 20 25 dBloss (dB) Config 2 Config 3 Config 4 Config 5 Config 6
Fig. 4: Loss of received signal power to maintain PER=10 1
as in AWGN channel when the end-device velocity is 30km/h).
Similarly, configuration 2 with a SF of 8 also shows a bad performance, with a 20.55 dB loss compared to AWGN channel to reach a PER of 10 1and the inability to obtain PER
of 10 2. While configurations 3 and 4 reach the same
per-formance in an AWGN channel, configuration 4 outperforms configuration 3 in a Rayleigh fading channel. Using a larger bandwidth (500kHz compared to 125kHz for configuration 3) reduces the symbol duration and makes the transmission less disturbed by the fading.
To evaluate the performance changes of each configuration due to the channel variation, we defined the dBloss as the loss of received signal power to obtain the same PER as for AWGN channel. The dBloss are given in Fig. 4 for PER = 10 1for
different values of the K-factor in Rice channel model. When K ! +1, the channel can be considered as AWGN and the dBloss decreases to 0 dB for all configurations. Because PER = 10 1 can not be obtained with configuration 1, Fig. 4
only shows the results of five remaining configurations. The simulation results show that configuration 2 always obtains the highest dBloss, while configuration 6 gives the lowest. Meanwhile, configurations 4 and 5 get the same loss, meaning that they have the same sensitivity to fading channel. In a general way, configurations with higher spreading factor, i.e longer symbol duration, are more sensitive to the channel variation.
D. Energy-reliability trade-off
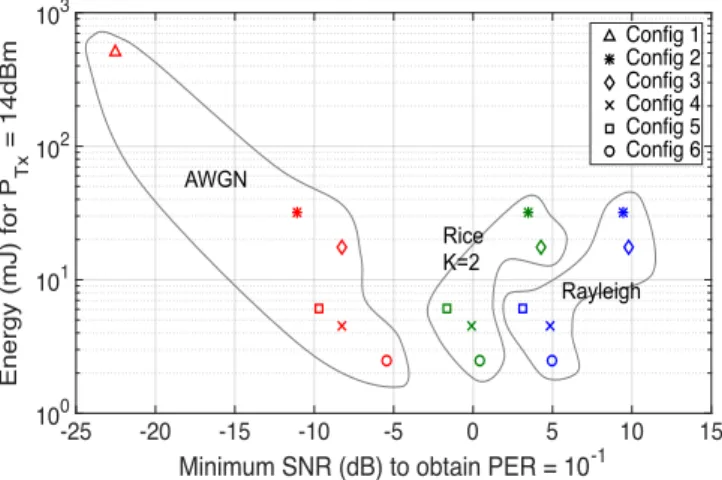
As illustrated in Table I and Fig. 3, a configuration with higher data rate consumes less energy but gives a worse performance in AWGN channel. Therefore, the selection of a configuration has to make balance between the energy consumption and the reliability depending on the fading chan-nel. Fig. 5 illustrates the energy consumption for 14 dBm transmission power to send 25 bytes of payload and the minimum SNR at the receiver to obtain a target PER of 10 1 over different channels. Configurations 1 and 2 seem
to be less efficient. While the PER of 10 1 can not be
-25 -20 -15 -10 -5 0 5 10 15 Minimum SNR (dB) to obtain PER = 10-1
100 101 102 103 Energy (mJ) for P Tx = 14dBm Config 1 Config 2 Config 3 Config 4 Config 5 Config 6 AWGN Rice K=2 Rayleigh
Fig. 5: Energy consumption (PT x=14 dBm) versus minimum
SNR at the receiver to obtain PER of 10 1.
much energy and high SNR at the receiver to obtain the target PER in Rayleigh fading channel. In contrast, configuration 6 is interesting in Rayleigh channel because it does not only require the smallest energy but also lower SNR to obtain PER of 10 1 than configurations 2 and 3, and same SNR
as configurations 4. Although it still requires a higher SNR than configuration 5, it is worth noting that the coding rate of this configuration is highest than the one of configuration 5. In a general way, selecting a configuration with low data rate is better for AWGN channel in terms of minimum SNR required to obtain a target PER at the receiver. Meanwhile, configurations with higher data rate are good choices for deep fading channels, particularly in NLoS environment.
V. CONCLUSIONS
The LoRa standard considers different degrees of freedom to configure the transmission and includes the ADR mechanism to dynamically adapt the data-rates to the channel conditions. This algorithm is based on the received SNR to change the configuration. In this paper, we analyzed the trade-off between reliability and transmitter energy consumption according to channel parameters. In this context, we used simulation to In addition, the transmitter energy consumption was studied for a Semtech device with three different values of transmit power. According to a target PER, we are able to connect the required SNR with the energy consumption for all configura-tions. One can then choose the best configurations according
evaluate the reliability of LoRa modulation in a Rice fading channel (two parameters K factor and node speed were tuned). The PER was considered as a QoS criterion and six different configurations were selected (spreading factor, bandwidth, code rate). Simulation results showed that a high SF enhances the performance in AWGN channel. However, it is also more sensitive to channel variations, which is illustrated by the higher loss of received signal power to maintain the same PER as in AWGN channel.
to a deployment. Ideally, the configuration may be chosen including not only SNR but also fading and velocity.
REFERENCES
[1] LoRa Alliance, “White paper: A technical overview of LoRa and LoRaWAN,” The LoRa Alliance: San Ramon, Tech. Rep., 2015. [2] K. E. Nolan, W. Guibene, and M. Y. Kelly, “An evaluation of low power
wide area network technologies for the Internet of Things,” in Inter-national Wireless Communications and Mobile Computing Conference (IWCMC), Sept. 2016, pp. 439–444.
[3] A. Augustin, J. Yi, T. Clausen, and W. M. Townsley, “A study of LoRa: long range and low power networks for the Internet of Things,” Sensors, no. 2016: 1466.
[4] F. Ait Aoudia, M. Gautier, M. Magno, M. Le Gentil, O. Berder, and L. Benini, “Long-short range communication network leveraging LoRa and wake-up receiver,” Microprocessors and Microsystems, vol. 56, pp. 184 – 192, 2018.
[5] J. Petjjrvi, K. Mikhaylov, M. Pettissalo, J. Janhunen, and J. Iinatti, “Per-formance of a low-power wide-area network based on LoRa technology: Doppler robustness, scalability, and coverage,” International Journal of Distributed Sensor Networks, vol. 13, no. 3, 2017.
[6] F. Adelantado, X. Vilajosana, P. Tuset-Peiro, B. Martinez, J. Melia-Segui, and T. Watteyne, “Understanding the Limits of LoRaWAN,” IEEE Communications Magazine, vol. 55, no. 9, pp. 34–40, 2017.
[7] F. Ait Aoudia, M. Magno, M. Gautier, O. Berder, and L. Benini, “A Low Latency and Energy Efficient Communication Architecture for Heterogeneous Long-Short Range Communication,” in Euromicro Conference on Digital System Design (DSD), Limassol, Cyprus, Aug. 2016.
[8] O. Seller and N. Sornin, “Low power long range transmitter,” Aug. 2014, US Patent App. 14/170,170. [Online]. Available: https://www.google.com/patents/US20140219329
[9] Semtech, “SX1272/73–860 MHz to 1020 MHz low power long range transceiver,” Tech. Rep. Datasheet, Mar. 2015. [Online]. Available: http://www.semtech.com/images/datasheet/sx1272.pdf
[10] A. Springer, W. Gugler, M. Huemer, L. Reindl, C. C. W. Ruppel, and R. Weigel, “Spread spectrum communications using chirp signals,” in IEEE/AFCEA EUROCOMM 2000, Information Systems for Enhanced Public Safety and Security, 2000, pp. 166–170.
[11] B. Reynders and S. Pollin, “Chirp spread spectrum as a modulation technique for long range communication,” in Symposium on Communi-cations and Vehicular Technologies (SCVT), Nov. 2016, pp. 1–5. [12] W. Jakes, Microwave mobile communications, ser. IEEE Press classic
reissue. IEEE Press, 1974.
[13] T. Aulin, “A modified model for the fading signal at a mobile radio channel,” IEEE Transactions on Vehicular Technology, vol. 28, no. 3, pp. 182–203, Aug. 1979.