Regional cerebral metabolic patterns demonstrate the
role of anterior forebrain mesocircuit dysfunction in
the severely injured brain
Esteban A. Fridmana, Bradley J. Beattieb, Allegra Broftc, Steven Laureysd, and Nicholas D. Schiffa,1
aDepartment of Neuroscience, Brain, and Mind Research Institute, Weill Cornell Medical College, New York, NY 10065;bMedical Physics, Memorial Sloan-Kettering Cancer Center, New York, NY 10065;cDepartment of Psychiatry, Columbia University College of Physicians and Surgeons, New York, NY 10032; anddComa Science Group, Cyclotron Research Centre and Neurology Department, University of Liege and Centre Hospitalier Universitaire du Sart Tilman, 4000 Liege, Belgium
Edited by Marcus E. Raichle, Washington University in St. Louis, St. Louis, MO, and approved March 18, 2014 (received for review November 8, 2013) Although disorders of consciousness (DOCs) demonstrate widely
varying clinical presentations and patterns of structural injury, global down-regulation and bilateral reductions in metabolism of the thalamus and frontoparietal network are consistent findings. We test the hypothesis that global reductions of background synaptic activity in DOCs will associate with changes in the pattern of metabolic activity in the central thalamus and globus pallidus. We compared 32 [18F]fluorodeoxyglucose PETs obtained from se-verely brain-injured patients (BIs) and 10 normal volunteers (NVs). We defined components of the anterior forebrain mesocircuit on high-resolution T1-MRI (ventral, associative, and sensorimotor striatum; globus pallidus; central thalamus and noncentral thala-mus). Metabolic profiles for BI and NV demonstrated distinct changes in the pattern of uptake: ventral and association striatum (but not sensorimotor) were significantly reduced relative to global mean uptake after BI; a relative increase in globus pallidus metabolism was evident in BI subjects who also showed a relative reduction of metabolism in the central thalamus. The reversal of globus pallidus and central thalamus profiles across BIs and NVs supports the mesocircuit hypothesis that broad functional (or an-atomic) deafferentation may combine to reduce central thalamus activity and release globus pallidus activity in DOCs. In addition, BI subjects showed broad frontoparietal metabolic down-regulation consistent with prior studies supporting the link between central thalamic/pallidal metabolism and down-regulation of the fronto-parietal network. Recovery of left hemisphere frontofronto-parietal met-abolic activity was further associated with command following. vegetative state
|
minimally conscious state|
thalamocortical loops|
fronto-striato-thalamic circuitD
isorders of consciousness (DOCs) following severe brain injuries arise in the setting of both cellular and circuit-level dysfunction secondary to deafferentation, neuronal death, and a wide range of changes in cellular function that remain poorly understood. Many studies demonstrate that patients with DOCs may continue to improve slowly over long time intervals (1, 2). In this context, measurements of cerebral metabolism can provide important insight into underlying mechanisms of brain function after severe brain injury (BI).Historically, [18F]fluorodeoxyglucose-PET (FDG-PET) mea-surements provided the first demonstrations that the vegetative state (VS) was characterized by sharp, global reductions in ce-rebral metabolism to levels consistent with those measured in coma induced by pharmacologic anesthesia (3–5). FDG-PET measurements in the minimally conscious state (MCS) demon-strate similar levels of metabolic depression despite evidence of greater cerebral integrative function in this state (6–8). Assess-ments of regional changes in metabolism across the brain after severe BI indicate a key role for the posterior medial complex (6, 8), the cortical areas demonstrating the highest resting metabo-lism in the normal brain (9). Graded increases in metabometabo-lism in
the posterior medial complex index recovery from VS to normal function (6) and provide a proxy, along with global metabolic rates for overall changes in background synaptic activity in BI based on known physiological correlation of glucose metabolism with neuronal firing rates (10).
Recent anatomical studies point to a key role of structural connectivity of the thalamus and the posterior medial complex as indexing anatomical substrates correlated with graded outcomes across VS and levels of function within the category of MCS (11). These observations provide an important link to measurements of restoration of central thalamic metabolism across recovery of consciousness (12) and direct restoration of behavioral re-sponsiveness in MCS with electrical stimulation of the central thalamus (c-TH) (13). Theoretical considerations based on known anatomical connectivity, physiological principles, and patho-physiological observations have combined into a proposed model for graded variations in metabolic activity within the anterior forebrain“mesocircuit” across DOCs (14). The mesocircuit model predicts that several related phenomena should arise at the cir-cuit level following BI and also suggests important links to the metabolic variations observed in the posterior medial complex in DOC (8, 15). Most importantly, the model predicts that changes in overall metabolism observed in BI and generally associated with frontoparietal metabolic suppression (4, 8) should covary with a reversal of metabolic activity in the globus pallidus (GP) and c-TH.
Significance
Establishing consciousness in the human brain requires an en-semble activity of multiple cortical and subcortical structures. Following severe brain injuries, widespread deafferentation and neuronal death alter function across the corticothalamic system and its projections to the basal ganglia. In this paper, we test a theoretical model of a mesocircuit mechanism likely to arise in all severe brain injuries. Specifically, reduction of resting glucose metabolism within the central thalamus, stria-tum, and frontoparietal cortices and concomitant increases in metabolism within the globus pallidus as a result of disinhibi-tion are proposed to arise across etiologies of injury. Here we verify this prediction and demonstrate a reversal of metabolic profile of central thalamus and globus pallidus that character-izes and indexes the patients’ behavioral level.
Author contributions: E.A.F. and N.D.S. designed research; E.A.F., A.B., S.L., and N.D.S. performed research; E.A.F. and N.D.S. contributed new reagents/analytic tools; E.A.F., B.J.B., and N.D.S. analyzed data; and E.A.F., B.J.B., S.L., and N.D.S. wrote the paper.
The authors declare no conflict of interest. This article is a PNAS Direct Submission.
1To whom correspondence should be addressed. E-mail: nds2001@med.cornell.edu.
This article contains supporting information online atwww.pnas.org/lookup/suppl/doi:10.
1073/pnas.1320969111/-/DCSupplemental.
NEUROSCI
Here we test these predictions of the mesocircuit model using FDG-PET and behavior measurements in a cohort of severely BI subjects and a group of normal volunteers (NVs). We tested the related hypotheses that the metabolism of the c-TH and the striatum is reduced in severe BI compared with NV subjects and that GP metabolism is increased as a consequence of decreased c-TH outflow to both frontal cortex and striatum. Finally we test the hypothesis that in severe BI the metabolism would be most reduced over cortical regions critical to higher-order cognitive function.
Results
Comparison of Patterns Resting Metabolism in Subcortical Structures of Brain-Injured and Healthy Controls. We first sought to assess whether patterns of resting metabolism differed across sub-cortical structures of BI and NV groups (Fig. 1A–D). As a first step, we compared the groups using a factorial ANOVA that demonstrated significant effects of mean normalized uptake values (mn-UV) for the factors group (F = 5.7, P = 0.017) and basal ganglia and thalamic region of interest (ROI) (F = 59.3, P < 0.0001), as well as in their interaction (F = 21.9, P < 0.0001); no lateralization effect or interaction of lateralization with group or basal ganglia and thalamic ROI appeared. Therefore, we combined results from subcortical structures of both hemi-spheres. One-way between-group comparison of the regional mn-UV of the functional subdivisions of the striatum and thal-amus demonstrated the following differences between patients and controls: glucose metabolism of the ventral striatum (VST) and the associative striatum (AST) were significantly reduced after severe BI (mn-UV± SEM for VST: NV = 1.19 ± 0.11, BI= 0.48 ± 0.08; F = 21.8, P < 0.0001; AST: NV = 1.20 ± 0.09,
BI = 0.54 ± 0.09; F = 14.5, P = 0.003), but metabolism of sensorimotor striatum (SMST) did not differ [NV = 1.06 ± 0.13, BI= 1.30 ± 0.10; F = 1.5, P = not significant (NS)]. A significant increase of mn-UV for the GP is present for the BI group (NV= −0.49 ± 0.10, BI = 0.52 ± 0.07; F = 48.3, P < 0.0001), whereas the c-TH showed a significant reduction of glucose me-tabolism for the BI group (NV= 0.43 ± 0.07, BI = −0.34 ± 0.06; F = 45.2, P < 0.0001), and the noncentral thalamus (non-c-TH) remained unaffected (NV= −0.25 ± 0.08; BI = −0.23 ± 0.05; F = 0.8,P = NS; Fig. 2A). The relationship of these significant changes in GP and c-TH metabolic rates of the BI subjects importantly represents an exact reversal of the pattern demonstrated by the healthy controls (Discussion).
As a second step of statistical verification, a post hoc Bonferroni-corrected analysis of the two-way ANOVA (within group and ROI) demonstrated (i) a significant reduction of the metabolism in VST and AST compared with SMST for the BI group only; (ii) an in-crease in GP metabolism for the BI group (showing an equivalent metabolism compared with AST and VST) compared with NV group (where GP metabolism is significantly lower than in the VST, AST, and SMST); (iii) a significant difference between c-TH and GP for both BI and NV groups with a clear pattern reversal (see above); and (iv) an equivalence of c-TH and non-c-TH metabolism for the BI group in contrast with a significantly higher metabolism observed in c-TH compared with non-c-TH for NV (Fig. 2B).
We next carried out a multiple regression analysis using only the initial FDG-PET for the six patients longitudinally tested to further assess the relationship between c-TH glucose metabolism against VST, AST, SMST, and non-c-TH (R2adj=0.72,F = 35.9, P < 0.0001). In this omnibus comparison, a significant inverse cor-relation of c-TH and GP glucose metabolism was identified (F = 23.3,P < 0.0001; Durbin-Watson = 1.97, serial autocorrelation = −0.014): higher GP glucose metabolic rates covaried with lower c-TH glucose metabolic rates (Fig. 2C).
Cortical Glucose Metabolism After Severe BI. We compared the regional glucose metabolism across cortical ROIs selected for analysis. A three-way ANOVA demonstrated significant effects of factors group (F = 244.9, P < 0.0001), ROI (F = 33.2, P < 0.0001), and side (F = 8.5, P = 0.0035), as well their interactions (F = 2.4, P = 0.003). Accordingly, for comparisons of cortical metabolism, left and right results are reported separately (Fig. 3 andTable S1). One-way ANOVA showed a significant reduction of glucose metabolism in the BI group bilaterally across frontal cortical regions [i.e., orbitofrontal cortex (OFC), ventromedial prefrontal cortex (vmPFc), dorsolateral prefrontal cortex (dlPFc), and premotor cortex (PMC)], with the exception of the primary sensorimotor cortex (SM1) (Fig. 3A and B). Deep-seated mesial cortical structures including the anterior cingulate cortex (aCGc) did not show group differences; however, the medial cingulate cortex (mCGc), the precuneus, and the left posterior cingulate cortex (pCGc) show a marked symmetric reduction of glucose metabolism in BI. Finally, the BI group showed significant reductions of metabolism of posterior cortical structures on the lateral surface [i.e., bilateral superior posterior parietal cortex (sPPc), right inferior posterior parietal cortex (iPPc), and pri-mary visual cortex (V1)]. No alteration of glucose metabolism was observed on the posterior one-third of the superior temporal sulcus (post-1/3 STS).
Multiple regression analysis of all cortical ROIs only showed a moderate significant linear relationship (R2
adj= 0:56, F = 4.3; P < 0.005) between the right c-TH/aCGc (β = −0.58; P < 0.01) and the c-TH/post-1/3 STS (β = −0.53; P < 0.01] and on the left side (R2
adj= 0:50, F = 3.5; P < 0.01) between the c-TH/post-1/3 STS (β = −0.55; P < 0.01). Because activity in the precuneus has been specifically associated with recovery of consciousness (11), we further tested in a simple regression model its metabolic interactions with c-TH. Results show a (+) linear relationship
A
C
B
D
VST AST SMST GP non-c-TH c-TH VST AST SMST GP non-c-TH c-TH 5 . 4 0 5 . 4-Fig. 1. (A and B) Axial anatomic high-resolution MRI in representative NV and BI subjects, respectively, showing locations and manual delimitation for ventral, associative, and sensorimotor striatum (VST, AST, and SMST, re-spectively), globus pallidus (GP), central and noncentral thalamus (c-TH and non-c-TH, respectively), and color scheme for regions of interest (VST, yel-low; AST, green; SMST, red; GP, white; c-TH, magenta; non-c-TH, violet). (C and D) [18F]FDG-PET, T1-MRI fusion in in representative NV and BI subject, respectively. NV demonstrates symmetric pattern of relatively increased c-TH metabolism compared with non-c-TH. A marked asymmetry of thalamic metabolism with loss of contrast in c-TH compared with non-c-TH metabo-lism is evident in BI subject.
between metabolism in precuneus and c-TH (F = 18.449; P < 0.0001; Durbin-Watson= 2.23; serial autocorrelation = −0.12). Separation of BI Subjects with Evidence for Command Following: Subcortical Structures.As a separate comparison, we segregated the BI group into subsets of subjects capable of demonstrating command following from those unable to show behavioral evi-dence of command following at the bedside (Fig. 4). This anal-ysis followed an initial evaluation of the Coma Recovery Scale Revised (CRS-R) total scores that did not significantly covary with the brain glucose metabolic rates across the patient subject pool. Membership assignments within these two patient groups were based on the cutoff of the auditory function scale of the CRS-R: command following and no command following. The no command following included 3 patients in VS and 10 subjects in the MCS(−) classification, whereas all command following patients fulfill the MCS(+) category (16) (we excluded patients that emerged from MCS and were in locked-in syndrome who were not tracked on this measure). One-way comparisons be-tween the subgroup of BI subjects able to follow commands and those unable to follow commands demonstrated a difference in glucose metabolism of the c-TH; c-TH demonstrated signifi-cantly increased glucose metabolism for the command following subgroup (command following= −0.13 ± 0.06 vs. no command following = −0.45 ± 0.09; F = 8.3, P = 0.005). An opposite finding was present for the VST (command following= 0.26 ± 0.12 vs. no command following= 0.61 ± 0.09; F = 5.6, P = 0.02; Fig. 4A). To assess the linkage of the expressed pattern of c-TH/GP metabolic reversal to behavioral profiles, we created a ratio for c-TH and GP glucose metabolism using the individual raw stan-dardized uptake value (SUV) (not normalized to the global mean). One-way ANOVA comparisons of c-TH/GP ratio between NVs and the BI command following and no command following groups showed that those BI subjects who followed commands demon-strated a significantly higher c-TH/GP ratio even though they also significantly differed from NVs [command following= 0.89 ± 0.031 vs. no command following = 0.75 ± 0.034 (P = 0.0019) and vs. NV= 1.26 ± 0.030 (P ≤ 0.0001); F = 59.842, P < 0.0001; Fig. 4B]. Separation of BI Subjects with Evidence for Command Following: Cortical Regions. A one-way ANOVA comparison of mn-UV of cortical regions between the command following and no
command following groups showed a significant increment of the regional glucose metabolism in three left-sided cortical regions for the command following group: the SM1 (com-mand following= 0.73 ± 0.09 vs. no command following = 0.30 ± 0.10;F = 7.4, P = 0.007), the iPPc (command following = 1.07 ± 0.08 vs. no command following = 0.32 ± 0.13; F = 23.0, P < 0.0001), and the sPPc (command following= 0.04 ± 0.09 vs. no command following = −0.55 ± 0.21; F = 6.5, P = 0.017). A significant difference between command following and no command following was also observed for the right OFC, which showed a reduction of glucose metabolism in the command fol-lowing group (command folfol-lowing= −0.50 ± 0.10 vs. no command following= 0.02 ± 0.09; F = 15.2, P = 0.0001; Fig. 4C).
Discussion
The main finding of the present study is that specific changes in the pattern of resting metabolic activity measured by FDG-PET across the individual substructures of the striatal-pallidal-thala-mocortical circuit demonstrates clear differences in severe BI patients with DOCs in comparison with NVs.
Reversal of Resting Metabolic Profile of Central Thalamus and Globus Pallidus Characterizes the Severely Injured Brain and Supports the Key Role of the Anterior Forebrain Mesocircuit. A recently pro-posed model predicts that global reductions of background synaptic activity in DOC subjects will associate with a specific pattern of metabolic down-regulation in the c-TH and GP (14).
-1.5 -.5 .5 1.5 2.5 VST AS T SM ST GP c-T H non-c -TH mn-UV VST AST SMST GP c-TH non-c-TH VST AST SMST GP c-TH non-c-TH
A
B
C
NV BI c-TH GP -1.5 -.5 .5 1.5 -2 -1 0 1Fig. 2. Group data displaying mn-UV of glucose metabolism in deep brain structures measured in NV and BI subjects. (A) Box plot. A significant re-duction in relative glucose metabolism of the ventral striatum (VST), asso-ciative striatum (AST), and central thalamus (c-TH) in BI subjects is seen compared with NV. No difference in sensorimotor striatum (SMST) mn-UV is present between NV and BI subjects. A significant increase in globus pallidus (GP) metabolism is present in the group of BI subjects. (B) Contrast showing the results of the post hoc Bonferroni corrected analysis of a two-way ANOVA (group and ROI). Significant results are shown in blue for NV and red for BI patients, whereas white boxes denote no significant differences; arrows indicate the direction of the significance (i.e., pointing toward the higher mn-UV values). (C) Bivariate scattergram demonstrates an inverse linear correlation between glucose metabolic rate of the c-TH (x axis) and the GP (y axis), P< 0.001 (between groups).
-3 -1 1 3 OF C vm P F c dl P Fc PM C SM 1 aC G c mC G c pC G c pr e c une us s PPc iPP c p o st 1/ 3 S T S V1 mn-UV -3 -1 1 3 OF C vm P F c dl P F c PM C SM 1 aC G c mC G c pC G c pr e c une us sP P c iP P c pos t 1 /3 S T S V1
A
B
NV BI mn-UVFig. 3. Group data displaying mn-UV of regional cortical glucose metabo-lism in NV and BI subjects. (A) Box plot for the left hemisphere cortical regions showing a significant reduction of glucose metabolism across ante-rior frontal cortices, medial cingulate cortex (mCGc)/precuneus, and poste-rior parietal cortices in BI subjects. Note a distinct pattern of rostrocaudal progression of increasing mn-UV glucose metabolic values in BI patients as arranged [orbitofrontal, ventromedial, and dorsolateral prefrontal cortices, premotor cortices and primary sensorimotor (OFC/vmPFC/dlPFc/PMC/SM1, respectively)] that converges with NV mn-UV at SM1. BI subjects demon-strate significant decreases in superior posterior parietal cortex (sPPC), pos-terior cingulate cortex (pCGc), precuneus, and V1. (B) Box plot for the right hemisphere showing similar pattern of rostrocaudal progression of in-creasing mn-UV glucose metabolic values in BI patients as arranged (OFC/ vmPFC/ dlPFc/PMC/SM1). Note that right pCGc does not show differences in observed for left hemisphere in posterior structures (for significance, see
Table S1).
NEUROSCI
Specifically, as a result of the high-threshold UP states of the medium spiny neurons in the striatum (17), it is probable that in the setting of broad deafferentation of corticostriatal and thalamostriatal inputs that the striatal inhibition of the GP will weaken and allow increased pallidal activity and consequent inhibition of c-TH (SI Text and Fig. S1). Our findings of re-duced c-TH metabolism and increased GP metabolism in DOC subjects compared with the NVs supports this mesocircuit hypothesis.
The c-TH is known to have dopamine (DA) expression with levels approximating those found in the substantia nigra (SN) (18, 19) and a preponderant distribution of D2-like receptors (i.e., D2and D3) (20). Indeed, c-TH DA may constitute a fourth dopaminergic pathway (21) sometimes referred as mesothalamic (22, 23). Therefore, we designed an indirect method to segment the thalamus into two main subregions, the c-TH and the non-c-TH, using a dopamine D2-like receptor ligand template (SI Text). We were able to separate the most representative map of D2-like thalamic receptors in NVs with [11C]raclopride to show then that if this map is applied to analyze the glucose metabolism in NVs, a clear higher metabolism exists in the c-TH when contrasted to the noncentral aspect of the structure. More importantly, when this same thalamic subdivision was implemented in severe BI patients and results were contrasted to those obtained from NVs, there was a metabolic reduction strictly confined to the c-TH. Moreover, when the group of patients was divided based on their ability to follow commands, c-TH metabolism was higher in the group of responders. Hemodynamic thalamic dysfunction in DOCs has long been shown (24) and is further supported by metabolic studies using [18F]-FDG (5, 25). However, this is to our knowledge, the first evidence of a sustained deficit in glucose metabolism after severe BI at a substructural thalamic level (here, the c-TH).
Here, the striatum was functionally divided based on its cor-tical loops (SI Text). We find that severe BI patients demonstrate a disproportionate striatal metabolic deficit compromising se-lectively the VST and AST but sparing the SMST. This distinc-tion in metabolic profiles can be related to our findings of relatively preserved cortical metabolism in SM1, which shows no difference across BI and NV groups. A relative integrity of SM1 neurons and their activity likely accounts for the maintained
mn-UV in SMST. Conversely, AST and VST compartments of the striatum are linked to frontal association cortices known to be functionally engaged during highly elaborated cognitive pro-cessing (26–28), all of which show clear metabolic reduction in BI; loss of corticostriatal and thalamostriatal input from c-TH is proposed to account for these measured differences.
There are clear distinctions in the functional relationship of thalamic nuclei and the striatum. Thalamostriatal networks are divided into two segregated subsystems: the centromedian/para-fascicular complex striatal projection and the non-centromedian/ parafascicular striatal projection (29). Although the thalamic segmentation implemented in this work has mostly likely ag-gregated the c-TH to include the centromedian/parafascicular complex along with additional anterior midline structures, our results in severe BI patients are supportive of a major selective failure of both the main thalamostriatal and corticostriatal projections to the associative and limbic brain with a preser-vation of the sensorimotor system. Specifically, this inference is supported by (i) the low metabolism of the c-TH, VST, and AST; (ii) the relatively equal metabolic profiles of the SMST and SM1 in the NV and BI groups; (iii) the lack of alteration of the non-c-TH metabolic profile; and (iv) the observed meta-bolic increases in GP that show inverse correlation with the c-TH metabolic deficit evident in severe BI patients, suggesting a greater vulnerability of the parafascicular over the centromedian within the centromedian/parafascicular complex and its striatal projection (30).
Fronto-Parietal Cortical Metabolic Down-Regulation in the Severely Injured Brain: Evidence for Lateralization and Mechanistic Link to Subcortical Metabolism. Similar to prior FDG-PET findings in patients with DOCs, we found here a marked frontoparietal metabolic down-regulation, most prominent in the precuneus (Fig. 3). The present findings extend these observations and provide a demonstration of hemispheric lateralization in fron-toparietal metabolic rates distinguishing those patients able to follow commands from those who cannot. Increased metabolism in cortical regions correlated with this distinction are primarily in the left posterior parietal cortex and its connections with the SM1, with the exception of a relative suppression of metabolic activity in the right OFC. A similar dissociation in the metabolic rates of subcortical structures is also evident across the two pa-tient groups, with increased c-TH activity linked to the command following group along with relatively suppressed VST metabolic activity. Collectively, the findings indicate that the patient sub-jects in the no command following group have both a down-regulation of the left posterior parietal cortex and posterior medial complex (6, 8), as well as an excess of disinhibition of limbic frontal cortices (Fig. 4C). In addition, a more global down-regulation of the anterior forebrain indexed by the c-TH/GP ratio in the no command following group is also present (Fig. 4B). Both of these findings may be related to the metabolic suppression of the c-TH. Anatomical and physiological studies have established the close link between the c-TH and the pos-terior medial cortical regions; such studies include track tracings in nonhuman primates (31) and demonstrations that the c-TH and precuneus show covarying decreases in regional blood flow during anesthetic coma compared with wakeful baselines that reverse together when consciousness is briefly restored (32). Importantly, our findings here that a linear relationship exists between metabolism in precuneus and c-TH supports this physiological linkage of the central thalamus to the key cortical structure demonstrating highest resting metabolism and corre-lation with level of recovery of consciousness (6, 9, 33). Thus, the present findings provide further detail of the known graded increases in cerebral metabolic rate in the posterior medial complex indexing recovery from VS to normal function (6) and suggest that regional patterns of metabolic rate within the
A
B
-2 -1 0 1 2 VST c-TH 1.5 1.25 1 .75 .5 Ratio c-TH/GP -2 -1 0 1 2 N-CF NV CFC
mn-UVRight OFC Left SM1 Left iPPc Left sPPc
mn-UV
Fig. 4. Group data displaying mn-UV of glucose metabolism for deep brain and cortical structures comparing subsets of severe BI patients demonstrat-ing command followdemonstrat-ing (CF; green), those in the noncommand followdemonstrat-ing (N-CF) group (gray), and NV (blue). (A) Box plot of two deep brain structures showing a significant difference in glucose metabolism. Increases of mn-UV are seen in c-TH for the CF group compared with N-CF, whereas decreases in VST are present. (B) Box plot of the ratio c-TH/GP of raw standard uptake values body weight normalized (i_c-TH/GP); index separates the CF and N-CF groups with increased ratio in CF group that remains lower than NV. (C) Box plot of four cortical structures showing a significant difference in glucose metabolism between the two groups. A significant increase of glucose me-tabolism in the CF group is present for SM1, iPPc, and sPPc in the left hemisphere. An opposite metabolic pattern is seen for the right OFC, which shows a reduction of metabolism for CF group. This finding is consistent with that observed in the VST (A).
frontoparietal network may be informative of mechanisms underlying differences in clinical presentation of patients with DOC. Another detail evident in the differences in fronto-parietal metabolism across the patients is a metabolic gradi-ent with appargradi-ently more pronounced metabolic differences across a rostocaudal distribution from prefrontal cortex to SM1 (Fig. 3); this finding is also consistent with the mesocircuit model and comparable to a tendency for the more anterior pre-frontal cortical regions to demonstrate reduced blood flow under anesthesia, sleep, and even early awakening sleep inertia (34, 35). Collectively, these findings support a mechanistic link between the key role of the posterior medial complex in outcomes of DOCs (36), restoration of normal resting metabolic activity (33), and restoration of anterior forebrain mesocircuit function via activity of the c-TH (13, 14).
Therapeutic Implications of Metabolic Profiles of the Severely Injured Brain: Toward Molecular Neuroimaging of the Mesocircuit Model of DOCs.Our findings suggest implications for therapeutics at three different sites of action, c-TH, striatum, and GP, and point to testable predictions for future studies that use receptor binding ligands, PET, and pharmacologic intervention.
Dopaminergic drugs may directly increase the dopaminergic tone within the c-TH, enhancing its output (37, 38). It is also likely that dopaminergic drugs at the striatum may counterbalance the observed deficits in the direct and indirect pathway (via D1and D2, respectively) (39), and the net gain would be the reduction of the inhibitory input to the c-TH. Last, dopaminergic drugs can directly stimulate D1-postsynaptic receptors at the GP and consequently disinhibit the c-TH or stimulate D2-postsynaptic receptors to in-directly inhibit GABAergic pallidothalamic neurons (40). In ad-dition, it is possible to directly target GABAergic-Aα-1 receptors distributed at the GP to suppress their activity (14, 34) as reported in some severely BI patients with zolpidem (41, 42). Finally, the findings provide further evidence of the mechanistic basis for arousal regulation effects of activation of the c-TH by electrical stimulation (13, 43) or indirectly via regularization of the globus pallidus interna (44–46), which has also been shown to be effective in increasing arousal states.
Limitations of Our Study. The heterogeneity in our group of patients in terms of lesion source, location, extension, and clin-ical expression may have hidden some relevant changes occur-ring at some important levels of the mesocircuit (i.e., AST), principally when comparisons were done between the two groups of patients. In addition, the preserved relative metabolism of SMST in the BI subjects may raise concerns about a bias of in-creased measured GP metabolism arising from the SMST due to a partial volume effect. Two observations mitigate this concern: first, we find that SMST was equally active in the pool of severe BI patients and NVs. Thus, a similar spill-in to the GP of NVs would have been expected as well but did not occur, with the exception that structural demarcations are clearer in the NV group. Second, after correction for partial volume effect (SI Text
andFig. S2) demonstrated that the significant difference in GP between patients and controls remained intact with no evidence of difference of SMST glucose metabolism. Limitations in our results may also arise from quantitative differences in acquisition due to the use of different PET cameras in NV and BI subjects, although prior studies indicate such effects are very small, if present at all (47, 48). We believe that the almost equal glucose metabolic pattern observed between our severe BI patients and controls over SMST and SM1, the reversal of the pattern of c-TH/GP, and the opposing patterns observed with respect to associative fron-toparietal cortices and VST-AST make it very unlikely that a systematic source of variation could account for our findings on a nonphysiological basis. Finally, our results may be biased by the introduction of a manual determination of the deep brain
structure target ROIs. However, manual anatomical determi-nations of these areas were carried out before the MRI-PET coregistration and were not reoriented thereafter based on the metabolic display on FDG-PET.
Materials and Methods
Participants. A prospective sample of 24 severely BI patients with varying etiologies, who fulfilled criteria for VS, MCS, or emerged from MCS, were assessed at Weill Cornell Medical College (Table 1). A total set of 32 PET studies individually treated were included in the final group analysis, and clinical examination was performed using CRS-R (49) (Table S2). A group of 10 NVs (4 females/6 males; 45.2± 14.3 y) recruited at the Faculty of Medicine of the University of Liège acted as the age-matched control group. All patients’ informed consent was obtained from their legally authorized representative and the medical team. All NVs gave informed consent under the University of Liege Ethics Committee. Ethical approval for the study was provided by the Weill Cornell Medical College Institutional Review Board. MRI Data Acquisition. A structural anatomical image was acquired on each severe BI patient on a 3-T GE MRI using a T1 3D fast spoiled gradient echo sequence (matrix size, 256× 256 × 120; voxel size, 0.93 × 0.93 × 1.2 mm; note: in the first four studies, parameters were 256× 256 × 156; voxel size, 0.93× 0.93 × 1.0 mm). NV data were acquired on a 3-T Siemens MRI using a T1 3D magnetization prepared rapid gradient echo sequence (matrix size, 256× 256 × 176; voxel size, 0.9 × 0.9 × 0.9 mm).
PET Data Acquisition. Each BI patient underwent injection of [18F]-labeled FDG (∼370 MBq). All PET studies but four were acquired on a GE PET-CT LS Dis-covery unit under a standard resting condition in 2D dynamic high-sensitivity emission mode, matrix size= 128 × 128 × 35, axial field of view = 25 cm, 4.25-mm slice thickness (studies 29–32 on a Siemens Biograph mCT scanner matrix size= 512 × 512 × 83). NV data were acquired after i.v. injection of ∼370 MBq FDG on a Siemens CTI 951 R16/31 scanner as described in ref. 50. Using PMOD v.3.309 (PMOD Technologies), SUV was computed, normal-ized by body weight, and scaled to the global mean signal (mn-UV) across the region defined by their skull-stripped T1-MRI (51), similarly to the first step involved during spatial covariance analysis of resting state metabolic images (52). Coregistration to each subject’s MRI was done using a rigid matching method using the PET to determine the transform (dissimilarity function: normalized mutual information with a trilinear interpolation method). Last, smoothing (6-mm full width at half maximum) was applied to the PET data. Overview of the Approach to [18F]FDG-PET ROI Definition. To assess the hy-potheses tested in this study, we required a detailed evaluation of metab-olism within the subcortical structures of the basal ganglia and thalamus. As standard atlas approaches are inadequate to capture the marked anatomical variation present across patients with severe BI (i.e., striatal and/or thalamic templates overlaid the lateral ventricles), we carried out several initial meth-odological steps using structural and metabolic data obtained from our NVs and from reanalysis of another previously published dataset of normal subjects from a study of D2-like receptor expression using [11C]raclopride [8 NVs; 26.0± 5.5 y; 8 females (53)]. For all normal subjects and patient analyses, striatal and tha-lamic ROIs were hand drawn onto 3D MRI (Fig. 1 andSI Text).
The thalamic ROIs in NV and BI subjects were first defined manually and then divided into a central and noncentral component (c-TH and non-c-TH,
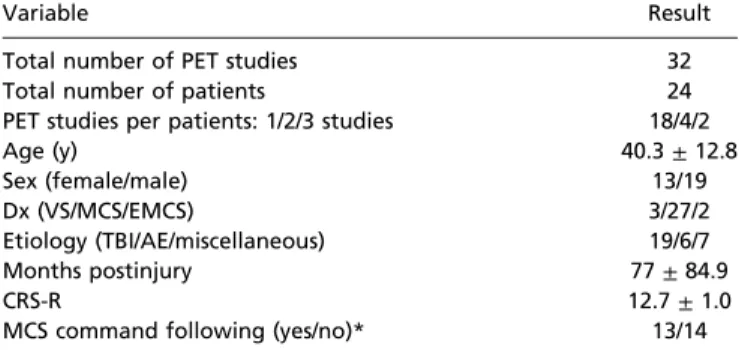
Table 1. Demographics
Variable Result
Total number of PET studies 32
Total number of patients 24
PET studies per patients: 1/2/3 studies 18/4/2
Age (y) 40.3± 12.8 Sex (female/male) 13/19 Dx (VS/MCS/EMCS) 3/27/2 Etiology (TBI/AE/miscellaneous) 19/6/7 Months postinjury 77± 84.9 CRS-R 12.7± 1.0
MCS command following (yes/no)* 13/14
*Not included: two emerged from MCS; one locked-in syndrome, and two cases with data not recorded.
NEUROSCI
respectively) based on the use of standard structural automatic segmentation results (SI TextandFig. S3) and the pattern of D2-like receptors expression obtained using [11C]raclopride to identify the boundaries of the c-TH.
To obtain cortical ROIs, previously defined cortical regions were extracted using a standard nonrigid normalization to the MNI space (54) and then applied, using an inverse transformation, to the individual NV or BI subjects’ natural space (SI TextandFig. S4).
Statistical Analysis. For the final analysis, the individual ROI mn-UV was used. All data were assessed for normality [Shapiro-Wilk test, W= 0.99 > critical value of W= 0.947 (5% significance level)]. For statistical analysis, factorial
ANOVA design with group (NV/BI), side, and ROI was used. A one-way ANOVA was then computed to compare differences between groups (combined for those without lateralization differences). Multiple regression analysis was performed using the c-TH as the dependent variable. Results were considered significant at P< 0.05. Bonferroni correction was applied for within-group multiple comparisons. Last, we created a post hoc ratio between the raw SUV (i.e., not normalized to the global mean) in the c-TH and GP and contrasted between groups using a one-way ANOVA. ACKNOWLEDGMENTS. This work was supported by National Institutes of Health-National Institute of Child Health and Human Development Grant 1R01-HD51912 and the James S. McDonnell Foundation.
1. Nakase-Richardson R, et al. (2012) Longitudinal outcome of patients with disordered consciousness in the NIDRR TBI Model Systems Programs. J Neurotrauma 29(1):59–65. 2. Luauté J, et al. (2010) Long-term outcomes of chronic minimally conscious and
veg-etative states. Neurology 75(3):246–252.
3. Levy DE, et al. (1987) Differences in cerebral blood flow and glucose utilization in vegetative versus locked-in patients. Ann Neurol 22(6):673–682.
4. Laureys S, Lemaire C, Maquet P, Phillips C, Franck G (1999) Cerebral metabolism during vegetative state and after recovery to consciousness. J Neurol Neurosurg Psychiatry 67(1):121.
5. Schiff ND, et al. (2002) Residual cerebral activity and behavioural fragments can re-main in the persistently vegetative brain. Brain 125(Pt 6):1210–1234.
6. Laureys S, Owen AM, Schiff ND (2004) Brain function in coma, vegetative state, and related disorders. Lancet Neurol 3(9):537–546.
7. Schiff ND (2005) Modeling the minimally conscious state: Measurements of brain function and therapeutic possibilities. Prog Brain Res 150:473–493.
8. Laureys S, Schiff ND (2012) Coma and consciousness: Paradigms (re)framed by neu-roimaging. Neuroimage 61(2):478–491.
9. Gusnard DA, Raichle ME, Raichle ME (2001) Searching for a baseline: Functional im-aging and the resting human brain. Nat Rev Neurosci 2(10):685–694.
10. Eidelberg D, et al. (1997) Metabolic correlates of pallidal neuronal activity in Par-kinson’s disease. Brain 120(Pt 8):1315–1324.
11. Fernández-Espejo D, et al. (2012) A role for the default mode network in the bases of disorders of consciousness. Ann Neurol 72(3):335–343.
12. Laureys S, et al. (1999) Impaired effective cortical connectivity in vegetative state: Preliminary investigation using PET. Neuroimage 9(4):377–382.
13. Schiff ND, et al. (2007) Behavioural improvements with thalamic stimulation after severe traumatic brain injury. Nature 448(7153):600–603.
14. Schiff ND (2010) Recovery of consciousness after brain injury: A mesocircuit hypoth-esis. Trends Neurosci 33(1):1–9.
15. Schiff ND (2012) Posterior medial corticothalamic connectivity and consciousness. Ann Neurol 72(3):305–306.
16. Bruno M-A, Vanhaudenhuyse A, Thibaut A, Moonen G, Laureys S (2011) From un-responsive wakefulness to minimally conscious PLUS and functional locked-in syn-dromes: Recent advances in our understanding of disorders of consciousness. J Neurol 258(7):1373–1384.
17. Grillner S, Hellgren J, Ménard A, Saitoh K, Wikström MA (2005) Mechanisms for se-lection of basic motor programs—Roles for the striatum and pallidum. Trends Neu-rosci 28(7):364–370.
18. Hornykiewicz O (1966) Dopamine (3-hydroxytyramine) and brain function. Pharmacol Rev 18(2):925–964.
19. Sano I, et al. (1959) Distribution of catechol compounds in human brain. Biochim Biophys Acta 32:586–587.
20. Rieck RW, Ansari MS, Whetsell WO, Jr., Deutch AY, Kessler RM (2004) Distribution of dopamine D2-like receptors in the human thalamus: Autoradiographic and PET studies. Neuropsychopharmacology 29(2):362–372.
21. Sánchez-González MA, García-Cabezas MA, Rico B, Cavada C (2005) The primate thalamus is a key target for brain dopamine. J Neurosci 25(26):6076–6083. 22. Freeman A, et al. (2001) Nigrostriatal collaterals to thalamus degenerate in
parkin-sonian animal models. Ann Neurol 50(3):321–329.
23. Volkow ND, et al. (2005) Activation of orbital and medial prefrontal cortex by methylphenidate in cocaine-addicted subjects but not in controls: Relevance to ad-diction. J Neurosci 25(15):3932–3939.
24. Laureys S, et al. (2000) Restoration of thalamocortical connectivity after recovery from persistent vegetative state. Lancet 355(9217):1790–1791.
25. García-Panach J, et al. (2011) A voxel-based analysis of FDG-PET in traumatic brain injury: regional metabolism and relationship between the thalamus and cortical areas. J Neurotrauma 28(9):1707–1717.
26. Wallis JD (2007) Orbitofrontal cortex and its contribution to decision-making. Annu Rev Neurosci 30:31–56.
27. Young L, et al. (2010) Damage to ventromedial prefrontal cortex impairs judgment of harmful intent. Neuron 65(6):845–851.
28. Sakai K (2008) Task set and prefrontal cortex. Annu Rev Neurosci 31:219–245.
29. Smith Y, Raju DV, Pare JF, Sidibe M (2004) The thalamostriatal system: A highly specific network of the basal ganglia circuitry. Trends Neurosci 27(9):520–527. 30. Galvan A, Smith Y (2011) The primate thalamostriatal systems: Anatomical
organi-zation, functional roles and possible involvement in Parkinson’s disease. Basal Ganglia 1(4):179–189.
31. Buckwalter JA, Parvizi J, Morecraft RJ, van Hoesen GW (2008) Thalamic projections to the posteromedial cortex in the macaque. J Comp Neurol 507(5):1709–1733. 32. Xie G, et al. (2011) Critical involvement of the thalamus and precuneus during
res-toration of consciousness with physostigmine in humans during propofol anaesthesia: A positron emission tomography study. Br J Anaesth 106(4):548–557.
33. Raichle ME, et al. (2001) A default mode of brain function. Proc Natl Acad Sci USA 98(2):676–682.
34. Brown EN, Lydic R, Schiff ND (2010) General anesthesia, sleep, and coma. N Engl J Med 363(27):2638–2650.
35. Balkin TJ, et al. (2002) The process of awakening: A PET study of regional brain ac-tivity patterns mediating the re-establishment of alertness and consciousness. Brain 125(Pt 10):2308–2319.
36. Demertzi A, Soddu A, Laureys S (2013) Consciousness supporting networks. Curr Opin Neurobiol 23(2):239–244.
37. Schiff ND (2012) Moving toward a generalizable application of central thalamic deep brain stimulation for support of forebrain arousal regulation in the severely injured brain. Ann N Y Acad Sci 1265:56–68.
38. Fridman EA, et al. (2009) Fast awakening from minimally conscious state with apo-morphine. Brain Inj 23(2):172–177.
39. Gerfen CR, Surmeier DJ (2011) Modulation of striatal projection systems by dopamine. Annu Rev Neurosci 34:441–466.
40. Mabrouk OS, Li Q, Song P, Kennedy RT (2011) Microdialysis and mass spectrometric monitoring of dopamine and enkephalins in the globus pallidus reveal reciprocal interactions that regulate movement. J Neurochem 118(1):24–33.
41. Brefel-Courbon C, et al. (2007) Clinical and imaging evidence of zolpidem effect in hypoxic encephalopathy. Ann Neurol 62(1):102–105.
42. Victor JD, Drover JD, Conte MM, Schiff ND (2011) Mean-field modeling of thalamo-cortical dynamics and a model-driven approach to EEG analysis. Proc Natl Acad Sci USA 108(Suppl 3):15631–15638.
43. Schiff ND (2008) Central thalamic contributions to arousal regulation and neurolog-ical disorders of consciousness. Ann N Y Acad Sci 1129:105–118.
44. Staunton H (2008) Arousal by stimulation of deep-brain nuclei. Nature 452(7183):E1, discussion E1–E2.
45. Moll CKE, et al. (2009) Waking up the brain: A case study of stimulation-induced wakeful unawareness during anaesthesia. Prog Brain Res 177:125–145.
46. Hassler R, Ore GD, Bricolo A, Dieckmann G, Dolce G (1969) EEG and clinical arousal induced by bilateral long-term stimulation of pallidal systems in traumatic vigil coma. Electroencephalogr Clin Neurophysiol 27(7):689–690.
47. Herholz K, et al. (2002) Discrimination between Alzheimer dementia and controls by automated analysis of multicenter FDG PET. Neuroimage 17(1):302–316.
48. Vogt BA, Vogt L, Laureys S (2006) Cytology and functionally correlated circuits of human posterior cingulate areas. Neuroimage 29(2):452–466.
49. Giacino JT, Kalmar K, Whyte J (2004) The JFK Coma Recovery Scale-Revised: Mea-surement characteristics and diagnostic utility. Arch Phys Med Rehabil 85(12):2020–2029. 50. Laureys S, et al. (2000) Auditory processing in the vegetative state. Brain 123(Pt 8):
1589–1601.
51. Fox AS, et al. (2012) Central amygdala nucleus (Ce) gene expression linked to in-creased trait-like Ce metabolism and anxious temperament in young primates. Proc Natl Acad Sci USA 109(44):18108–18113.
52. Eidelberg D (2009) Metabolic brain networks in neurodegenerative disorders: A functional imaging approach. Trends Neurosci 32(10):548–557.
53. Broft A, et al. (2012) Striatal dopamine in bulimia nervosa: A PET imaging study. Int J Eat Disord 45(5):648–656.
54. Tzourio-Mazoyer N, et al. (2002) Automated anatomical labeling of activations in SPM using a macroscopic anatomical parcellation of the MNI MRI single-subject brain. Neuroimage 15(1):273–289.