Decision making numerical tools for the rehabilitation of hydraulic
structures - Application to the Nisramont dam in Belgium
Erpicum S.1, Archambeau P. 1, Dewals B. 1,2, Detrembleur S. 1, Pirotton M. 11
Hydrodynamique Appliquée et Constructions Hydrauliques (HACH), Université de Liège (ULg)
Chemin des Chevreuils, 1 B52/3 B-4000 Liège, Belgique
2 Fonds National de la Recherche Scientifique fellow (FNRS)
Email: S.Erpicum@ulg.ac.be, Michel.Pirotton@ulg.ac.be 1. INTRODUCTION
In the global framework of climate change, hydraulic structures rehabilitation is an up-to-date subject requiring appropriate design and impact studies. In this scope, upgrading the release facilities of dams is an important point since any badly controlled rise of water level in the reservoir leads usually to both up and downstream consequences, often irreversible.
Suitable numerical models, coupled with contemporary computational possibilities, allow today engineers to forecast the complex situations induced on real structures by extreme events with increasing representativeness and accuracy. In this field, WOLF software, a process oriented free surface flows computation package completely set up by the HACH team, has proved its efficiency and reliability for years through numerous theoretical, experimental as well as on real structures applications.
In this paper, the rehabilitation study of the Nisramont dam (Belgium) is presented. Located on the Ourthe River, a few kilometers upstream of the town of La Roche, this 21-meter high dam came into service in 1958 and was, in a first time, dedicated to be used as a cofferdam during the construction of a downstream larger reservoir of 250 hm³. But this second dam was never built and Nisramont became a definitive reservoir of 3 hm³ assuming the drinking water supply of a large part of the population of the south of Belgium and producing hydro-electricity.
Due to its temporary primary tasks, the stilling basin downstream of the three 12.5 m large notches of the crest spillway has been designed for a short time use. Similarly, the 3 bottom outlets have never been equipped with valves and are thus unusable for the reservoir management.
In order to secure the structure and to make it comply with its definitive working objectives, while taking into account climate change observations, the Ministère wallon de l’Equipement et des Transport (MET) - Direction des barrages de l’Est (D. 241) entrusted the HACH with evaluating up to date critical flood discharges and with designing a system in accord with these new values for the rehabilitation of the bottom outlets and the evacuation of the floods to the downstream river.
This study has mainly been carried out using software of the WOLF package, successively applied to model really observed extreme events on the structure, to define new peak flow discharge and to design the stilling basin.
2. DAM FEATURES
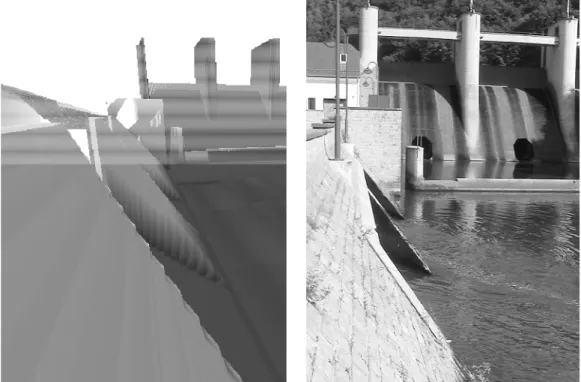
The Nisramont dam is a concrete gravity one (Figure 1), 21 m high with a crest 116 m long at level 276 m and a total volume of 22,000 m³. The construction phase finished in 1958.
The reservoir area is 47 ha for a storage volume of +/- 3 million m³. The catchment basin surface is 74,000 ha.
Figure 1: Nisramont concrete gravity dam
The dam is equipped with a surface spillway composed of three notches 12.5 m wide with a crest at level 272 m. The notches opening is controlled by downward sluice gates, the cables command mechanism of which is located in the 2.6 m wide piers between the notches. The maximum reservoir water level is 275 m for a theoretical discharge of 427 m³/s with the 3 notches totally opened.
Downstream of the notches, the spillway has a Creager type profile followed by a constant slope channel 5.3 m long being connected by an arched profile to the downstream +/- 0.33% constant slope stilling basin. This basin, 42.7 m wide, is at level 261.2 m upstream and ends with a profiled sill 1.2 m high located 32 m downstream of the spillway foot.
The bottom outlets are made of octagonal holes through the dam 3 m high and 3 m wide for a surface of 7.46 m². Each outlet is located in the axis of a surface spillway notch. On the reservoir side, the level of the outlets is 262.2 m. Their exit in the stilling basin, it is at level 261.2 m. Their length being 17.2 m, the conduits have a constant slope of 5.8 % to downstream. The three outlets are closed in their upstream section by a fixed plug made of concrete plates leaned against dam face. Therefore, it is at present not possible to manage the reservoir water level by using the bottom outlets. Moreover, the regular increase of the leaks of water through the plugs suggests proceeding to their rehabilitation by making them maneuverable.
3. THE WOLF PACKAGE 3.1. User interface
It is quite symptomatic to begin the WOLF description with a few words on its user interface. Indeed, it appears from a more than 15-year-old experience in the field of numerical hydraulics that the hydraulic engineer expertise in front of the always-growing amount of generated information can fully express only with a powerful and friendly user interface for pre- and post-processing operations, unique for the whole computation units of WOLF.
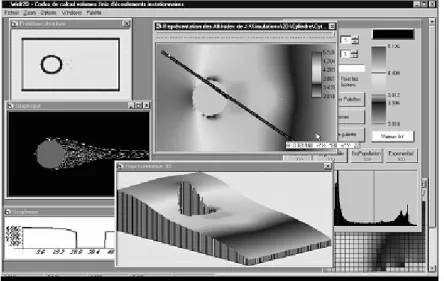
This interface is developed to both rapidly implement the input data related to a complex simulation (automatic mesh or boundary conditions generation) and visualize as well as animate (videos) in real-time the results in two or three dimensions for each modeling cell (water height, specific discharge, velocities, Froude number, total head, particles tracking…) (Figure 2).
Figure 2: Snapshot of a WOLF interface window personalized by the user
Entirely developed within the HACH, this interface appears today as a genuine Geographic Information System (management of geographically referred multi-layers maps), having all the advantages of the user-friendliness of the windows environment. The computations codes are in Fortran 95, which provides uncontested power and speed for scientific calculation.
WOLF offers a unique and comfortable working environment to all users by its simplified spreadsheet (allowing internal edition of all the matrices useful for the computation, the exchange of data with Excel, possibilities of smoothing and shading), the generation of zooms and cross-sections, the management of true colors gradation ranges (24 bits) or the mixing of raster and vector informations useful to visualize the results on background maps, …
3.2. General organization of the WOLF working environment
In this multi-purpose working interface are offered several modeling levels covering the whole of the chronology of free surface flows in the hydrologic cycle, from process oriented and spatially distributed hydrology to quasi-three-dimensional hydrodynamics on natural topography (wetting/drying cells), passing
by flood propagation in real natural compound channels river networks (main bed and floodplain potentially used). Each step can be equally managed with evaluating concomitant sediment transport effects or taking into account fluid layer aeration processes.
Simultaneous runs of the different computation codes are possible thanks to the set up of a unique method to solve the equations suitable to each phenomenon. This approach uses the basic fundamental idea that each free surface flow, at its own scale, presents the same nature of a transport phenomenon, as well as the same potentialities to develop the coexistence of continuous and discontinuous solutions areas, the limits of which limits (hydraulic jumps) vary in both time and space.
The capacity to solve these discontinuities by making the most of the only « weak solution » of the equations is fundamental whatever phenomena are considered (from a runoff motion on a few millimeters to the several meters high wave following a sudden dam break). Indeed, the precision of the whole solution depends on it and, consequently, the confidence that can be associated with the final interpretation of the practical simulations realized with WOLF.
3.3. WOLFHydro
The general aim of the WOLF software is to give hydraulic engineers and decision makers an integrated computation package for the process oriented numerical simulation of both genesis and propagation of all free surface water flows. So, the first step consists in looking at flow emergence from the rain, from its distribution between the different terms of hydrologic balance to its transfer to river network. The process oriented hydrologic solver WOLFHydro has been built in this scope.
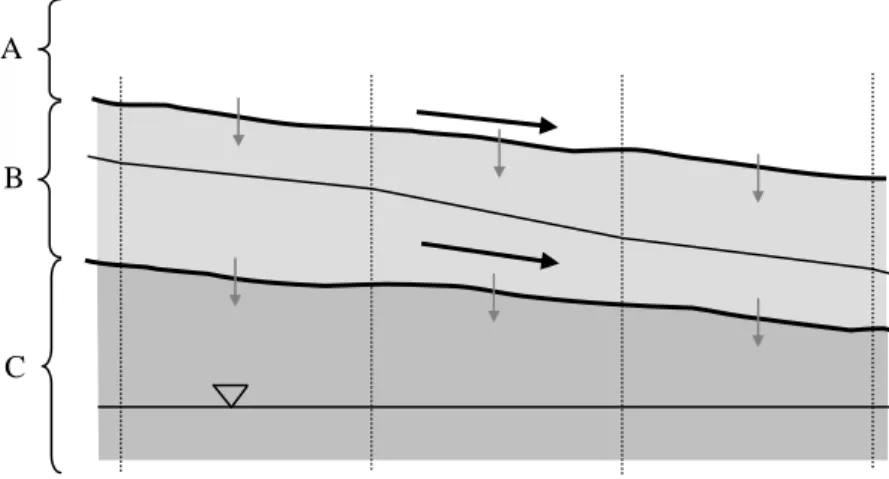
The present version of the program solves the conservative form of a variant of the 2D diffusive wave model equations by a finite volume technique, taking into account three specific vertically distributed flow layers (Figure 3: surface runoff (A), hypodermic flow (B) and deep infiltration (C)). Instantaneous vertical exchanges between the layers are also computed.
Figure 3: Three flow layers computed in WOLFHydro
Different roughness laws (Manning, Darcy-Weissbach, Bathurst,…) fitted to the calculation of flow on macro-roughness are available.
C B A
The solver can take into account spatially and temporally variable rains on a real catchment and a complete 1D river network propagation model (WOLF1D) computes inflow discharge course into the rivers down to catchment exit.
Unsteady exchange laws compute naturally the soil infiltration capacity recovering after the rain. This allows the simulation of long time periods without stopping the program.
The process oriented approach allows both to simplify the parameters fitting stages to better known variation intervals and, above all, to use the program as a true management tool by accounting for all changes in management policies through the value of the relevant parameters.
3.4. WOLF1D
Historically, the floods of the year 1998 in Belgium and the recent ones all over Europe proved again that rivers, as a part of nature, have to be mastered not by force but by understanding. In this scope, WOLF1D, a quasi-two-dimensional model, has first been developed in order to model flood waves propagation in natural river networks. It has been validated using other numerical existing models, experimental results as well as field measurements of the transient behavior of natural river flows [Pirotton, 1994].
WOLF1D has then been extensively used as a management tool for analyzing extreme natural events. Now, since more efficient and accurate 2D or quasi-3D solvers, such as WOLF2D, are available for flood case studies even on large river sections, the one dimensional model is preferentially used for catchment or region scale modeling of river networks, dedicated to applications such as flood propagation, pollutant transport as well as the evaluation of the global water quality and of environmental effects. At last, it is also used to give suitable boundary conditions to other models by coupling the approaches.
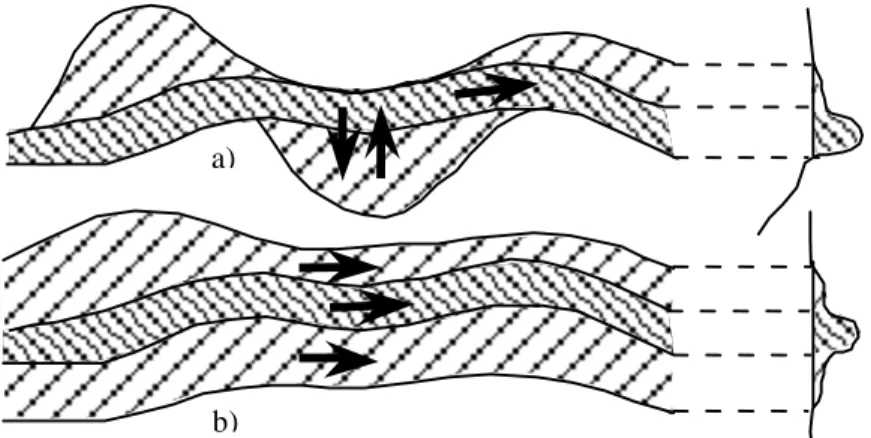
From a numerical point of view, as common methods based on conveyance considerations lead to substantial errors, WOLF1D takes explicitly into account the flows in compound channels, in both situations of large floodplains with totally developed streams (Figure 4 b)) or lateral storage areas where water movements have the same order of magnitude in both directions (Figure 4 a)).
Figure 4: Interactions between main riverbed and floodplain b)
The coexistence of several flow rates with shocks and bores in ramified nets of variable cross section arms requires to deal with suitable shock capturing methods to solve the conservative form of the 1D Saint-Venant equations.
The spatial discretization of the equations is performed by a widely used finite volume method. Flux treatment is based on an original flux-vector splitting technique developed for WOLF. Efficiency, simplicity and low computational cost are the main advantages of this scheme.
Variable reconstruction can be selected to gain first or second order accuracy on regular grids. However, it is well known that such second order finite volume schemes, although very accurate in smooth regions, can cause unphysical oscillations near the discontinuities. The flux reconstructions are therefore adequately limited to prevent such spurious effects.
Besides, an explicit Runge-Kutta scheme or an implicit algorithm is applied to solve the ordinary differential equation operator along time, and an original treatment of the confluences, based on Lagrange multipliers, allow the modeling in a single way of large river networks.
3.5. WOLF2D
The equations governing the movement of a liquid are based on the mass and momentum balances. After integration over the water height, and using the not very restrictive assumption that velocities along the integration direction are weak compared with the ones in the perpendicular plane, the so called “shallow water equations” are obtained. Written under a conservative form, their adapted numerical resolution in the solver WOLF2D gives the solution to all free surface hydrodynamic problems with a preferential flow plane, the later being horizontal or not [Pirotton, 1994], and correctly captures the discontinuities and the changes in flow regime.
In order to correctly represent the hydrodynamics of the flows on spillways among others, the particular expression of the shallow water equations written in a curvilinear coordinates system has been implemented within the solver. This approach, widely validated in the HACH, is the only one allowing a physically correct and absolutely general modeling of the specific free surface flow conditions on curved geometry of outlet structures.
The combination of the different formulations using the multiblock calculation possibilities of WOLF2D leads to a powerful original model for the simulation in a unified way of the flow on the hydraulic structures, from the upstream reservoir to the downstream natural river.
Like the 1D solver, WOLF2D solves the equations by a finite volume method, using an original flux-vector splitting technique fitted to free surface flows [Mouzelard, 2002]. In order to adequately compute friction terms on an irregular topography, an original evaluation of the friction areas is realized. Moreover, friction on side edges is taken into account anywhere a boundary between dry and wet cells is detected. The algorithm is designed to deal automatically with any moving boundary. It incorporates an original method to handle covered and uncovered (wet and dry) cells. An automatic adaptable grid extension technique achieves a drastic reduction in computation time, by restricting the simulation domain to the wet cells.
Thanks to an efficient iterative resolution of the continuity equation at each time step before any evaluation of momentum balances, the conservation of the flow hydrodynamic properties is ensured in the whole simulation domain.
WOLF2D includes an efficient mesh generator and deals with multiblock structured grids. These features increase the size of potential problems to be solved and allow mesh refinement close to interesting areas without leading to prohibitive CPU times.
3.6. WOLFAG
WOLF AG, an optimization software based on the Genetics Algorithms method, has been developed to provide a robust and reliable parameters fitting tool useable with all the different components of WOLF.
Genetic Algorithms are exploration algorithms imitating the natural selection and genetic mechanisms [Goldberg, 1989]. At each step, they improve a set of coded representations of solutions to the problem to be solved by operations of selection, crossover of information and mutation. These operators act in such a way that the best individuals of the population during one iteration are preferentially used to build the new one. Thus, a kind of natural selection occurs.
It is obvious that Genetic Algorithms are located between classical optimization methods, applied locally in the search space of solutions, and purely random or systematic optimization methods, that test all possible solutions. Genetic algorithms constitute a kind of intelligent and pseudo-random exploration of the search space of solutions. Thus, they can be used to study discontinuous and disjointed functions and they always converge towards the absolute optimum.
Able to interact with each solver of WOLF, the genetic software allows, at user’s choice, to proceed to physical parameters fitting by inverse method or to realize management policies improvement on the basis of defined instructions. 4. STUDY AREA NUMERICAL MODEL
Input information at the basis of a process oriented free surface hydraulic modelization is an accurate Digital Elevation Model (DEM) of the whole study area, the topography gradients being the main flow engine as well as the main responsible of the local disturbances. It is also the location of the global energy dissipation. A great attention has so been paid to the realization of the digital elevation model of the Nisramont catchment, the reservoir, the structure itself and the downstream river for a total area and a discretization level in accordance with considered phenomena.
The data used to built the DEM came from different sources:
• topographic maps from the Institut Géographique National (IGN) for the whole study area,
• topographic drawings of the reservoir before filling operation, • dam construction drawings,
• downstream river cross sections through the main bed,
• a global DEM of the dry areas from an airborne laser acquisition stage with an accuracy of 1 point per square meter and 15 cm in elevation,
• several pictures of the structure from its building phase to present. All these sources, when digitalized and positioned in the same geographic coordinates system (Belgian system Lambert 72), made a strong basis for the generation of a DEM distributed on a regular grid to be directly used in the solvers of the WOLF package.
Three different distributed DEM have been built. A model of the catchment with 100 m meshes, a model of the reservoir and the dam with meshes of 1 m and a more accurate model of the dam, release structures, stilling basin and downstream river discretized with square meshes 25 cm in side (Figure 5). A two-dimension DEM of the Ourthe River downstream of the structure, made up of cross sections spaced out of 25 m and covering a 600 long section, completed this set of three-dimensional representations for specific calculations.
Figure 5: 25 cm digital elevation model of the dam and near downstream
The different models are bordered in the downstream river at the level of a gauging station from the SETHY1, the rating curve of which supplies reliable boundary condition values. The lateral extension of the DEMs has been determined in such a way that the flow limits corresponds to a real topographic upward slope for all tested discharges, both in the reservoir as well as in the River Ourthe downstream.
5. HYDROLOGIC STUDY
The first step of the study consisted in a hydrologic evaluation carried out on two complementary stages: firstly a statistical analysis of the discharge data in the reservoir from the structure opening to the year 2001, secondly a numerical
1
Service d’Etudes Hydrologiques (Hydrologic studies division) - Direction Générale des Voies Hydrauliques - Ministère wallon de l’Equipement et des Transports
simulation of hydrologic flow on the catchment using the solver WOLFHydro and starting from rain data given by Intensity - Duration - Frequency curves (IDF curves) of the nearest meteorological station.
5.1. Statistical analysis
Basic informations for flood frequency and intensity analysis are made up of sets of discharge measurements. From a set of values, the statistical distribution of the variable adjusted to a known theoretical probability law is studied. It allows the interpretation and the calculation of the flow rates with a given occurrence probability.
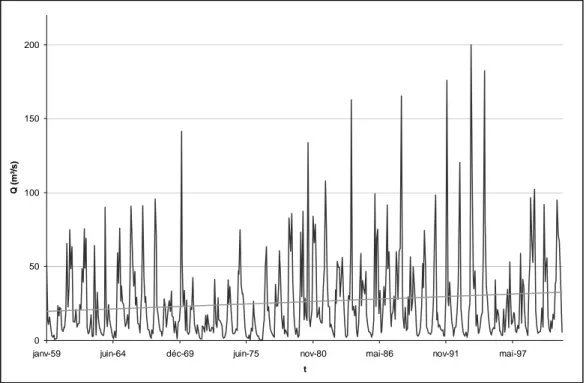
In the scope of this study, monthly maximal inflows on a day in the reservoir for the period of time between the dam opening in 1959 to the year 2001 were available.
Their visual analysis on the basis of a summary drawing (Figure 6) suggests an increase in discharge since the structure opening, the importance of which is not only the result of climate change. The successive modifications in measurement techniques and devices should also explain a part of the observed inflow variations. Nevertheless, these data cover the longest possible measurement period in the area and were the only ones available. They were hence used to compute the best maximum inflows potentially entering the reservoir.
Figure 6: Monthly maximum inflows on a day in the reservoir during the measurements period
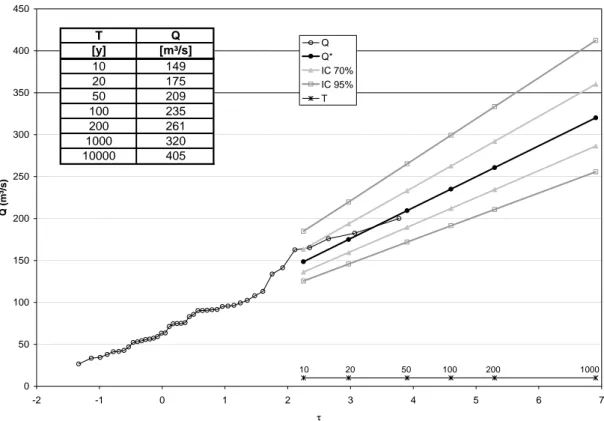
The Gumbel probability distribution has been applied to the 43 available annual maximum inflow values and gives the results of Figure 7 as a function of the reduced variable τ.
1000-year flood was evaluated to 320 m³/s, with a 70% (IC 70%) confidence interval between 286 and 360 m³/s, while the 95% (IC 95%)
0 50 100 150 200
janv-59 juin-64 déc-69 juin-75 nov-80 mai-86 nov-91 mai-97
t
Q (m
³/s
confidence interval forecast values are situated between 256 and 412 m³/s. The 10,000-year flood was estimated to 405 m³/s.
Figure 7: Results of the application of the Gumbel theory to extreme floods prediction
5.2. Deterministic modeling
On the other hand, a numerical deterministic modeling of the flows on the catchment has been carried out with help of the hydrologic solver WOLFHydro.
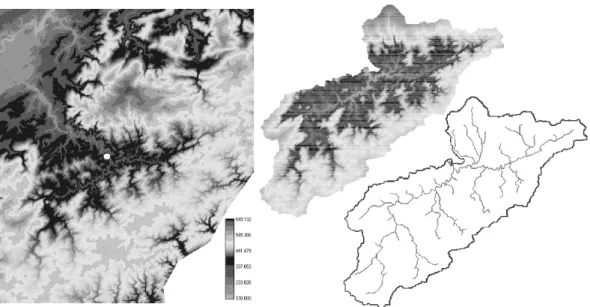
The digital elevation model of the Belgian Institut Géographique National (IGN) has been used to generate the topographic data needed by the solver. They consist in topography of the whole of the area including the dam catchment, distributed on a regular grid with square meshes of 100 m in side.
From the row data, a first automatic elevation correction stage is realized in order to remove depressions as well as flat areas to get a continuous runoff path for each catchment modeling mesh. A second stage consists in the computation of runoff conveyance paths (Figure 8). This operation is iterative as the dynamic of the thin layer diffuse runoff and the 1D flow in the river network are different. From the choice of an exit on the conveyances map, the delimitation of the catchment limits and of the associated river network is automatic. This leads finally to a model including 74,418 calculation meshes, on which hydrologic runoff and subsequent inflows propagation in the river network are computed from rain data on the catchment.
0 50 100 150 200 250 300 350 400 450 -2 -1 0 1 2 3 4 5 6 7 τ Q (m³/s) Q Q* IC 70% IC 95% T 10 20 50 100 200 1000 T Q [y] [m³/s] 10 149 20 175 50 209 100 235 200 261 1000 320 10000 405
Figure 8: Row DEM of the area (left), bounded catchment of the dam and conveyances network (right)
In order to assess the order of magnitude of the statistical flood discharge, an extreme hydrologic event has been generated using rain data and field conditions to produce statistically significant maximum inflow. The soil properties have so been considered as uniform and constant along time, with characteristics maximizing surface runoff. The rain came from IDF curves of the Belgian Institut Royal Météorologique (IRM) and has been uniformly applied to the whole catchment.
These simplifications are not restrictive towards the solver capacities. It can without any problem take into account real soil occupation maps, time and space variable rains and changing soil capacities. The simplifications have been only enacted in a view of security and to give hard line results.
Two rains of different duration, with a 200-year return period, have been used: a 60 minutes one and a 15 minutes one. Their maximum computed discharge at the reservoir entrance corroborates the previous results with a peak at 275 m³/s in the most unfavorable situation, in comparison with 261 m³/s for the statistical study.
5.3. Conclusions
Regarding the spillway, its maximum capacity equals the new 10,000-year flood and is thus acceptable.
On the other hand, the locking of a gate gives a security up to only a 200-year flood. This involves equipping the bottom outlets to recover a part of the release capacity in this case and therefore a sufficient security for the structure.
The design flood finally taken into account for the stilling basin rehabilitation is the 1000-year one increased in the 95% confidence interval up to 375 m³/s.
6. HYDRODYNAMIC STUDY 6.1. Flow conditions in the reservoir
Even if the multiblock computation capacities of the solver WOLF2D allow to compute in a single way geometrically important areas with strongly varied topography, a first set of simulations regarding only the reservoir have been carried out in order to specify inflow conditions upstream of the dam. These results have been used in a second time as upstream boundary conditions for the all the detailed simulations of the release structures hydraulic behavior.
This approach in two stages is fully justified by savings of CPU time it provides by reducing the number of calculation meshes or by a decrease of the unsteady waves propagation length in the numerical model.
6.2. Model validation: the flood of January 3rd , 2003
In order to validate the proposed approach for the specific case of this study as well as to fit roughness coefficient values of the different soils, i.e. the only unknown of the numerical model, the solver has been applied to the simulation of a real flood event, which occurred at the beginning of year 2003.
The observed peak flood for this event was 240 m³/s, i.e. a 100-year flood. For this discharge, the 3 gates of the spillway were partially opened. However, this peak appeared during the night, and so no picture of the flow is available for comparison. On the other hand, during the day of January 3rd, just before noon, a 175 m³ /s discharge on the spillway has been reached. The flows on the spillway have been photographed. This discharge has thus been used to validate the numerical model.
The simulation domain has been cut into 4 blocks using calculation meshes from 25 cm to 1 m in size (Figure 9). A block has been defined upstream of the dam (A), another on the spillway (B), a third one covered the stilling basin area (C) and the last one represented the natural river down to the downstream boundary condition (D). Classical shallow water equations, i.e. the ones written in Cartesian coordinates, have been solved everywhere except in the second block were the expression in curvilinear coordinates has been used. In blocks B, C and D, the calculation unknowns are the water depth and the specific discharge in the mean flow plane while in block A the water depth and the flow velocities have been chosen as main unknowns in order to correctly compute the total head upstream of the structure.
The only boundary conditions imposed to the model were the horizontal discharge distribution in the reservoir upstream of the dam and the free surface elevation in the river 600 m downstream. Here clearly appears the originality and the benefits of a unified modeling from upstream to downstream, in particular for the objective computation of the head-discharge curve of the spillway, provided that the flow remains continuous through the release structure.
Figure 9: Simulation domain topography and definition of the different computation blocks
Several simulations have been carried out, testing different values of the structures roughness coefficients in their physically representative interval of variation. The extreme sensitivity of the results, above all regarding the hydraulic jump location in the stilling basin, rapidly appeared. In addition, it is impossible to correctly compute the hydraulic jump location in the stilling basin without using the curvilinear coordinates expression of the shallow water equations.
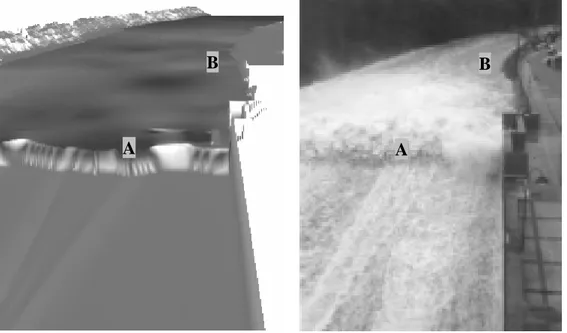
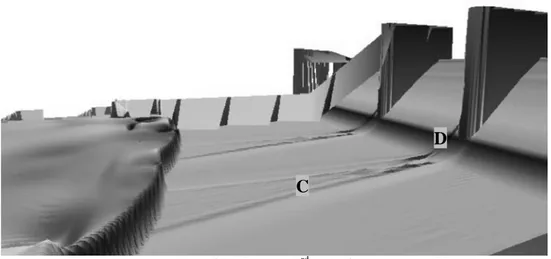
Strickler roughness coefficient value for concrete areas has been chosen equal to 70, and the one of the downstream natural bed of the Ourthe River to 27. These values lead to the results with best agreement regarding the hydraulic jump location in the stilling basin (Figure 10 - A), water heights in the downstream river, in particular along banks (Figure 10 - B), the location and geometry of the cross-waves, and the dry area at the piers foot (Figure 11 - C and D).
Figure 10: Simulation of the January 3rd 2003 flood event - 175 m³/s - Solver validation
A
B
C
D
A
B
A
B
Figure 11: Simulation of the January 3rd 2003 flood event - 175 m³/s
The simulation in the same conditions of the 240 m³/s peak flow confirms the under design of the stilling basin as the hydraulic jump goes out of it. These results corroborate the observations by eyewitnesses in situ during the night between January 2nd and 3rd 2003.
6.3. Outlets rehabilitation
One of the goals of this study is to set up a system allowing the use of the three conduits under the dam as bottom outlets without compromising the actual behavior of the other release facilities. Because of the security criteria to respect regarding an accidental reservoir emptying, such a system means at least to include:
• a gate for regulation of the released discharge,
• a security gate to quickly and securely close the outlet in case of accident,
• an upstream stoplog to put out of water the system in case of maintenance and reparation operations,
none of these added elements negatively interacting with the working of the existing release facilities.
System for rehabilitation
Two solutions have been successively considered to equip the bottom outlets. The first one consisted in equipping each conduit separately, the second one in building a water intake tower in the reservoir including the regulation and closing system and in feeding each conduit through a pipe network.
Hydrodynamic impacts in the reservoir and on the spillway have been studied for both cases by numerical simulations of different working situations and different discharges.
The first planned solution, naturally devised when analyzing the existing structure, consists in placing a butterfly gate in each conduit to rehabilitate them. This gate should have a diameter small enough to be placed in the existing conduits, in order not to induce too hard structural changes within the dam body.
To put the system out of water, an upstream moveable stoplog could be put back to the place of the actual fixed plugs by using at most their support
C
structures on the dam upstream face. In this case, devices to move these stoplogs should be set up. They could consist in two columns in the axis of the stoplogs lateral supports. Cables or chains for the stoplogs operation could be placed in these columns with operation winches in a footbridge leaned at the top of the dam piers.
The advantage of this solution lies in its simplicity. It limits the structures to be built while enabling to freely choose the conduits to equip and the ones to definitively block. Moreover, it uses the most the existing system for fixed plugs.
On the other hand, it involves to place in front of each spillway notch two piers that could modify the spillway functioning. Moreover, the water intake through the bottom outlets will be in the notches axis and can thus also strongly affect discharge repartition on the surface spillway.
In order to bring partial answers to these assumptions, 2D numerical simulations have been carried out. They showed that the piers and discharge taking influence on the surface spillway behavior were very small. For example, a precise analysis of the flow fields approaching the spillway (Figure 12) confirms the very local influence of the piers and the fact that they don’t significantly increase head losses close to the release structures.
Figure 12: Computed specific discharge fields (m²/s) near and on the spillway
It is the same with the discharge repartition between the notches. It is still acceptable, with an additional benefic effect of the piers in front of the notch on right bank as they make the flow on the notch width more uniform (Figure 13 - curve A) in comparison with the situation without piers (Figure 13 - curve B).
Figure 13: Specific discharge distribution (m²/s) on the spillway width
When the bottom outlets are opened, the numerical simulations allow highlighting the same conclusions. In this case, the infiltration discharge through the conduits was proportional to the total instantaneous head on the outlets influence area, and by taking into account correction terms in the momentum equations, flows hydrodynamic properties in the modeling plane could be conserved.
The second solution considered to rehabilitate the bottom conduits was to feed the outlets through a submerged pipes network from an intake tower in the reservoir where a gate and the stoplogs would be located. This solution, more expensive in terms of new structures, has the advantage to locate the influence area of the water intake further from the spillway. Moreover, the closing and regulation operations of the outlets could be made by a single moveable upstream device, what represents an economy to compare to a more complex civil engineering structure.
Although the numerical simulations carried out to validate this second solution from an hydrodynamic point of view didn’t show any substantial flaw, except a tendency to create vortices around the intake tower in the flow fields by interacting with the reservoir left bank, it’s the cost and realization difficulties of this second solution in comparison with the first solution has lead it to be forsaken.
Release capacity
After calculation of the potentially evacuated discharges and corresponding times to empty the reservoir, the diameter of the gates to be placed in the conduits has been chosen by the Administration by also relying on the Ourthe River classified discharge curve at the level of the dam. The chosen system is made up for each outlet of a water intake, protected by a grille followed by a convergent and two successive butterfly gates at the minimum conduits level,
9.4 9.5 9.6 9.7 9.8 9.9 10 10.1 10.2 -2.5 7.5 17.5 27.5 37.5 x (m) q (m ²/ s )
A
B
and discharging downstream of the dam. This system is designed to allow the release of up to more or less 50 m³/s for a water level in the reservoir at 275 m.
The combined use of the three bottom outlets allows a reservoir emptying in a period of more or less 16 hours. It also permits, in case of an exceptional situation, to offset a third of the maximum release capacity of a spillway notch. 6.4. Stilling basin design
It is important to underline the particular geometry of the stilling basin in its current configuration. A sill higher than the riverbed, followed by a concrete slab, characterizes it at its downstream extremity. “Classical” stilling basins have instead an extremity step to compensate for the topography level difference between the buried apron and the natural riverbed, step that artificially causes an important increase of the downstream water level in comparison with the supercritical flow coming from the spillway. This induces the expected regime change to dissipate excess energy of the flood and imposes to the flow a higher downstream water height, which acts in the same way. In the current configuration, the sill can be felt by the flow as a limited topography not acting enough as an incentive towards a regime change.
On the other hand, the stilling basin is under designed for the floods expected on the spillway with a relatively important recurrence, as it has been shown by calculation in this study and in the reality by the events of these last years. In the scope of the bottom outlets rehabilitation, the problems of dissipation capacities of the stilling basin become worse by the potential increase of discharges through the dam management facilities.
It is however obvious that the design flood of the stilling basin is directly dependent on the river discharges, and not on the cumulated release capacities of the structure (spillway and bottom outlets).
Within this framework, after analysis and modeling of the current structure behavior, a first design of a stilling basin with a flat bottom has been realized as an extreme situation before the calculation of the required dimensions for an efficient stretching and deepening of the present basin. This latter solution seems indeed the less expensive and easier one to realize.
The two stages listed above have in a first time been approached in one-dimension using the solver WOLF1D, prior to a final validation by two-dimensional simulations using WOLF2D.
The final solution meets all the constraints, linked to the stilling basin operations as well as to the hydroelectric power station ones, rejecting its water downstream of the dam. It consists in removing the sill, stretching out the basin of 30 m towards downstream and deepening this new section of 1 m. A step 50 cm high and 3 m long ends the system (Figure 14).
Figure 14: 3D view of the final geometry of the stilling basin
The results of the final simulation of a 1000-year flood release confirm the good behavior of the whole structure, discharging only through the surface spillway (Figure 15) or using a combination of this one with the bottom outlets.
Figure 15: Simulation of the design flood with the stilling basin final geometry - Free surface elevations (m)
7. CONCLUSIONS
Recent advances in the set up of efficient and robust numerical models coupled to the current computers calculation capacities allow today hydraulic engineers to tackle more and more practical problems in a reliable and accurate way.
The WOLF software package of the HACH, presented in this paper, has in this scope been successfully applied to the rehabilitation studies of the Belgian Nisramont dam.
After an update of the extreme inflow values entering the reservoir by a statistical method completed with a deterministic calculation, the proposed two-dimensions numerical approach has been validated through the simulation of two flood cases really observed on the structure. The hydrodynamic impact on the behavior of the surface spillway of the different rehabilitation solutions of the bottom outlets has then been assessed. In the same scope, the real operation mode of the present stilling basin has been analyzed before optimizing a new design in accordance with the up to date working constraints of the complete structure.
The solution finally accepted to rehabilitate the bottom outlets, simple and less expensive in terms of new structures, consists in equipping each conduit separately with two butterfly gates and a stoplog sliding on the upstream face of the dam. The release of water is located downstream in the stilling basin without inducing important risks in the Ourthe River in case of reservoir emptying. The working of the bottom outlets doesn’t disrupt the flows on the surface spillway nor the stilling basin or hydropower station operation. The same observations remain valid for the new piers in the notches axis necessary to operate the stoplogs.
Regarding the stilling basin, the chosen solution consists in a simplification of the current structure by removing the end sill and by lengthening and deepening the apron towards downstream. A step at the exit realizes in a security way the end of the structure. This geometry has been numerically tested for a lot of flood discharges up to the 1000-year one as well as for a dual operation of surface spillway and bottom outlets.
By completely setting up all the models described in this paper and by having at its disposal a large test laboratory to validate the original mathematical formulations approaches and the resolution schemes on physical applications, the HACH is able to propose coupled approaches for all hydraulic design studies. They consist in numerical simulations at a large scale of the structures with sophisticated but perfectly mastered solvers, completed if needed by physical models more limited and thus more detailed, with as a global goal to optimize the study periods as well as realization means while guaranteeing maximal reliability and accuracy of the results.
8. REFERENCES
[1] Goldberg, D.E., Genetics Algorithms in Search, Optimization and Machine Learning. 1989: Addison-Wesley.
[2] Mouzelard, T., Contribution à la modélisation des écoulements quasi tridimensionnels instationnaires à surface libre. 2002, Université de Liège. Ph. D. Thesis [3] Pirotton, M., Modélisation des discontinuités en écoulement instationnaire à surface libre. Du ruissellement hydrologique en fine lame à la propagation d'ondes consécutives aux ruptures de barrages. 1994, Université de Liège. Ph. D. Thesis