Université de Montréal
Mechanism and Prediction of Post-Operative
Atrial Fibrillation Based on Atrial
Electrograms
par
Feng Xiong
Institut de génie biomédical Département de physiologie
Faculté de Médecine
Thèse présentée à la Faculté des études supérieures en vue de l’obtention du grade de Philosophiae Doctor (Ph.D.)
en génie biomédical
Mars 2012
Université de Montréal
Faculté des études supérieures
Cette thèse intitulée:
Mechanism and Prediction of Post-Operative Atrial Fibrillation Based on
Atrial Electrograms
Présentée par : Feng Xiong
A été évaluée par un jury composé des personnes suivantes :
Dr Pierre Savard, président-rapporteur Dr Alain Vinet, directeur de recherche Dr Damien Garcia, membre du jury MD Paul Dorian, examinateur externe
Abstract
Atrial fibrillation (AF) is an abnormal heart rhythm (cardiac arrhythmia). In AF, the atrial contraction is rapid and irregular, and the filling of the ventricles becomes incomplete, leading to reduce cardiac output. Atrial fibrillation may result in symptoms of palpitations, fainting, chest pain, or even heart failure. AF is an also an important risk factor for stroke. Coronary artery bypass graft surgery (CABG) is a surgical procedure to restore the perfusion of the cardiac tissue in case of severe coronary heart disease. 10% to 65% of patients who never had a history of AF develop AF on the second or third post CABG surgery day. The occurrence of postoperative AF is associated with worse morbidity and longer and more expensive intensive-care hospitalization. The fundamental mechanism responsible of AF, especially for post-surgery patients, is not well understood. Identification of patients at high risk of AF after CABG would be helpful in prevention of postoperative AF. The present project is based on the analysis of cardiac electrograms recorded in patients after CABG surgery. The first aim of the research is to investigate whether the recordings display typical changes prior to the onset of AF. A second aim is to identify predictors that can discriminate the patients that will develop AF.
Recordings were made by the team of Dr. Pierre Pagé on 137 patients treated with CABG surgery. Three unipolar electrodes were sutured on the epicardium of the atria to record continuously during the first 4 post-surgery days. As a first stage of the research, an automatic and unsupervised algorithm was developed to detect and distinguish atrial and ventricular activations on each channel, and join together the activation of the different channels belonging to the same cardiac event. The algorithm was developed and optimized on a training set, and its performance assessed on a test set. Validation software was developed to prepare these two sets and to correct the detections over all recordings that were later used in the analyses. It was complemented with tools to detect, label and validate normal sinus beats, atrial and ventricular premature activations (PAA, PVC) as well as episodes of arrhythmia.
Pre-CABG clinical data were then analyzed to establish the preoperative risk of AF. Age, serum creatinine and prior myocardial infarct were found to be the most important predictors. While the preoperative risk score could to a certain extent predict who will develop AF, it was not correlated with the post-operative time of AF onset.
Then the set of AF patients was analyzed, considering the last two hours before the onset of the first AF lasting for more than 10 minutes. This prolonged AF was found to be usually triggered by a premature atrial PAA most often originating from the left atrium. However, along the two pre-AF hours, the distribution of PAA and of the fraction of these coming from the left atrium was wide and inhomogeneous among the patients. PAA rate, duration of transient atrial arrhythmia, sinus heart rate, and low frequency portion of heart rate variability (LF portion) showed significant changes in last hour before the onset of AF. Comparing all other PAA, the triggering PAA were characterized by their prematurity, the small value of the maximum derivative of the electrogram nearest to the site of origin, as well as the presence of transient arrhythmia and increase LF portion of the sinus heart rate variation prior to the onset of the arrhythmia.
The final step was to compare AF and Non-AF patients to find predictors to discriminate the two groups. Five types of logistic regression models were compared, achieving similar sensitivity, specificity, and ROC curve area, but very low prediction accuracy for Non-AF patients. A weighted moving average method was proposed to design to improve the accuracy for Non-AF patient. Two models were favoured, selected on the criteria of robustness, accuracy, and practicability. Around 70% Non-AF patients were correctly classified, and around 75% of AF patients in the last hour before AF. The PAA rate, the fraction of PAA initiated in the left atrium, pNN50, the atrio-ventricular conduction time, and the correlation between the latter and the heart rhythm were common predictors of these two models.
Key words:
Coronary artery bypass graft surgery, Postoperative Atrial Fibrillation, Atrial Electrogram, statistical analysis, predictor.
Résumé
La fibrillation auriculaire (FA) est une arythmie touchant les oreillettes. En FA, la contraction auriculaire est rapide et irrégulière. Le remplissage des ventricules devient incomplet, ce qui réduit le débit cardiaque. La FA peut entraîner des palpitations, des évanouissements, des douleurs thoraciques ou l’insuffisance cardiaque. Elle augmente aussi le risque d'accident vasculaire. Le pontage coronarien est une intervention chirurgicale réalisée pour restaurer le flux sanguin dans les cas de maladie coronarienne sévère. 10% à 65% des patients qui n'ont jamais subi de FA, en sont victime le plus souvent lors du deuxième ou troisième jour postopératoire. La FA est particulièrement fréquente après une chirurgie de la valve mitrale, survenant alors dans environ 64% des patients. L'apparition de la FA postopératoire est associée à une augmentation de la morbidité, de la durée et des coûts d'hospitalisation. Les mécanismes responsables de la FA postopératoire ne sont pas bien compris. L'identification des patients à haut risque de FA après un pontage coronarien serait utile pour sa prévention. Le présent projet est basé sur l'analyse d’électrogrammes cardiaques enregistrées chez les patients après pontage un aorte-coronaire. Le premier objectif de la recherche est d'étudier si les enregistrements affichent des changements typiques avant l'apparition de la FA. Le deuxième objectif est d'identifier des facteurs prédictifs permettant d’identifier les patients qui vont développer une FA.
Les enregistrements ont été réalisés par l'équipe du Dr Pierre Pagé sur 137 patients traités par pontage coronarien. Trois électrodes unipolaires ont été suturées sur l'épicarde des oreillettes pour enregistrer en continu pendant les 4 premiers jours postopératoires. La première tâche était de développer un algorithme pour détecter et distinguer les activations auriculaires et ventriculaires sur chaque canal, et pour combiner les activations des trois canaux appartenant à un même événement cardiaque. L'algorithme a été développé et optimisé sur un premier ensemble de marqueurs, et sa performance évaluée sur un second ensemble. Un logiciel de validation a été développé pour préparer
ces deux ensembles et pour corriger les détections sur tous les enregistrements qui ont été utilisés plus tard dans les analyses. Il a été complété par des outils pour former, étiqueter et valider les battements sinusaux normaux, les activations auriculaires et ventriculaires prématurées (PAA, PVA), ainsi que les épisodes d'arythmie.
Les données cliniques préopératoires ont ensuite été analysées pour établir le risque préopératoire de FA. L’âge, le niveau de créatinine sérique et un diagnostic d'infarctus du myocarde se sont révélés être les plus importants facteurs de prédiction. Bien que le niveau du risque préopératoire puisse dans une certaine mesure prédire qui développera la FA, il n'était pas corrélé avec le temps de l'apparition de la FA postopératoire.
Pour l'ensemble des patients ayant eu au moins un épisode de FA d’une durée de 10 minutes ou plus, les deux heures précédant la première FA prolongée ont été analysées. Cette première FA prolongée était toujours déclenchée par un PAA dont l’origine était le plus souvent sur l'oreillette gauche. Cependant, au cours des deux heures pré-FA, la distribution des PAA et de la fraction de ceux-ci provenant de l'oreillette gauche était large et inhomogène parmi les patients. Le nombre de PAA, la durée des arythmies transitoires, le rythme cardiaque sinusal, la portion basse fréquence de la variabilité du rythme cardiaque (LF portion) montraient des changements significatifs dans la dernière heure avant le début de la FA.
La dernière étape consistait à comparer les patients avec et sans FA prolongée pour trouver des facteurs permettant de discriminer les deux groupes. Cinq types de modèles de régression logistique ont été comparés. Ils avaient une sensibilité, une spécificité et une courbe opérateur-receveur similaires, et tous avaient un niveau de prédiction des patients sans FA très faible. Une méthode de moyenne glissante a été proposée pour améliorer la discrimination, surtout pour les patients sans FA. Deux modèles ont été retenus, sélectionnés sur les critères de robustesse, de précision, et d’applicabilité. Autour 70% patients sans FA et 75% de patients avec FA ont été correctement identifiés dans la dernière heure avant la FA. Le taux de PAA, la fraction des PAA initiés dans l'oreillette gauche, le pNN50, le temps de conduction auriculo-ventriculaire, et la corrélation entre
ce dernier et le rythme cardiaque étaient les variables de prédiction communes à ces deux modèles.
Mots-clés :
Pontage coronarien, fibrillation auriculaire postopératoire, électrogramme auriculaire, analyse statistique, facteurs de prédiction.
Contents
Abstract ... i
Résumé ... iii
Table List ... ix
Figure List ... xi
Abbreviation List ... xviii
Acknowledgements ... xxi
Chapter 1 Introduction ... 1
1.1 Post-operative Atrial Fibrillation ... 1
1.2 Review of the Literature ... 3
1.2.1 Electrophysiological Mechanism ... 3
1.2.2 Risk Factors: Preoperative, Intraoperative, and Postoperative of Postoperative AF ... 7
1.2.3 Prophylaxis and Postoperative AF Treatment ... 17
1.2.4 Methods for Predicting Postoperative Atrial Fibrillation ... 17
1.3 Analysis on Atrial Electrograms (AEG) to Study the Mechanism and Prediction . 20 1.3.1 Hypothesis and Objectives ... 20
1.3.2 Choice of Subjects ... 21
1.3.2 Study Plan ... 22
1.3.3 Statistical Methods ... 23
Chapter 2 Detection, Validation and Time Series Building of AEG ... 27
2.1 Data Collection ... 29
2.2 Detection and Classification of Atrial and Ventricular Activations ... 30
2.2.1 Detection Challenges ... 30
2.2.2 A and V Detection and Discrimination ... 32
2.2.3 Detection Results ... 39
2.3 Validation ... 39
2.3.1 Selection of the Interval to Validate ... 40
2.3.2 Correction of Individual Local or Global Event ... 41
2.3.3 Template Matching ... 42
2.3.4 Classification Algorithm ... 43
2.3.5 Template Driven Timing... 47
2.4 Beat Formation ... 48
2.6 Beat Time Series Building ... 53
2.7 Discussion ... 57
2.7.1 Recording ... 57
2.7.2 Detection ... 57
2.7.3 Validation software ... 59
2.7.4 Time Series Building ... 61
2.8 Summary ... 63
Chapter 3 Analysis of Premature Atrial Activation and Time Analysis before
Onset of AF ... 64
3.1 PAA Analysis... 65
3.1.1 Number of LPAA (Left PAA) vs. RPAA (Right PAA) ... 65
3.1.2 Temporal Trend of PAA and Arrhythmia ... 67
3.2 Post-hoc Analysis of Raw Data and Position Data ... 71
3.3 Discrimination of Trigger from Non-Trigger Period ... 75
3.4 Characteristics of PAA Eliciting Occurrence of AF ... 80
3.4.1 Prematurity ... 80
3.4.2 Intra-atrial Propagation Time (CTA) of PAA ... 82
3.4.3 Local Derivative (Dvdt) ... 83
3.4.4 Cardiac Autonomic Neural Balance ... 84
3.5 Uniqueness of PAA Eliciting AF ... 86
3.6 Discussion ... 88
3.6.1 Time Evolutionary Risk Factors ... 88
3.6.2 Triggering vs. Non-triggering PAA ... 95
3.7 Summary ... 96
Chapter 4 Preoperative Risk Factor Analysis of AF and Non-AF Patients . 98
4.1 Univariate Analysis Result ... 994.1.1 Univariate Logistic Regression ... 99
4.1.2 Age/Gender ... 101
4.1.3 Artery Hypertension (HT)... 104
4.1.4 Prior Myocardial Infarct (MI) ... 105
4.1.5 Serum Creatinine ... 106
4.2 Multivariate Logistic Regression Analysis ... 108
4.3 Cox Regression ... 114
4.4 Discussion ... 117
4.5 Summary ... 120
Chapter 5 AF vs. Non-AF Clinical Predictor Analysis ... 121
5.1 Univariate Analysis ... 122
5.1.1.1 LPAA and RPAA ... 124
5.1.1.2 PAA Rate (RPAA) and Proportion (PPAA) Analysis ... 127
5.1.1.3 LPAA Analysis ... 128
5.1.2 Non-sustained Arrhythmia ... 129
5.1.3 AA Trend and AA Relative Difference Trend ... 130
5.1.4 LFPortion of AF and Control Patients ... 132
5.2 Model Building to Discriminate AF from Non-AF Patients ... 132
5.2.1 Logistic Regression Based on BTI (Basic Time Interval) Data ... 133
5.2.2 Modified Models for AF and Non-AF Prediction ... 142
5. 3 WMAM (Weighted Moving Average Method) For Model Prediction Improvement and Monitoring... 147
5.4 Discussion ... 151
5.5 Summary ... 156
Chapter 6 Originality, Limitation and Future Development of the Study .. 158
6.1 Originality of the Study ... 158
6.2 Study Limitation ... 160
6.3 Future Development... 160
Reference: ... 162
ANNEXE I ... I
ANNEXE II ... XXVI
Table List
Chapter 1
Table 1.1 Baseline Characters of Patients of Study Population ... 11 Table 1.2 Multivariable Predictors of Postoperative Atrial Fibrillation ... 14
Chapter 3
Table 3.1 Test within subject effects: (One-Way Within-Subjects ANOVA) ... 73 Table 3.2 Post-Hoc Analysis of Raw and Position Data of Specific Variables with
Significant Time-effects in 2-pre AF Hours ... 73 Table 3.3 The p value from univariate and multivariate logistic regression model with position data and 5 minutes partition ... 77 Table 3. 4 The comparison of AUC (area under ROC curve) among the four methods, including the area difference, the standard error, the significance of the difference and the confidence interval. ... 80
Chapter 4
Table 4.1 Baseline characters of the 137 patients of the study population ... 100 Table 4.2 P value of variables in univariate unweighted and sex weighted logistic
regression ... 101 Table 4.3 R (AF): Risk of AF in the group without (Non-HT) and with (HT)
hypertension. RR: relative risk ... 104 Table 4.4 R(AF): Risk of AF in the group without (Non-MI) and with (MI) ... 105 Table 4.5 Beta values and probability of the variables included in the logistic regression models. Weighted(W) and unweighted (Non-W) univariate (U) and multivariate (Mv) models. The numbers in parenthesis is the order of entry of each variable in the stepwise models. For variables not included in a model, the significance of the variable evaluated at the last step of the iteration is indicated. ... 108 Table 4.6 Indices of Model I, II, and III on men, women and total population ... 111
Chapter 5
Table 5. 1 Beta value of predictors in the final forward logistic regression model for 5, 10, 15 minutes intervals ... 133 Table 5. 2 Sensitivity, specificity, and ROC area of models of 5, 10 and 15 minutes BTI ... 134 Table 5. 3 p value of Group (AF vs. Non-AF), Time, and Group*Time effects upon ANOVA analysis of each variable of 10 minutes BTI data ... 137 Table 5. 4 Comparison of AUC (area under ROC curve) among the successive models obtain in the eight steps of the logistic regression ... 139 Table 5. 5 Sensitivity, specificity, and ROC area of stepwise logistic regression models by the order of variables entering into the models ... 140
Table 5. 6 The mean value of beta coefficients of stable predictors of Model 0,I,II,III,IV ... 146 Table 5. 7 Indices of five models (excluding the missing value periods, and missing value patients) ... 147 Table 5. 8 Normalized beta coefficients obtained by logistic regression ... 148
Figure List
Chapter 1
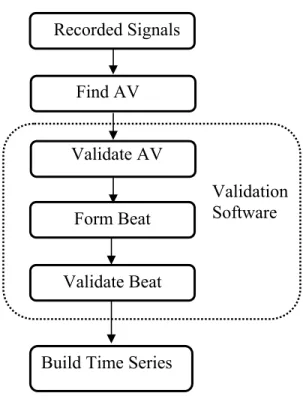
Figure 1. 1 A) A normal plane depolarization front travelling along the vertical direction; B) reentry. It was induced by applying a second stimulus covering half of the plane in the horizontal direction. The abscissa and ordinate are the coordinate of the tissue in the unit of pixel. The color stands for the membrane potential, corresponding values indicated in the color bar (mv). (The simulation data come from the project done by Elhacene Matene, Centre de recherche de l'Hôpital du Sacré-Coeur, Montréal). ... 5 Figure 1. 2 Flow chart of the project research method ... 22
Chapter 2
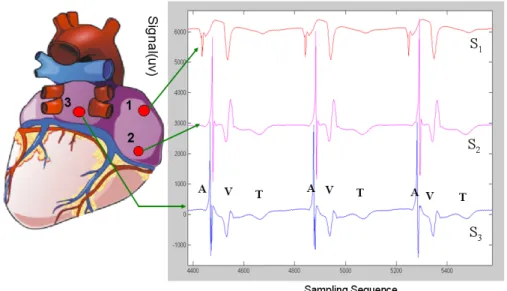
Figure 2. 1 Posterior view of the heart showing the 3 electrodes sutured to the right (S1,
S2) and left (S3) atrium and their electrograms. The atrial (A) and ventricular activations
(V) are indicated for three beats, as well as the ventricular T wave (T). ... 27 Figure 2. 2 Flow chart of building time series from AEG ... 28 Figure 2. 3 The five spatial configurations of unipolar electrodes on the posterior atria. LAA: Left Atrial Appendage. RAA: Right Atrial Appendage. LA: Left Atrium. RA: Right Atrium. PV: Pulmonary Vein. SVC: Superior Vena Cava. IVC: Inferior Vena Cava. ... 30 Figure 2. 4 Four example of difficulties encountered in the detection process: A) Holter device saturation, B) Baseline wandering, C) Noise in signal, D) Disproportion within and between channels. ... 31 Figure 2. 5 Detection and labelling algorithm (From the paper [151] with permission of the editor). The acronyms in the figure refer to variables that are defined in the paper presented in Annexe I. ... 35 Figure 2. 6 Detection of global activations (step 8).a) Original signals S1, S2, and S3. The
horizontal lines show the extent of the global activations, from their onset (TPeakon) and
to their offset (TPeakoff). b) Pass 1: events are segments with E90g ≥ Thresh1 (gray line)
for at least 40 ms, from Tact
on(*) to Tactoff (o). The upper dash line maxE1 is the maximum
of energy used to calculate the threshold (line labelled Thresh1). TPeakon and TPeakoff,
used to delineate the extent of the global in panel A, are the first minimum before Tacton
and after Tact
off respectively. Each event is removed and replaced by a 3 samples pivot
with an amplitude = 5% of energy at Tact
on. If the limits of two events are separated by
is analyzed as in Pass 1, with the new threshold Thresh2 (gray line), calculated from the
updated maxE2 function (upper dash line, Eq. 2.8) (from the paper [151] with permission
of the editor) ... 36
Figure 2. 7 Eg90(continuous line) and Eg25 (dash line).I90 and I25 are the integral on a ±40ms interval around the maximum of E90 and E25 respectively. The ratio R=100 I25/ I90 is used to calculate the threshold to discriminate A and V events. (From the paper [151] with permission of the editor) ... 37
Figure 2. 8 Detection and identification in a sequence containing a salvo of atrial premature activations. a) Discriminating function (continuous line, DF) and of a sequence of R ratio (described in Figure 2.7) for global events, showing discrimination of A (under DF) and V (over DF). When an activation is missed (3 V in that example), DF, which also depends on past values, maintains the discrimination. b) The DF function for channel S2 shown in the panel c. Even if one V is detected after 4 successive A, the discrimination is maintained. c) A and V detection and discrimination for a salvo of premature atrial activation (PAA) whose energy was highly depressed. All the PAA’s were correctly detected and labelled as A, even when much depressed as in channel S3 (only 2 channel shown for clarity). In S2, the first fusion beat was detected, but the depressed A was labelled as a possible V. In S3, the three fusion beats were labelled as A (from the paper [151] with permission of the editor) ... 38
Figure 2. 9 Principal interface of the validation software. The upper panel shows the tendencies, in this case AA of an electrode. Lines showing the mean value ± 2 standard deviations are displayed and outliers are highlighted by red dots. The orange heart shape dot indicated the position that is selected for examination. The lower panel shows the signal of three channels, the A and V markers, and the extent and labels of the global (A red, V green) in an adjustable interval around the location selected in the upper panel. The operation control menus and buttons appear on the right of the figure. ... 41
Figure 2.10 The context menu serves to remove or to change the label of the markers or modify their location. B) Pop-up menu for adding a marker. ... 42
Figure 2. 11 Classification in selected time interval and pop-up menu providing choices for group modification of the attributes of markers in a cluster. ... 43
Figure 2. 12 Signal (blue line) around the position of a selected marker (green), and boundaries (red) set by choosingθ . ... 46
Figure 2. 13 The set of reference waveforms of the clusters. ... 46
Figure 2. 14 Adaptive filtering method Z =H*X ... 47
Figure 2. 15 One atrial activation chosen as the filter (template H) ... 47
Figure 2. 16 The signal X as input of filtering ... 48
Figure 2. 17 The output of the convolution of H with X. Maximum beyond an adjustable threshold (red hatched line) localizes the position of similar waveform to H in X ... 48
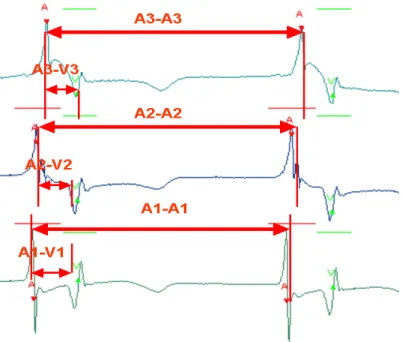
Figure 2. 18 Intra-Atrial conduction time (CTA), atrial firing order, an atrio-ventricular conduction time (CTAV) ... 50
Figure 2. 19 AA intervals of two consecutive beats with the same order of atrial firing . 50 Figure 2. 20 The main menu of Validate Beat. ... 51
Figure 2. 21 Indices of a beat, which can be edited. ... 51
Figure 2. 22 Interactive panel to perform beat modification. ... 52
Figure 2. 23 After detection and validation, the activations of three channels are grouped into beats with a label corresponding to their type (Normal sinus beat, PAA…) ... 53
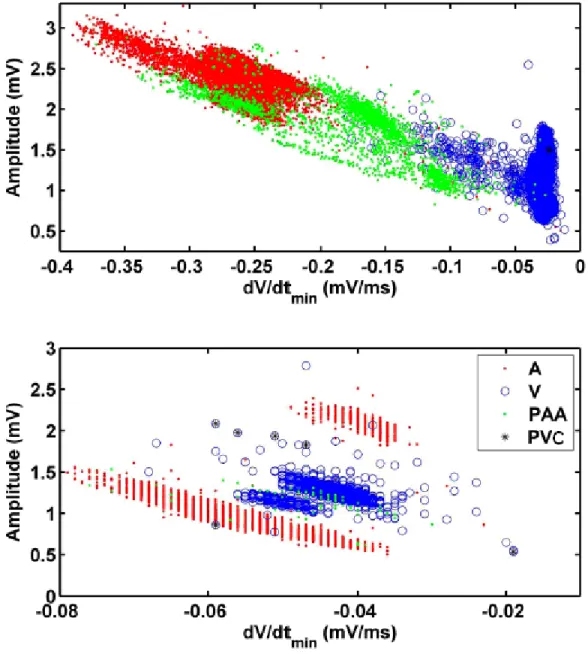
Figure 2. 24 Dispersion of the activations Amplitude vs. dV/dtmin from two channels from
different patients. All activations from 2hr recording prior to AF onset are shown: A (red dot), V (blue circle) and PAA (green dot), PAC (black star). Top panel: the distribution forms a continuous cluster, with PAA spread between A and V. Bottom panel: PAA and V are in a cluster between two separated clusters of A. ... 58
Chapter 3
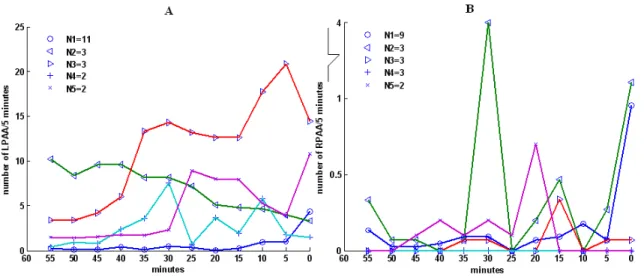
Figure 3.1 Proportion of LPAA (blue) and RPAA (golden) in the second hour before AF onset. The abscissa represents the identification (ID) number of the patients in the analysis. The ordinate is the proportion of LPAA (blue) and RPAA (gold) among the total PAA number within each patient. Patients with ID 1 to 26 and 27 to 29 had their AF triggered by PAA from left and right atrium respectively, while the origin of a subset of PAA including the trigger was unknown for the patient with ID 30. Homogeneity of proportion was rejected by χ2 test, using either the mean number (patients 1-29, P
<0.0001, patients 1-26 P<0.0001) or the mean proportion of left and right PPA (patients 1-29, P <0.0001, patients 1-26 P<0.0001) as null hypothesis. Both variables were examined because of the huge dispersion in the number of PAA among the patients. .... 66 Figure 3.2 Mean value and standard deviation of A) PAA Rate ( R
PAA L
PAA,R
R , in Panel A) and B) PAA Proportion ( R
PAA L
PAA,P
P , in Panel B) within each 5 minutes before AF. Left atrium: blue line and circle; Right atrium: red line and diamond. ... 67 Figure 3.3 Mean patterns associated to the clusters obtained by the analysis of five minutes (A) RL
PAA and (B) R R
PAA . The number of patient within each cluster is indicated.
The abscissa axis is the time before the onset of AF (min). ... 70 Figure 3.4 A) mean and standard deviation of the duration of arrhythmia (ArrhyDuration) by 5 minutes interval; B) Mean clusters profile of arrhythmia duration. ... 71 Figure 3.5 A) evolution of mean of the raw (blue) and position AAMean (red) in the last hour before AF. B) Cluster analysis of AAMean during the last hour before AF. Mean patterns of the clusters were plotted, and the number of patients associated to each cluster is indicated. ... 74 Figure 3. 6 A) evolution of mean of the raw (blue) and position LFPortion (red) in the last hour before AF. B) Cluster analysis of LFPortion during the last hour before AF. .. 74 Figure 3.7 Comparison of prediction of the trigger period (last interval before AF) using raw variables (A) and position variable (B) for five minutes intervals. Green color box stands for true positive, blue for false negative, red for false positive, and white for true negative, black for the period with missing values because of insufficient number of sinus beats in five minutes. The abscissa is the time from the onset of AF, and the ordinate is the patient identity. ... 76 Figure 3.8 A) Sign of estimated coefficient of predictors in the logistic model (red: positive coefficient, green: negative coefficient) for different partitions of 2 hours intervals before AF. B) Sensitivity (red) and specificity (black) of each model with cutting point calculated from the ROC curve. ... 77
Figure 3.9 ROC curves of Model I, II, III, and IV. The circles indicated the best cut off points for each model. ... 79 Figure 3.10 A) Cumulative distribution among the patients of the normalized absolute (P-Premabs, point) and relative (P-Premrel, star) prematurity of the triggering PAA. The
abscissa is the value of P-Premabs and P-Premrel, the ordinate is the cumulative proportion
of patients for which the trigger PAA has P-Premabs and P-Premrel ≤ the corresponding
value on the abscissa. B) Relation between PAA rate and P-Premabs and P-Premrel. The
abscissa is the PAA rate in last five minutes (number/min.), and the ordinate is the absolute (P-Premabs, point) and relative (P-Premrel, star) prematurity of triggering PAA. 81
Figure 3.11 A) Histogram of CTA distribution of LPAA and RPAA of one patient (LPAA, red color; RPAA, blue color). B) Histogram of CTA of LPAA of one patient, CTA varying from around 10 to 80 msec. ... 82 Figure 3.12 A) Cumulative distribution among the patients of the position of NDvdt of the triggering PAA. The abscissa is the position of NDvdt of triggering PAA, and the ordinate is the proportion of patients having NDvdt of the trigger PAA with position ≤ to each level indicated by the abscissa; B) The contrast plot of correlations: the abscissa is the correlation between NDvdt and prematurity, and the ordinate is the correlation between NDvdt and AA; C) Cumulative distribution of the trigger NDvdt residue position. Residue of regression of Ndvdt with AA and Prematurity were obtained and ranked in each patient (see text). ... 84 Figure 3.13 A) The cumulative distribution among the patients of the AAMean (continuous red line) and LFPortion (broken blue line) trigger PAA position. The abscissa is position of the trigger PAA, and the ordinate is the proportion of patients having a triggering PAA with a position ≤ to each level indicated by the abscissa. B) Scatter plot of MeanAA vs. LFPortion positions of the triggering PAA among the patients. ... 85 Figure 3.14 A) For each percentage of non-triggering PAA included in the sample, the ratio of the 200 runs in which each variable was included in the logistic model. The color bar indicate the value of the ratio; B) Mean value and standard deviation of sensitivity, specificity, and ROC curve area over the 200 runs for each percentage of non-triggers PAA... 87 Figure 3. 15 A) Relative P value of each independent variable in the logistic regression for four groups of patients (P/0.2, set to a maximum of 1); B: Beta values of variables of in the final forward conditional logistic model on different group PAA with significant level for entering the variables as 0.05 and 0.10, green stands for negative parameter, and red stands for positive parameters, white indicates non-significant predictor. (Tot, total PAA; LeLe, LPAA from patients with AF triggered by LPAA; LeLo, LPAA with PAA number<100; LeHi with PAA number>100) ... 88 Figure 3.16 Mean value and standard deviation of LPAA (blue) and RPAA (pink) CTA, Premabs, CTA, Dvdt and NDvdt. The rightmost points in each panel are the average and
standard deviation of the individual mean values. ... 90 Figure 3.17 Diagram of pulse propagation either from RPAA, or from LPAA, assuming propagation at constant speed for the activation before the premature activation ... 92 Figure 3.18 Simulation of eq. 3.1, with α =0.2, and k=0 (left) and k=0.5 (right). The premature impulse was applied at both end, with a coupling time P=1. Propagation of the first front was done by stimulation at position 0 in a resting medium (i.e. P(x)→∞ ) The
solid line is the conduction time vs. position of pulse from the right, and dot line for from the left applied with the prematurity =1. ... 92
Chapter 4
Figure 4.1 Number of AF (blue) and Non-AF (red) patients in the different A) age groups and B) sex groups; Proportions of AF (blue) and Non-AF (golden) patients in C) age groups and D) sex groups. ... 102 Figure 4.2 Age distribution across AF vs. Non-AF and Male vs. Female groups. The lower and upper lines of each box are the 25th and 75th percentiles, whose separation
defined the inter-quartile range. The middle line is the median and red diamond the mean. The upper and lower ‘whiskers’, the lines extending above and below the boxes, are located either at 1 inter-quartile from the top and bottom of the box, or at the position of the minimum and maximum if they are within these limits. Outliers beyond these limits are indicated by the +. The notches in the box are the 95% confidence interval of the median. All following box plot figures follow the same formula. ... 103 Figure 4.3 Distribution of Age as a function HT and AF among. A) male and B) female. The symbols of four groups: NAFNHT, Non-AF without HT; NAFHT, Non-AF with HT; AFNHT, AF without HT; AFHT, AF with HT. ... 104 Figure 4.4 Distribution of age in the groups with and without previous MI and AF for A) male and B) female. NAFNMI, Non-AF without MI; NAFMI, Non-AF with MI; AFNMI, AF without MI; AFMI, AF with MI. ... 106 Figure 4.5 A) Bar plot of mean and standard deviation of serum creatinine level in AF vs. Non-AF according to gender. AFMale: AF and Male; NAFMale: Non-AF and Male; AFFemale: AF and Female; NAFFemale: Non-AF and Female (Sex effect=0.01). B) Mean serum creatinine of different age groups. The ordinate of both panels is the serum creatinine level. ... 107 Figure 4.6 A) mean and standard deviation of serum creatinine level as function of HT and AF. NAFNHT:Non-AF and Non-HT, AFNHT: AF and Non-HT, NAFHT: Non-AF and HT, NAFHT: AF and HT (Effect: HT: 0.102, AF: 0.135, HT*AF: 0.986). B) Mean of serum creatinine level in AF vs. Non-AF according to HT. The ordinate of both panels is the serum creatinine level. ... 107 Figure 4.7 ROC curves from logistic regression Model I, II and III. The circles of the curves correspond to the optimal sensitivity and specificity for each model. ... 110 Figure 4.8 Distribution of age of TP, FP, TN and FN obtained by Model I. The diamond square points indicate the mean value of each group. TP: True Positive; FP: False Positive; TN: True Negative; FN: False Negative. ... 112 Figure 4.9 Distribution of serum creatinine of TP, FP, TN and FN obtained by Model II. The diamond square points indicate the mean value of serum creatinine in each group.113 Figure 4.10 Pervious myocaridal infarct proportion in four groups TP, FP, TN and FN. ... 114 Figure 4.11 Survival curve and cumulative hazard function of AF with respect post-operative time (A: Survival function, B: Hazard Cumulative Hazard function). ... 115 Figure 4.12 Survival curves of three groups of Patients with different preoperative risk score classified in three groups. ... 116
Figure 4.13 Survival curves by the functions of age group and sex ... 117
Chapter 5
Figure 5.1 Time windows of AEG signals for an AF patient and its matched Non-AF control. 0 represents the time of beginning of post-surgery. T for AF patient is the time of occurrence of AF, T for control (Non-AF) patient is the same post-operative time. ... 121 Figure 5.2 Cumulative distribution of the PAA number in AF and Control group. The distribution of the PAA number in the two groups, AF (blue line) and Control (red line) was quite different. ... 124 Figure 5.3 Fraction of LPAA (blue color) and RPAA (golden color) for each patient of the control group. Patients 48 to 58: no PAA detected. Homogeneity of the proportions was rejected by χ test (<0.001) using either the mean number (all patients) or the mean 2
proportion (patients 1-47) of left and right PAA. ... 125 Figure 5.4 ROC curves from a logistic model including the total number of PAA and the LPAAFraction. In the forward stepwise logistic regression model, the total number of PAA and LPAAFraction both brought a significant contribution to the discrimination of AF and Non-AF patient. For the first mode l (red ROC curve), the predictor is LPAAFraction; for the second model (blue ROC curve), the two predictors are LPAAFraction and PAA are included... 126 Figure 5.5 A) Mean value and standard deviation of PAA rate (RPAA) within each 5 minutes for the 2 hrs of Control (Non-AF) and AF Group. B) Mean value of PAA proportion (PPAA) within each 5 minutes for the 2 hrs. Control (Non-AF, diamond shape, red line); AF(circle shape, blue line). ... 127 Figure 5.6 The 8 biggest groups from cluster analysis of PAA rate in control group (Patients without PAA were excluded). ... 128 Figure 5.7 A) mean value of LPAA number within each 5 minutes during 2 hrs. B) Mean value of LPAA Fraction within each 5 minutes during the 2 hrs. (AF: blue line and circle shape; Control: red line and diamond shape). ... 129 Figure 5.8 A) The mean value and standard deviation of arrhythmia duration time (sec.) in each five minutes; B) The mean value of relative difference value of arrhythmia duration for AF and Control. The relative difference (eq. 5.1) was calculated using the value of the first 5 minutes as reference. (AF: blue line and circle shape; Control: red line and diamond shape). ... 130 Figure 5.9 The trend of raw AA (A) and relative difference (B) AA, the latter calculated using the time period of the first 5 minutes as the reference. AF: red and diamond; Non-AF: blue and circle. As in chapter 3, only normal sinus beats were considered. ... 131 Figure 5.10 Cluster analysis of AA raw (Panel A) and relative difference data (Panel B). In panel A and B the mean trends of 8 more populated groups were plotted respectively. ... 131 Figure 5.11 The trend of mean of LFPortion (A) and of its relative difference (B). (AF: blue, circle; Control: red, diamond) ... 132
Figure 5.12 The time evolution of mean and standard deviation of the risk scores of 5, 10 and 15 minutes BTI (A, B, C) logistic regression model in AF (red) and Non-AF (blue) groups. ... 135 Figure 5.13 Left panels: temporal evolution of pNN50, CTAVMean, CTAVStd and CorrAA_AV (from top to bottom) in AF (blue circle) and NAF (red diamond) groups. All values were computed from normal sinus beats in each 10 minutes interval. The average values were also calculated for each patient. The last point in each panel shows the mean and standard deviation of these averages in each group. The right panels show the cumulative distribution of these averages within each group. ... 136 Figure 5.14 ROC curves of stepwise logistic regression models for 10 minutes BTI by the order of predictors entering into the models: RPAA , PreopRisk, LPAAFraction,
CTAVMean, pNN50, CorrAA_AV, CTAVStd, LFPortion. ... 138 Figure 5.15 For each sample size (represented by the abscissa value), the fraction of 100 random samples in which each variable was selected as a significant predictor (p<0.05). ... 141 Figure 5.16 mean and standard deviation of the β coefficients of the 7 stable predictors as a function of the sample size. (The value of the constant was added). For each sampling size, the mean and standard deviation of the β value of each variable were computed from all the samples in which it was included as a significant predictor. ... 142 Figure 5. 17 Weights assigned to AF and Non-AF time intervals in Model III and Model IV. Linear (red, model III) and hyperbolic tangent (blue, model IV) weights for AF time intervals, constant weights (magenta) for Non-AF time intervals. The data is 10 minutes BTI data. The sum of the weights is 1 for all cases. ... 143 Figure 5.18 For each sample size, appearing in the abscissa, 100 random samples were constructed from the full set of intervals. The figure show the fraction of these in which each variable was selected: Model I (A), Model II (B), Model III (C) and Model IV (D). ... 144 Figure 5.19 Prediction accuracy of AF and Non-AF vs. cut-off point. The magenta points are the optimal ROC cut-off points and their corresponding prediction accuracy values. ... 150 Figure 5.20 Classification of each time interval for Model 0, I, II, III, IV, (A to E) using the optimal threshold shown in Figure 5.19. The ordinate is the time from 100 minutes to the onset of AF, or corresponding monitoring time for Non-AF. The abscissa is the patients ID (1-29, AF; 30-87, Non-AF). Color code: red, true positive; green: false negative; white, true negative; magenta, false positive; black, missing independent variables because of insufficient sinus beats. ... 150 Figure 5.21 Prediction accuracy of AF and Non-AF prediction over the time based on ROC threshold for Model 0, I, II, III and IV. The abscissa is the time before the onset of AF, or the corresponding monitoring time for Non-AF. The ordinate is prediction accuracy for AF (red) and Non-AF (blue). ... 151
Chapter 6
Abbreviation List
A atrialAA time interval between consecutive atrial activations AAMean mean of AA
AAStd standard deviation of AA series
ACE angiotensin-converting enzyme
AEG atrial electrogram AF atrial fibrillation
ANP atrial natriuretic peptides ANS autonomic nervous system ArrhyDuration arrhythmia duration
AV time interval between consecutive atrial and ventricular activations AV atrioventricular
BTI Basic Time Interval
CABG coronary artery bypass graft surgery CANS Cardiac Autonomic Nervous System CAP cell action potential
CHF congestive heart failure
COPD chronic obstructive pulmonary disease COPD chronic obstructive pulmonary disease
CorrAA_AV Correlation of AA series and CTAV series CorrAA_CTA Correlation of AA series and CTA series CorrAV_CTA Correlation of AV series and CTA series
CPB cardiopulmonary bypass time
CRP C-reative protein
CTA intra-atrial conduction time CTAStd standard deviation of CTA series CTAV atrio-ventricular conduction time
CTAVMean mean of CTAV
CTAVStd standard deviation of CTAV
DC Deviation Cohort
DF discrimination function
dv/dt the maximum slopes of negative deflections of each atrial activation ECG electrocardiogram
ERP refractory period FFRW far field R-waves
FFT Fast Fourier transformation
FN False Negative
FP False Positive
HF high frequency, 0.15-0.4 Hz
HRV heart rate variability
HT hypertension
ICD implantable cardioverter-defibrillator LF low frequency, 0.04-0.15 Hz
LPAA PAA initiated from left atrium LPAAFraction LPAA fraction
LVEF left ventricular ejection fraction LVEF left ventricular ejection insufficiency MAP monophasic action potential
MI Myocardial Infarct
Non-AF without atrial fibrillation
NSAIDs nonsteroidal anti-inflammatory drugs PAA premature atrial activation
PAC premature atrial complex
pNN50 Proportion of successive with a difference > 50ms
P-Prem Position value of the prematurity of each triggering PAA Premabs absolute prematurity
Premrel relative prematurity
PVA premature ventricular activation
rMSSD root mean square of difference between successive AA ROC Receiver Operating Characteristics
RPAA PAA initiated from right atrium
RPAA PAA rate
Left PAA rate
RPVA PVA rate
SA sinoatrial
SAPD signal-averaged P-wave duration
TN True Negative
TP True Positive
UW vs. W unweighted vs. weighted V ventricular
VA time interval between consecutive ventricular and atrial activations VV time interval between consecutive ventricular activations
L PAA
Acknowledgements
I would like to acknowledge Dr. Alain Vinet, who served as mentor, supervised me and supported me during my M.Sc., Ph.D. study and the research work in Hôpital du Sacré-Coeur. He encouraged me, and believed me to be able to overcome the difficulties. He shared enormous time with me on the project. His strong theoretical background, scientific spirit, and patient supervision, made my research work advanced further. He set a good example for me to be a researcher. I am very fortunate and grateful to have him as my mentor.
I also wish to thank Dr Pierre Pagé, for his contribution of the clinical data of the project, and the sharing his clinical experience related to this project. I appreciated very much the help of Dr Aimé-Robert Leblanc for his good suggestion about the project, especially in detection part of the electrograms study.
I would also like to acknowledge Dr Yalin Yin and Mr. Bruno Dubé. Dr Yin taught me so much cardiac electrophysiology and clinical knowledge about atrial fibrillation. He also revised the dissertation. Bruno did a big part of work in the detection and identification. They both contributed in a major way to the success of this research.
There are numerous others who contributed to this project in different stages and ways. Dr Pierre Savard, Dr Michael Guevara shared their ideas in the research proposal. I am also grateful to Dr Réginald Nadeau for his revision of the dissertations.
This project would not have been possible without the support of Centre biomédecine, Hôpital du Sacré-Coeur. I do appreciate the help and support from the working staff and students in the research center.
I would never forget all the people who helped, supported me during the time of my study.
Chapter 1 Introduction
1.1 Post-operative Atrial Fibrillation
The cardiovascular system transports and distributes essential substances to each part of the body and removes by-products of metabolism. The heart consists of two pumps in series: the right ventricle propels blood to exchange of oxygen and carbon dioxide within the lungs and the left ventricle propels blood to all other tissues of the body. The functions of different cardiac chambers must be precisely controlled and electrically synchronized. In normal resting heart rhythm, the heart rate varies from 60 to 100 beats per minute. Normal electrical activation is initiated in the sinoatrial (SA), from which the impulse propagates in the atria and then induces the atrial contraction. The wave of excitation ultimately reaches the atrioventricular (AV) node. Conduction is slow in the AV node, which provides a delay between the atrial and ventricular depolarization that assures a complete filling of the ventricles. Then the impulse spreads rapidly across the ventricles through the Purkinje fibers to make them contract [1, 2].
.
Atrial fibrillation (AF) is a cardiac arrhythmia, involving the two atria. During AF, the atrial contraction is rapid and irregular. The filling of the ventricles becomes incomplete, and their frequency, which is limited by the refractory period of the AV node, may become very rapid and irregular, leading to reduce of cardiac output [3-5]. The regular electrical impulses travelling from the sinoatrial node are replaced by disorganized and rapid electrical impulses, which result in irregular heartbeats [6]. Atrial fibrillation may result in symptoms of palpitations, fainting, chest pain, or even heart failure. In addition, the erratic motion of the atria leads to blood stagnation, which increases the risk of formation of blood clots that may travel from the heart to the brain and other areas. AF is
generally explained by the phenomenon of reentry, in which the propagation of an activation front becomes self-sustained. Two scenarios have been proposed: uncoordinated multiple wavelets of excitation circulating throughout the atria or fibrillatory conduction front generated by a single mother rotor [5, 7].
Coronary artery bypass graft surgery (CABG) is a surgical procedure performed to relieve angina and restore the blood flow. Arteries or veins from elsewhere in the patient's body are grafted from the aorta to the coronary arteries to bypass atherosclerotic narrowing and improve the blood supply to the coronary circulation supplying the myocardium [5, 8-11]. Despite the increased rate of percutaneous coronary intervention, CABG is still a common surgery. In Ontario for example, around 8,0000 interventions have been performed each year from 1998 to 2004 [12]. About 500,000 CABG operations are performed annually in the United States. 10% to 65% of patients who never had a history of AF develop AF on the second or third post CABG surgery day [ 13-15]. The patients undergoing valve surgery or combined valve and CABG have higher incidence of postoperative AF than patients having CABG alone. AF is especially common after mitral valve surgery, occurring in as many as 64% of patients. The occurrence of postoperative AF is associated with worse morbidity and longer and more expensive intensive-care hospitalization [16-19]. There is evidence that AF associates with adverse events: patient discomfort, the need for additional medications and treatments, decrease in cardiac output, hypotension, and congestive heart failure. The most serious complication of AF is stroke. The prolongation of stay in hospital leads to negative social and economic aftereffects. In the United States, the cost for the intensive care against postoperative AF is substantial, with annual estimated expenditures exceeding 1 billion US dollars [20]-[21].
Although the understanding of cardiac arrhythmias has advanced considerably during the last half century, it is only during the last 20 years that the pathology of AF has become a popular topic for physicians and researchers in the cardiology field. The fundamental mechanism responsible of AF, especially for post-surgery patients, is not well understood. Prophylactic medical therapy decreases the incidence of postoperative AF
after CABG. The most effective preventive methods, either medical prevention or preventive pacing, require additional nursing and medical resources and expense. Prophylaxis of the whole patient population undergoing GABG is not an optimal choice. Unless the pathophysiological mechanisms of AF are identified, the design of adequate strategy of prevention will remain problematic. Identification of patients at high risk of AF after CABG would be very helpful and cost-effective [20] [9, 10, 19].
Therefore, the aim of the present research is to investigate to which extent multi-channel unipolar atrial electrograms (AEG) can be used to predict the onset of AF and discriminate AF from non-AF patients
1.2 Review of the Literature
In the last 20 years with the development and maturing of the CABG operation, more and more researchers and physicians turn toward research of mechanism, prediction and management of AF [7, 20-27]. Many studies aimed to develop methods of AF prediction based on the analysis of ECG, with focus on different aspects such as P wave duration, autonomic balance, non-linear analysis or advanced signal processing [24, 28-35]. However, so far, there is not adequate explanation for why some patients develop postoperative AF whereas others remain in sinus rhythm. The next section will discuss the current development and hypotheses regarding the electrophysiological mechanisms, the prevention, the treatment and the prediction of AF.
1.2.1 Electrophysiological Mechanism
Publications are still controversial regarding the mechanisms responsible for the onset of post-CABG AF as well as the identification of patients at risk [7, 11, 20, 21, 36-38]. However, all forms of AF are believed to share common basic electrophysiological mechanisms, while some studies indicated possible localized pathoelectrophysiological mechanisms [37-43]
The search for AF mechanism could be traced as early in 1907 when Winterberg proposed that multiple rapidly firing foci located throughout the atria led to occurrence of AF [44]. GR Mines and WE Garrey advanced independently the concept of reentry, whereby the conduction of an excitation front around a closed circuit can become self-sustained. They then proposed that AF or VF could be caused by ‘multiple-simultaneous-reentrant circuits’ coexisting in the tissue [7, 45, 46]. In a later 1924 review paper, Garrey stated that its original proposal did “not mean, and never was intended to mean that multiple circuits were fixed in their isolated paths and independent of each other,…, but it was intended to convey the idea that impulses looped back upon its old path, completing a circuit now here, now there. Such reentrant circuit can exist side by side transiently” [47]. Until the mid 20’th century, the debate between the multiple foci and multiple reentries hypotheses, as well as on the exact nature of these reentries (unique or multiple, fixed or transient) was still open [48]. In 1959, Moe and Abildskov, in fact revisiting the arguments of Garrey, proposed that the occurrence of AF was fundamentally different from multiple ectopic discharges [3]. Afterwards, Moe put forward the ‘multiple wavelets hypothesis’, which differed from the fixed multiple-circuit-reentry concept. It states that multiple independent wavelets circulate around functionally refractory tissue without returning to their initial starting points. Some wavelets are able to propagate through tissues of adequate excitability and maintain themselves with or without producing daughter wavelets. They exemplified their multiple wavelets hypothesis by a two dimensional cellular automata model [49]. From then, Moe's theory was more generally accepted compared to the foci origination theory. The idea of Moe's theory, in brief, is that atrial fibrillation was considered to be a fundamentally turbulent and self-sustaining process, occurring in inhomogeneous excitable medium. The process could be initiated by an impulse propagating through the medium at a time when some of its components have recovered while others remain partially or fully refractory as a result of a preceding activation [3, 49]. The mother wave hypothesis, in which a one or a few anchored or locally meandering high frequency reentries result in complex patterns of propagation, has been proposed as an alternative to the multiple wavelet hypothesis [44]. Nowadays, both scenarios are considered to occur, suggesting that they may require different types of intervention.
Reentry can occur around an anatomical obstacle, in which case it can be labeled as closed circuit reentry. Two-dimensional simulation plans of the depolarization front along one direction and the reentry are showed in Figure 1.1. However, both mother wave and multiple-wavelet AF implicitly refer to functional reentry which does not necessitate an unexcitable core. An example of reentry induced by premature stimulation is a two-dimensional model cardiac tissue is showed in Figure 1.1. There exist two competing models of functional reentry in cardiac tissue: the leading circle which is a qualitative model based on experimental observations [50], the spiral wave model, based on theoretical considerations and numerical simulations of ionic models[7, 51, 52]. The latter provides a more realistic representation of the electrical properties of the tissue and a more correct prediction of state of the core around which propagation takes place [53]. In the classical view of closed circuit and leading circle reentry, the wavelength of reentrant wavelets, the product of the conduction velocity and refractory period, is the main determinant of the persistence of AF. The wavelength determines the size of each functional reentry circuit and limits the number of simultaneous reentry wavelets that can exist during fibrillation. The relation becomes more complex in the spiral model, since it involves the curvature of the front and the electronic effect during repolarization [53]. Nevertheless, both models predict that the shortening of the refractory period (ERP) has a crucial role in increasing wavelets number and is a major determinant in sustaining of AF [54].
A B
Figure 1. 1 A) A normal plane depolarization front travelling along the vertical direction; B) reentry. It was induced by applying a second stimulus covering half of the plane in the
horizontal direction. The abscissa and ordinate are the coordinate of the tissue in the unit of pixel. The color stands for the membrane potential, corresponding values indicated in the color bar (mv). (Figure provided by Elhacene Matene, student of Dr. V. Jacquemet, Centre de recherche de l'Hôpital du Sacré-Cœur and Institut de Génie biomédical, Université Montréal. It shows a simulation of reentry in a model of atrial tissu).
Patients developing postoperative AF are speculated to have a vulnerable heterogeneous substrate prone to develop AF, such as non-uniform and dissimilar refractoriness, a depolarizing wave front becomes fragmented when encountering both refractory and excitable myocardium. This allows wave fronts to return and stimulate previously refractory but now repolarized myocardium, which can lead to self-sustained propagation or reentry [55, 56]. However, other elements such as the slope of the action potential restitution curve, the curvature of the wave front and the distribution of gap junctions also contribute to the dynamics and stability of reentry [54, 57]. Han et al. proposed that dispersion of recovery of excitability in the atria or ventricles of the heart predispose to the development of both atrial and ventricular arrhythmias [58, 59]. Comtois et al. also explained that the difference of adjacent atrial cells can predispose to pulse conduction reentry [53]. Beside, fibrosis has been strongly associated with the presence of heart diseases/arrhythmias. It was recently considered to alter atrial electrical conduction and excitability and provides a substrate for AF onset and perpetuation [60, 61].
Although the pathological substrate may favors the incidence of AF, ectopic focal activation is a mechanism to trigger the AF [62]. Ectopic foci can be found in many areas of the atrium including the pulmonary veins, the superior cava, the coronary sinus ostium, as well as the posterior and anterior left atrium [63-65]. In Holter ECG monitoring, a triggering premature atrial complex (PAC) was present in more than 90% percent of AF episodes. According to the polarity of the ectopic P-wave, triggering PACs were left atrial origin in 74.3%, right atrial in 15.3%, not determined in 10.4% of cases. Frequency of PACs was significantly higher in the hour preceding the onset of AF. Among PAC, two-thirds had a left atrial origin [66].
be due to autonomic innervations [34, 37, 67]. It is reported that either vagal nerve activation or sympathetic nerve stimulation, both could facilitate the occurrence of AF. Either vagal stimulation or acetylcholine administration decreases the atrial refractory period in a spatially heterogeneous way [68, 69]. In addition, vagal stimulation promotes both the production of PAA and their propensity to start AF [7, 70]. Sympathetic stimulation can also promote the initiation of AF. Sympathetic nerve stimulation also shortens atrial refractoriness in a comparable degree. The difference between vagal and sympathetic stimulation might lie in the more spatially heterogeneous effect of vagal nerve activation. Two major patterns of AF initiation can be observed. AF occurring after a slowing heart rate, thought to be triggered by a dominant parasympathetic tone that frequently occurs in patients with normal hearts. Adrenergic-induced AF is more frequent in older patients with structural heart disease, and typically occurs during exercise [71,
72]. The possible implication of the autonomic nervous system in postoperative AF was discussed in many publications, and the atrial electrophysiological effects caused by autonomic nervous system stimulation are complex, sometimes even controversial [20,
33, 71, 73, 74]. Amar reported an increase both in heart rate and in heart rate variability (HRV) prior to the onset of postoperative AF. These findings are consistent with parasympathetic resurgence competing with increasing sympathetic activity as a triggering mechanism for postoperative AF [33]. It has been put forward that elevated norepinephrine levels suggested that sympathetic activation may be important in the pathogenesis of post CABG AF. Sympathetic activation, however, is highest the first 24 hours after operation, whereas the onset of AF usually occurs between the second and third postoperative days [75]. Some findings suggested divergent autonomic conditions to occur before arrhythmia onset, which could be either heightened sympathetic or parasympathetic tone, or event dysfunctional autonomic heart rate control, with higher or lower measures of heart rate variable [71, 76].
1.2.2 Risk Factors: Preoperative, Intraoperative, and Postoperative of
Postoperative AF
Many risk factors for postoperative AF have been identified, but the results of different studies have often been inconsistent. This might be due to the factors as: 1. the mechanism of AF is complex and multi-factorial; 2. most studies are observational and retrospective, with varying inclusion criteria. This is illustrated in Table 1.1, which shows the patients characteristics in four studies on post-operative AF. The distribution of preoperative factors found to be related to AF occurrence in some studies is not even reported in others (empty boxed if not available). Table 1.2 compares the risk score (a risk index to indicate risk degree, definition seen in [77]) or odds ratio associated to different variables in these same four studies. It shows that using different data and/or study population can leads to very different results. The following reviews current knowledge on the preoperative, intraoperative and postoperative risk factors.
Preoperative Risk Factors
The following variables have been reported as potential preoperative and perioperative risk factors: age, sex, right coronary artery stenosis of 90% or higher, left ventricular abnormality as ejection fraction, enlargement, hypertrophy; dilation, aortic atherosclerosis, hypokalemia, history of atrial fibrillation, valvular disease, CHF(congestive heart failure), vascular disease, neurological event, diabetes, any MI(myocardial infarction), hypertension or chronic obstructive pulmonary disease (COPD), prior CABG surgery or valve surgery, previous congestive heart failure, and preopeative absorption of beta-blockers, angiotensin-converting enzyme (ACE) inhibitors, calcium channel blockers, amiodarone, or nonsteroidal anti-inflammatory drugs (NSAIDs) [17, 36, 38, 75, 76, 78-80].
Age has a significant relation with the incidence of postoperative AF. The incidence rate of post-CABG AF is more than 50% for patients older than 80 years, but less than 5% for those that are less than 50 years [76, 81]. The association could be attributable to age-related structural changes in the atrium such as dilation, muscle atrophy and fibrosis. Patients with a history of AF appear to have the underlying substrate conducive to the development of AF and may be more susceptible to postoperative AF [77, 82]. This
would be consistent with the concepts of electrical remodeling and “AF begets AF” that is supported by numerous clinical and experimental studies [7].
Men appear more likely to develop AF after CABG than women [83, 84]. Sex differences in ion-channel expression and hormonal effects on autonomic tone may explain this difference between genders However, there exist conflicting reports, in which male gender was not an independent predictor of AF [80].
Hypertension was regarded as a predictor of postoperative AF, and this may be related to increased fibrosis and dispersion of atrial refractoriness [85, 86]. However, such a relation was not found in another study involving a larger number of patients [87].
Chronic obstructive pulmonary disease (COPD) is a predictor of AF after cardiac surgery. It might be related to fact that COPD patients have frequent premature atrial contractions that can act as a trigger for the initiation of AF [84].
The right coronary artery also conveys the blood supply to the right atrium, the sinoatrial node and the atrioventricular node. Patients with a total occlusion or severe stenosis of the proximal right artery had postoperative AF more often when retrograde cardioplegia was used. In other studies, obstructive disease in the sinoatrial nodal and atrioventricular nodal arteries was more common in patients developing AF after CABG than in those who remained in sinus rhythm. Stenosis of the sinoatrial artery or the right coronary artery has been found to be independent predictors of AF after CABG by other investigators [14, 88].
Many studies showed that obesity, or body mass index and metabolic syndrome are risk factors of postoperative AF [13, 89-93]. Echahidi demonstrated that obesity was a powerful and independent risk factor for the occurrence of postoperative AF in patients older than 50 years. In a younger population, obesity was not a risk factor whereas metabolic syndrome remained an independent risk factor [13] .
There was also the study about preoperative renal function associated with the risk of atrial fibrillation after surgery [94, 95]. It was found the patients measured higher level of serum creatinine, were more risky to develop postoperative AF.
Several studies have examined the relationship between left atrial dysfunction [96, 97]. Leung found that the patients subsequently developing post-operative AF had a larger LA and LA appendage area, and lower LA ejection fraction measured in the pre-bypass period. Their results demonstrate that some of the structural and functional changes in the atria common to chronic AF in the elderly population are also prevalent in surgical patients who develop post-operative AF, suggesting that both may share similar pathophysiology. LA enlargement was also found to be a predictor of postoperative AF either in CABG patients [98] after cardiac valvular surgery [99]. However, Zaman et al. did not find any difference in the size of LA between the patients who had AF and those who remained in sinus rhythm. Their study included only 64 patients and was subgroup of a larger study population [100].
Some studies proposed that preoperative withdrawal of beta-adrenergic blockers was associated with increased risk for postoperative AF [80, 101]. The withdraw effect is characterized by an increased plasma concentration of catecholamine that may increase the incidence of AF. It has been demonstrated that the bioavailability of perioperative metoprolol (beta-adrenergic blockers) is markedly reduced when administered in tablet early after CABG. The poor absorption of oral beta blocker immediately cardiac surgery may further strengthen the withdrawal effect [102]. The prophylaxis with moderate doses of amiodarone in the postoperative period of cardiac surgery (coronary artery bypass grafting and/or valve surgery), was shown to reduce the incidence of AF in high risk patients with high risk patients, raising the possibility that it could also be protective for a larger class of patients [103].
Table 1.1 Baseline Characters of Patients of Study Population Mathew [77] Zaman [100] Amar [104] Auer [80] Age(mean, SD), years AF Non-AF 67.8(8.2, n=976) 61.8(9.8, n=2117) (p<0.0005) 65.9(n=92) 61.7(n=234) (p<0.0001) 68(9,n=508) 62(11, n=1.045) (p=0.008) 67.5(9.1,n=99) 63.7(11.4,n=154) Incidence of AF 32.27% 28.22% Men, No. (%) AF Non-AF 770(78.9, DC) 1682(79.5, DC) (p=0.084) 81(88) 187(80) (p=0.63) 336(66) 704(67) (p=0.29) 55(55.5) 98(63) SAPD(ms) AF Non-AF (p<0.0005) 158 145 (p=0.02) 117±17 115±18 LVEF, % AF Non-AF (p=0.751) 56 56 Left atrial size, cm*
AF Non-AF (p=0.831) 3.8 3.9 History, No. (%) Atrial fibrillation AF Non-AF Valvular disease AF Non-AF Myocardial Infarction AF Non-AF COPD AF Non-AF Hypertension (%) AF 142(14.6, DC) 126(6.0, DC) 271(27.8, DC) 316(14.9, DC) 612(62.7, DC) 1334(63.0, DC) 137(14.0, DC) 183(8.6, DC) 668(68.4, DC) (p<0.0001) 57(11) 27(3) (p=0.48) 265(52) 525(50) (p=0.13) 46(9) 72(7) (p=0.17) 371(73) (p=0.68) (60.6)
Non-AF Diabetes(%) AF Non-AF 1348(63.7, DC) 303(31.1, DC) 660(31.2, DC) 728(70) (p=0.19) 167(33) 379(36) (64) (p=0.12) (19.2) (28.6) Preop. treatment, No.(%)
β-Blockers AF
Non-AF
Calcium channel blockers AF Non-AF ACE inhibitors AF Non-AF 645(66.1, DC) 1480(69.9, DC) 391(40.1, DC) 768(36.3, DC) 447(45.8, DC) 875(41.3, DC) 54(59) 164(70) (p=0.05) 239(47) 547(52) Cross-clamp, mean(SD),min AF Non-AF 69.5(35.1, DC) 61.8(29.3, DC) (p=0.306) 45 43 (p=0.33) 63±22 64±22
Heart valve surgery(%) AF
Non-AF
(P<0.0001)
62.6 33.1 RCA graft(% of CABG)
AF
Non-AF
(P=0.08)
58.1 72.3 CPB time, mean(SD), min
AF Non-AF 108.6(45.7, DC) 98.7(39.8, DC) Pre-operative Q-waves, n(%) AF Non-AF (p=0.506) 31(34) 70(30) RCA stenosis, n(%) AF Non-AF (p=0.212) 55(60) 122(52) CPB time, min AF (p=0.025) 81
Non-AF 74 Grafts>3, n(%) AF Non-AF (p=0.040) 31(34) 53(23) Preoperative creatinine >125 μmol/L, n(%) AF Non-AF (p=0.260) 22(23) 43(18) Postoperative Low cardiac
output, n(%) AF Non-AF <0.0001 36(7) 24(2) Postoperative complications(%) AF Non-AF (p<0.05) 12.1 5.8 DC: Derivation Cohort;
ACE: angiotensin converting enzyme; SAPD: signal-averaged P-wave duration; LVEF: left ventricular ejection fraction; CPB=cardiopulmonary bypass time.
Table 1.2 Multivariable Predictors of Postoperative Atrial Fibrillation Mathew [77] Zaman [100] Amar [104] Auer [80] Risk Score, (R.S., p) Odds Ratio (O.R., p) Odds Ratio (O.R., p) Odds Ratio (O.R., 95% CI, p) Age, y <30 (R.S.) 30-39(R.S.) 40-49(R.S.) 50-59(R.S.) 60-69(R.S.) 70-79(R.S.) ≥80(R.S.) (R.S., Risk Score) p<0.001 6 12 18 24 30 36 42 1.53(<0.0005) (per 5-y increase)
1.1 (p<0.0001) (per year incre.)
2.6(1.2-3.9) <0.01 Medical history AF(R.S.), p COPD(R.S.), p 7(<0.001) 4(.009) 3.7(p<0.0001, O.R.) Concurrent valve surgery 6(<.001) 2.8(1.1-3.5) <0.01 Withdrawal of treatment β-Blockers ACE inhibitors 6(<.001) 5(<0.001) Preop. and postop.
treatment β-Blockers ACE inhibitors -7(<0.001) -5(<0.001) Postop. β -Blockers treatment -11(<0.001)
Other treatment Potassium supplementation NSAIDs -5(<0.001) -7(<0.001) SAPD>155ms 5.37(<0.0005) p-wave duration >110ms 1.3(p=0.02) Male sex 2.88(0.0092) Postoperative low cardiac output (O.R.) 3.0(p=0.0001) Postoperative complication 1.9(1.0-7.5) <0.05 Non-use preoperative beta-adrenergic blocker 1.7(1.1-4.9) <0.05
Intraoperative Risk Factors
Auer proposed that the type of surgery may affect the risk of AF after cardiac surgery [80], and higher risk of postoperative AF and mortality were observed after mitral valve surgery [105].
Whether the risk of AF is different for On-pump versus off-pump CABG is still contentious. Murphy reported a lower incidence of AF after off-pump than on-pump CABG [106] , while Topal found that on-pump no significant difference as long as the operating time did not exceed a certain duration [107].
The association between the duration of aortic cross-clamp and the risk postoperative AF also remains controversial. Mathew proposed that the risk was increased by prolonged cross-clamp [108], an observation contradicted by the study of Salaria el al [109].
Postoperative Risk Factors
Many studies have considered the association of inflammation with the occurrence of postoperative AF [110-113]. C-reactive protein (CRP) is the classic acute phase reactant. During severe inflammation or infection, its blood levels may increase up to 500 times to 1,000 times above normal. The reason why inflammation markers in atrial fibrillation may become high after CABG is a puzzling problem. The peak levels of C-reactive protein (CRP) were paralleled to the incidence of postoperative AF. In the general population, CRP was also higher in patients with AF than those who do not develop [114]. The reported efficacy of anti-inflammatory drugs such as steroids in the prevention of AF supports the association between AF and inflammation [115]. However, Ahlsson found that postoperative AF has no correlation to CRP level in heart surgery patients [116].
Postoperative pneumonia and mechanical ventilation for more than 24 hours have been shown to be independent postoperative predictors of AF [75]. Another study reported that
![Table 1.1 Baseline Characters of Patients of Study Population Mathew [ 77 ] Zaman [100] Amar [104] Auer [80] Age(mean, SD), years AF Non-AF 67.8(8.2, n=976) 61.8(9.8, n=2117) (p<0.0005) 65.9(n=92) 61.7(n=234) (p<0.0001) 68(9,n=508) 6](https://thumb-eu.123doks.com/thumbv2/123doknet/2073692.6728/34.918.127.812.152.1070/table-baseline-characters-patients-study-population-mathew-zaman.webp)