THE 19TH INTERNATIONAL CONFERENCE ON COMPOSITE MATERIALS
Abstract
The cost of manufacturing textile-reinforced composite aerostructures using Resin Infusion under Flexible Tooling (RIFT) can be reduced by computational modelling. This paper outlines the current progress and contributions made towards this goal.
A continuum-based material model was incorporated into a finite element package to simulate the draping of a dry carbon fibre fabric. It accurately tracks the changes in the warp and weft fibre orientations and has been experimentally validated. Material characterisation was performed to determine the tensile and shear properties of a plain weave fabric reinforcement material. In support of bias extension shear testing, an accessible Digital Image Correlation (DIC) approach was developed for accurate optical strain measurement. A relationship between permeability and shear angle was also experimentally determined using a novel permeability measurement technique.
Future work is planned to combine all these aspects in an infusion model and demonstrate the complete process model.
1 Introduction
The increasing use of composite materials in primary aircraft structures is driving demand for large and highly integrated parts in commercial aircraft. Resin Infusion under Flexible Tooling (RIFT) is an attractive process for these applications, as only one tool surface is required and it can be performed out-of-autoclave [1]. Textile
reinforcement materials provide the ideal resilience and formability to be paired with liquid composite moulding techniques like RIFT, and are hence the focus of this research.
The RIFT process is not without its drawbacks however, with reliability and repeatability seen as problematic in the aerospace industry. This is because the process continues to rely on skilled and experienced operators, in what is essentially a trial and error approach. Therefore it is becoming desirable to simulate the process to overcome this problem and reduce the amount of wasted time and material on failed attempts.
The simulation of the RIFT process can be broken down into two major stages: draping, where dry reinforcement material is formed into the part shape; and infusion, where resin is drawn into the material and subsequently left to cure under pressure. Each stage has separately seen considerable study, though there have still been only limited attempts to create a complete process model for liquid composite moulding techniques such as RIFT [2].
The effectiveness of a draping model is generally judged by how realistically it simulates the reorientation of yarns during deformation. The angular reorientation of warp and weft yarns relative to their undeformed state is known as the shear angle, γ, as illustrated in Fig. 1. This is the most appropriate parameter for monitoring shear deformation in textiles.
Kinematic simulation methods, such as the pin-jointed net and fishnet methods [3][4], were among the earliest approximations used, but these lack sophistication when it comes to complex geometries,
CONTRIBUTIONS TO THE PROCESS MODELLING OF
RESIN INFUSION UNDER FLEXIBLE TOOLING (RIFT)
MANUFACTURING FOR COMPOSITE
AEROSTRUCTURES
R.S. Pierce
1*, B.G. Falzon
2, M.C. Thompson
1, R. Boman
3 1Department of Mechanical and Aerospace Engineering, Monash University, Melbourne,
Australia,
2Department of Mechanical and Aerospace Engineering, Queen’s University, Belfast,
United Kingdom,
3Aerospace and Mechanical Engineering Department, University of Liege,
Belgium
* Corresponding author (robert.pierce@monash.edu)
and often fail for bridged or concave part sections. On the other hand, highly detailed discrete and semi-discrete models have been developed with considerable success [5][6][7], often replicating the behaviour of individual fibres or yarns with simple elements. Continuum models are also showing a high degree of accuracy [8][9][10], despite the homogenisation of the complex fabric architecture compared with the discrete models.
a) b)
Fig. 1. a) Undeformed and, b) deformed representations of a plain weave material and the
definition of shear angle.
Regardless of the drape modelling approach, material characterisation is necessary in order to simulate the material behaviour realistically, and is integral to a successful model. For detailed discrete models this may mean the determination of yarn or even individual fibre properties, coupled with an approximation of contact behaviour. Though for continuum methods, as the textile reinforcements are homogenised into sheets, only more generalised tensile and shear properties need to be characterised. For the infusion stage of the RIFT process, simulation provides a means of predicting the flow of resin through a complex layup. Otherwise, in order to come up with an effective infusion strategy, extensive experimental testing is required. Currently there are several infusion models achieving relative success [11][12], though to achieve realistic results, properties such as fluid viscosity and fabric permeability need to be characterised. Viscosity is easily measured with the appropriate equipment such as a rotational viscometer. Permeability on the other hand, has no standardised characterisation method for fabric reinforcement materials. This is due to complications resulting from anisotropy, combined viscous and capillary flow effects, stochastic geometries and nesting variations in multiple ply layups. Consequently, as highlighted by a recent benchmarking exercise, results from experimentally similar tests in different labs can show an order of magnitude difference [13].
A further consideration is that the permeability of the fabric material changes locally during draping, as yarns re-orient themselves under shear deformation. Studies have quantified this variation in permeability over the range of possible shear angles to be greater than 50% in some fabrics [14][15][16]. Thus it is important to couple the draping model results with the infusion simulation through the characterisation of material permeability over a range of shear angles.
This paper describes the progress and current contributions towards the creation of a complete process model under this project, highlighting developments in material characterisation and permeability testing.
2 RIFT Process Modelling
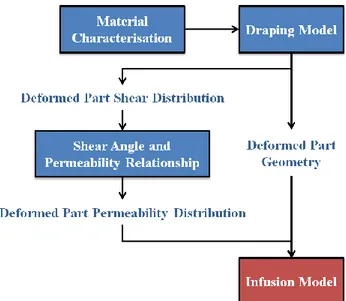
In order to create a complete process model for RIFT manufacturing, four key areas of research have been identified: the draping model, the supporting material characterisation, the shear angle and permeability relationship and the infusion model. The interaction of these components is visualised in Fig. 2.
Fig. 2. Flow chart for the full RIFT process model. Material characterisation provides greater realism to the draping model, such that an accurate part geometry and shear distribution can be predicted for a complex layup. By establishing a relationship between shear deformation and permeability in a textile reinforcement material, the shear distribution that results from the draping model can be converted into a permeability distribution. This can then be combined with the deformed part geometry and fed
Undeformed Weft yarns Warp yarns Deformed α β Shear angle: γ = α + β
into the infusion model to simulate the final stage of the RIFT process, and ultimately evaluate a potential infusion strategy.
At this stage, the first three major segments of this work have been performed, with only the development and implementation of the infusion model still to be completed under this project.
3 Drape Modelling
During RIFT manufacturing, draping is the preliminary stage for forming the fabric reinforcement into the desired shape. Hence it is particularly important to model this deformation accurately as all subsequent stages of the process rely on the results. In order to realistically simulate the material behaviour, the model needs to be able to accurately predict the reorientation of yarns during draping, and calculate shear angles. For these materials, deformation is dependent on the tensile and shear properties of the fabric.
A hypoelastic continuum method has been implemented, including a customised VUMAT material subroutine within Abaqus [17], based on those presented by other researchers [9][18]. This choice was made due to the accuracy and efficiency of continuum-based finite element approaches. The model has been developed for Abaqus/Explicit due to the degree of geometric and material non-linearity present in draping, where implicit solvers become inefficient.
Within the model, layers of fabric material are treated as continuous sheets of membrane elements (M3D4R), where the intricate effects of the underlying fabric architecture are incorporated as complex material behaviour in the VUMAT subroutine. An assumption is made on the independence of yarn tensile properties from the shear response of the fabric material, though both properties are able to be defined as non-linear functions. The material subroutine requires the definition of the constitutive model and tracks the non-orthogonal yarn orientations during deformation based on the orthogonal, planar strains and deformation gradient tensor available from Abaqus. The fundamental theory, on which the material subroutine is based, is described in detail by Peng et al. [19].
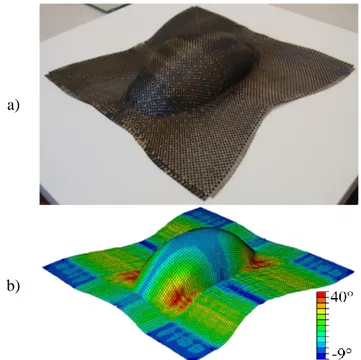
An ‘elbow’ shaped part has been modelled to demonstrate the draping model (shown in Fig. 3). Here it can be seen that the deformation in the model appears to agree well with a hand layup, and produces a complex shear distribution ranging from -9° to 40° based on the material properties determined in the following section of this paper.
a)
b)
Fig. 3. a) Experimental and, b) modelled draping of material over an ‘elbow’ shaped part (with contours
representing the shear angle distribution).
Fig. 4. Comparison of material draw-in from experimental and modelling results for one corner of
In Fig. 4 the simulated profile for one corner of the fabric edge is compared to results from experimental draping. The VUMAT subroutine model can be seen to accurately predict the draw-in of the material. A similar model was run without tracking fibre directions, simplified to a purely orthogonal basis. As it can be seen in Fig. 4, this orthogonal model is not as successful: underestimating the material draw-in in the edge regions most affected by shearing (as seen in Fig. 3).
Further quantitative analysis of the draping model has been performed by replicating work from published literature [9][10]. For both ‘hemispherical’ and ‘double dome’ cases, the presented model showed very good agreement with the experimental and simulation results provided.
4 Material Characterisation
In support of the draping model, characterisation of the fabric reinforcement provides a measure of the realistic material behaviour for simulation. As the tensile and shear properties of woven fabrics are the most important to the draping process, the VUMAT subroutine requires definition of warp and weft tensile moduli, E1 and E2, and the in-plane shear modulus, G12.
To this end, appropriate test methods have been developed for both tensile and shear testing of fabric reinforcement materials. Specifically for this project, an aerospace grade, carbon fibre, plain weave fabric with 3K tows and a 0.193 kg/m2 areal density has been used. However, the testing and modelling process employed is applicable for any woven fabric reinforcement material with a repeatable geometry. There are a number of challenges in testing textile materials, primarily the loose nature of the material that facilitates unravelling, fraying and yarn slippage during handling. Cutting and mounting of material samples must be performed with great care in order to preserve the state of the fabric architecture and yarn orientations prior to testing. Due to these complications, and the complexity of the material itself, there is a general lack of standardisation in the field, and a variety of competing experimental techniques are commonly used to determine both properties.
4.1 Tensile testing
4.1.1 Tensile test method
Due to the nature of the fabric reinforcement material, standard tensile coupon tests are not applicable and alternative methods need to be employed. As previously noted, these materials are prone to damage and deformation during handling. However, there are also further challenges specific to tensile testing. For carbon fibre fabrics in particular, tensile loads are high, meaning that correspondingly high clamping forces are required to prevent test specimen slippage. There are a few competing approaches, though relatively complex biaxial testing is popular for tensile property characterisation due to the interaction between the warp and weft yarns of a fabric [20]. Even though uniaxial tensile test methods do not account for this crimp interchange, in the absence of any standardised biaxial tests, the ASTM tensile ‘strip’ standard [21] has been employed.
Under the standard specifications, tensile samples were cut to have a 75 × 75 mm gauge area with a 25 × 50 mm clamping section above and below. Subsequently yarns were removed from the free edges of the gauge area such that only the vertical yarns within the clamping width of the specimen remained. This ‘ravelling’ process ensured that the yarns being loaded were less influenced by edge effects and that transverse yarns did not slip out from the longitudinal yarns under loading. The width of the gauge section meant that testing was performed across 13 yarns in each sample.
Samples were cut in both the 0° and 90° orientations to ensure that both warp and weft fibre directions were tested. Testing of the samples was conducted on an Instron 4505 frame with updated 5500R electronics, using a 5 kN load cell under a 0.5 mm/min constant rate of extension.
4.1.2 Strip test results
The tensile strip tests were successful as the clamps used to hold specimens (shown in Fig. 5) prevented any slippage from occurring. From Fig. 6 it can be seen that the tensile modulus of fabric samples is initially non-linear up to 0.002 strain, after which it tends towards a linear 15 GPa for both 0° and 90° specimens. This early non-linearity can be explained by the de-crimping of longitudinal yarns, i.e., straightening from their initially undulating configuration under loading. Once straight, the full
tensile strength of these longitudinal yarns provides the steep and near linear behaviour expected from carbon fibres. As seen in Fig. 5, the straightening of these longitudinal yarns consequently increases the waviness of the transverse yarns, such that they splay out alternatively at the free edges.
a) b)
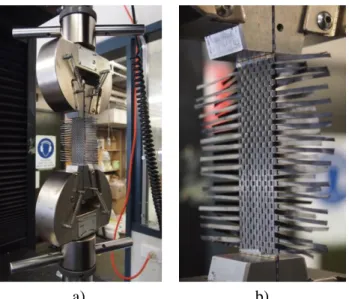
Fig. 5. a) Tensile strip test and, b) close up view.
Fig. 6. Tensile stress-strain curves from experimental strip testing.
4.2 Shear testing
4.2.1 Shear test method
The shear behaviour of fabric reinforcement materials tends to be highly non-linear under relatively low loading. This is due to a finite trellising behaviour of the warp and weft yarns, after
which yarns become ‘locked’ and resistance to shear deformation greatly increases. Since shearing loads are so small in the undeformed state, mechanical tests are particularly sensitive to manual handing, which poses further difficulty in the selection of an appropriate method.
One shear testing approach is the Kawabata simple shear test [22], though it is typically limited to a lower range of shear deformation [23]. Alternatively, the ‘picture frame’ test has seen greater success, where square or cruciform shaped samples are clamped into a deformable diamond shaped rig [24]. This test method often requires a complex set-up for which fabric samples can be difficult to clamp and align [25]. A third method, the ‘bias extension’ test, shows similar capability to the ‘picture frame’ approach and operates in the same fashion as uniaxial tensile tests. However, rectangular samples are cut and oriented in the ‘bias’ direction, such that the warp and weft yarns are ±45° relative to the loading direction.
Despite work by an international collaborative effort to establish benchmarks [26], there remains no standardised method for the shear testing of fabric materials. With the majority of literature recommending either the picture frame or the bias extension test, the latter was selected due to the simplicity of the requisite rig.
Similar to the tensile testing, shear testing was performed with a Constant Rate of Extension (CRE) control. However, as a higher resolution and accuracy was desired for lower loads, testing was performed on an Instron 5948 MicroTester machine with a 100 N load cell. A loading rate of 10 mm/min was used for these tests, as is common, since results are generally rate independent [27]. The gauge area of specimens was 50 × 100 mm, facilitating a central diamond region comprising 18 × 18 yarns as shown in Fig. 7.
4.2.2 Optical strain measurement
Though the method appears to be relatively basic, it can be particularly difficult to measure shear deformation in the bias extension test, as the sample is not entirely sheared uniformly. Historically this was a major issue and theoretical calculations, purely based on the ideal experimental kinematics, had to be used. With the current availability of
digital imaging though, mechanical test methods are increasingly incorporating optical strain measurement techniques. Digital Image Correlation (DIC) is one such technique that has been employed to overcome the shortcomings of the bias extension test method, and provides greater accuracy to the experimental measurement of shear.
Typically specialised software and cameras are used for calculating strain with DIC, however a Matlab code has been developed in-house that correlates concurrent images from a sequential series taken during mechanical testing. A grid of ‘correlation points’ are tracked from image to image, enabling the measurement of nodal displacements. This changing grid is used to form isoparametric, bi-quadratic, nine-node elements for which the deformation gradients are calculated. Using a method of polar decomposition and a non-orthogonal basis that tracks yarn directions (similar to the material subroutine in the draping model) the shear angle is determined. This code is available on the MathsWorks File Exchange website [28] and was based on a package for axial strain DIC developed by Cristoph Eberl [29].
4.2.3 Bias extension results and determination of the shear modulus
In order to evaluate the validity of the DIC results, values were compared with manually measured shear angles from the images taken during bias extension testing. As can be seen in Fig. 8, the DIC results showed very good agreement with measured values of shear angle. It should be noted that once shear locking was observed above 50°, the manual measurement of shear angles became susceptible to an error of ±2° as yarn orientations became difficult to distinguish with the human eye.
Raw loading and extension data from mechanical testing was coupled with the shear angle data from DIC in order to determine an appropriate curve for the shear modulus as a function of shear angle. This data was employed for theoretical calculations in an idealised case; assuming shear angle to be uniform in each region, with no shear in the triangular regions adjacent to the clamps. The shear angle in the central diamond region was also assumed to be twice that of the triangular zones that are between the central and clamped zones.
A shear force, normalised by central shear zone edge length, can be calculated and expressed in terms of
shear angle, γ, loading force, F, specimen gauge height, H, and gauge width, W, according to theory outlined by Cao et al. [26].
(1)
Though, since Eq. 1 is a function of the half shear angle, it becomes an iterative process to calculate the full range of force-shear curves based on the initial assumption in Eq. 2.
(2)
Subsequent values of shear force at half shear angle are simply interpolated between known values. Then to calculate the shear stress, the normalised shear force needs to be multiplied by the edge length of the central shear zone, and divided by its area as shown in Eq. 3. (3)
Lastly, an exponential function was fitted to this curve and differentiated to find the theoretical tangent shear modulus function based on experimental force and shear angle data (Eq. 4).
(4)
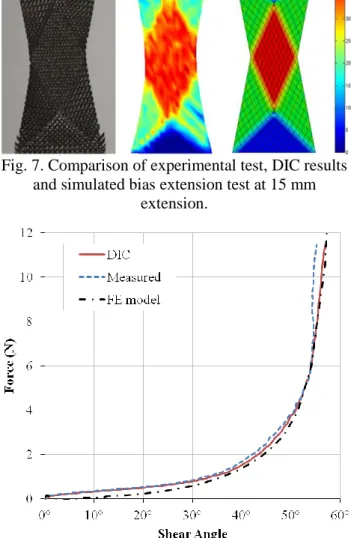
In order to validate this shear modulus for modelling purposes, a simulation of the bias extension test was conducted using the draping model with these experimentally determined material properties. Although the model is not able to replicate yarn slippage, the results show very good agreement with the experimental results shown in Fig. 8. Also, qualitatively the comparison shown in Fig. 7 reveals good agreement between the experimental DIC results and the modelling results at 15 mm extension, where both are shown on the same contour scale.
Fig. 7. Comparison of experimental test, DIC results and simulated bias extension test at 15 mm
extension.
Fig. 8. Plot of measured, DIC and FE model curves of force against shear angle for bias extension.
5 Permeability and shear angle relationship 5.1 Experimental approach
With a draping simulation that can accurately track yarn orientations and predict the shear angle distribution across an entire part, these results need to be translated to a distribution of permeability for subsequent infusion modelling. This is done by relating shear deformation in the fabric material with permeability change. In order to quantify this link over a range of shear angles, two approaches are possible: experimental permeability characterisation or predictive permeability modelling.
Despite extensive study in the area over the years, there are no standardised methods to experimentally determine permeability for textile reinforcements.
Recent efforts to benchmark common approaches ultimately found that tests carried out under similar conditions exhibited significantly scattered results [13]. Predictive methods, on the other hand, are relatively new and still rely on supportive experimental tests for validation. Hence, an experimental approach has been undertaken for this research.
Even though linear flow experiments are generally considered to exhibit less variability[30], an unsaturated radial flow experiment is preferred since the principal permeability directions are not known prior to testing at the various shear angles. This approach also allows for the collection of more data from a single test, facilitating permeability calculations in every direction to better describe the anisotropic flow.
Experiments were run under a constant injection pressure, rather than a constant inlet velocity, because the latter approach often requires unreasonably high pressure gradients. For this study the pressure differential across the system was imposed by drawing a vacuum at the outlet, with an oil reservoir open to ambient conditions. The permeability test set-up is shown in Fig. 9, where it can be seen that the test sample was sandwiched between a glass plate and a polycarbonate caul plate, with white breather cloth placed around the periphery to ensure an even vacuum within the test cavity.
Single plies of the plain weave carbon fibre fabric were tested in batches of at least six samples at various shear angles from 0° to 40° (where the natural shear locking state of the fabric occurs at around 45°-50°). Through-thickness flow and gravitational effects were neglected since the perform was only one ply thick, and testing was considered solely in 2D. Samples were 300 × 300 mm in their undeformed configuration, and the circular inlet port was 6 mm in diameter to minimise the effects of a circular inlet on an elliptical flow front [31]. The fluid used for these tests was a Newtonian oil, assumed to be incompressible, isothermal and chemically inert for the duration of the permeability tests.
Fig. 9. Vacuum assisted permeability test.
5.2 Permeability calculation
The primary measurements from testing were taken with a digital video camera from below the glass plate with the radial flow pattern recorded as a function of time. This method was used in preference over alternative sensor methods that are often more difficult to set up, yield limited data, and may even negatively influence fluid flow through the test cavity [31]. As discussed in the literature [13], alternative measurement techniques can use fibre optic sensors, thermistors, pressure transducers, ultrasound, or electrical resistance measurements. However using digital video does not require prior knowledge of the principal permeability directions, and also provides greater flexibility in post processing and analysis, since the full field of flow front data, as a function of time, is readily available. Video from the experiments were processed to track the advancing flow front in all directions. Based on the theory discussed by Weitzenböck et al. [31][32] this allowed the calculation of permeability for every direction, , rather than a finite few (Eq. 5).
(5)
Where is the fluid viscosity, is the material porosity, is the pressure gradient and is the linear regression of the term against time, defined in Eq. 6.
(6)
Here is the flow front radius in the ‘i’ direction and is the inlet radius.
The video processing and subsequent calculations were automatically performed within a novel Matlab script that has been developed in-house to produce a radial permeability distribution.
5.3 Permeability and shear angle results
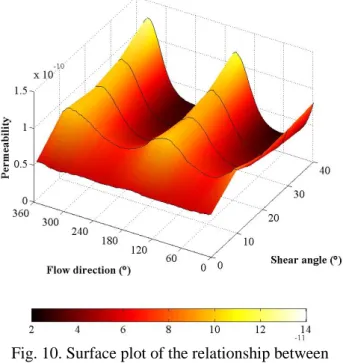
The relationship between shear angle, flow direction and permeability shown in Fig. 10 reveals a near isotropic state at 0° shear angle as is expected for a balanced plain weave fabric. Anisotropy then increases with shear angle, until there is a factor of five difference between principal permeability values at 40° shear.
For each shear angle tested, local maxima and minima represent the principal permeability values, K1 and K2 respectively. From Fig. 10, the principal permeability directions are clearly seen to be consistent for every shear angle. Permeability values at 10° shear are seen to increase for all flow directions which appears to contradict the trend of K1 values increasing and K2 values decreasing from the 0° shear isotropic state with increasing shear angle.
Fig. 10. Surface plot of the relationship between shear angle and permeability for various flow
directions. Fluid inlet Vacuum outlet Breather cloth Caul plate Glass plate
6 Discussion
The tensile strip test method undertaken in this work assumes that the warp and weft yarn properties are independent. However, it is known that this is not the case in reality. Biaxial testing is one way to compensate for the interaction between the yarns, though it requires more exhaustive testing of the material under a range of different loading ratios, or some form of predictive modelling [33]. Though this is quite significant for processes such as thermoforming, the effect of this interaction is expected to be minimal in RIFT manufacturing. The use of the bias extension test for shear characterisation has been employed primarily for its relative simplicity. However, the picture frame test could easily be used instead, with only minor changes necessary for the DIC code that has been developed in-house. This would help overcome any concerns with slippage that occurs in the later stages of bias extension testing, but might introduce issues with pre-tensioning, clamping and alignment. More recently, there has even been biaxial bias extension testing performed to look at the coupling of shear and tensile properties [34], which may be worth pursuing.
In the experimental characterisation of permeability, work concentrated on single ply tests as they are expected to show better repeatability than those with multiple plies. Thicker samples introduce nesting, gravitational and 3D flow effects which are likely to produce a greater scatter in results between similar tests. Results presented in this work were found to be quite repeatable, however the trend of increasing permeability with increasing shear angles appears to be contrary to much of the literature [15][16]. This is due to the relatively high porosity in a single ply of the plain weave material. It is hypothesised that the alignment of yarns at higher shear angles facilitates not only capillary flow but also aligns ‘channels’ for flow in these directions, which may actually be closed off in materials with a lower porosity. However, the aim of much of the presented work at this stage has been more a demonstration of process capability.
As the ultimate goal of this project is to create a process model capable of minimising experimental testing during part development, it may also be worth pursuing predictive modelling methods for
characterising tensile, shear and permeability properties in the future.
7 Conclusion
With the aim of producing a complete predictive model for Resin Infusion under Flexible Tooling (RIFT), work has been contributed to several key areas.
A successful continuum-based draping model was implemented, including a hypoelastic and non-orthogonal material subroutine that accurately tracks fibre directions during deformation. In support of this model, the tensile modulus of a plain weave carbon fibre fabric has been characterised through uniaxial ‘strip’ testing. Bias extension shear characterisation has also been performed using a Digital Image Correlation approach for optical strain measurement that has been developed in-house. Similarly, a novel approach for flow front tracking and the calculation of permeability has also been developed in Matlab for experimental permeability testing. This approach has been used to determine the relationship between shear angle, permeability and flow direction in the same carbon fibre plain weave material.
Work is planned to ultimately combine all these aspects into an infusion model for the RIFT process.
References
[1] Christopher Williams, John Summerscales, and Stephen Grove, "Resin Infusion under Flexible Tooling," Composites: Part A, vol. 27, no. 7, pp. 517-523, 1996.
[2] S V Lomov, D Ivanov, and I Verpoest, "Predictive models for textile composites," in 7th Textile
Science International Conference, Liberec, 2010.
[3] C Mack and H Taylor, "The fitting of woven cloth to surfaces," Journal of the Textile Institute, vol. 47, pp. 477-488, 1956.
[4] F Van Der Ween, "Algorithms for draping fabrics on doubly curved surfaces," International Journal
for Numerical Methods in Engineering, vol. 31, pp.
1414-1426, 1991.
[5] D Jauffrès, K Fetfatsidis, C Morris, J A Sherwood, and J Chen, "Mesoscopic finite element modelling of woven reinforcements applied to sheet moulding compound forming simulation," in 17th International Conference on Composite Materials,
Edinburgh, 2009.
[6] D Durville, "Simulation of the mechanical behaviour of woven fabrics at the scale of fibres,"
International Journal of Material Forming, vol. 3
(Suppl 2), pp. S1241-S1251, 2010.
[7] N Hamila, P Boisse, F Sabourin, and M Brunet, "A semi-discrete shell finite element for textile composite reinforcement forming simulation,"
International Journal for Numerical Methods in Engineering, vol. 79, pp. 1443-1446, 2009.
[8] R H W ten Thije, R Akkerman, and J Huétink, "Large deformation simulation of anisotrpoic material using an updated Lagrangian finite element method," Computer methods in applied mechnics
and engineering, vol. 196, pp. 3141-3150, 2007.
[9] M A Khan, T Mabrouki, E Vidal-Sallé, and P Boisse, "Numerical and experimental analyses of woven composite reinforcement forming using a hyposelastic behaviour. Application to the double dome benchmark," Journal of Materials Processing
Technology, vol. 210, pp. 378-388, 2010.
[10] X Peng and F Ding, "Validation of a non-orthogonal constitutive model for woven composite fabrics via hemispherical stamping simulation," Composites:
Part A, vol. 42, pp. 400-407, 2011.
[11] M K Kang, W I Lee, and H T Hahn, "Analysis of vacuum bag resin transfer moulding process,"
Composites: Part A, vol. 32, pp. 1553-1560, 2001.
[12] N C Correia et al., "Analysis of the vacuum infusion moulding process: I. Analytical formulation,"
Composites: Part A, vol. 36, pp. 1645-1656, 2005.
[13] R Arbiter et al., "Experimental determination of the permeability of textiles: A benchmark excercise,"
Composites: Part A, vol. 42, pp. 1157-1168, 2011.
[14] C C Wong et al., "Comparisons of novel and efficient approaches for permeability prediction based on the fabric architecture," Composites: Part
A, vol. 37, pp. 847-857, 2006.
[15] F Loix, P Badel, L Orgéas, C Geindreau, and P Boisse, "Woven fabric permeability: From textile deformation to fluid flow mesoscale simulations,"
Composites Science and Technology, vol. 68, pp.
1624-1630, 2008.
[16] B Verleye, S V Lomov, A Long, and D Roose, "Permeability prediction for the meso-macro coupling in the simulation of the impregnation stage of Resin Transfer Moulding," Composites: Part A, vol. 41, pp. 29-35, 2010.
[17] Dassault Systèmes Simulia Corp. (2011) Abaqus
6.11. [Online].
http://www.3ds.com/products/simulia/portfolio/abaq us/overview/
[18] X Peng and Z U Rehman, "Textile composite double dome stamping simulation using non-orthogonal constitutive model," Composites Science
and Technology, vol. 71, pp. 1075-1081, 2011.
[19] X Q Peng and J Cao, "A continuum mechanics-based non-orthogonal consitutive model for woven composite fabrics," Compoisites: Part A, vol. 36, pp. 859-874, 2005.
[20] P Boisse, A Gasser, and G Hivet, "Analyses of fabric tensile behaviour: determination of the biaxial tension-strain surfaces and their use in forming simulations," Composites: Part A, vol. 32, pp. 1395-1414, 2001.
[21] ASTM International, "Standard Test Method for Breaking Force and Elongation of Textile Fabrics (Strip Method)," ASTM D5035-11, 2011.
[22] S Kawabata, The standardization and analysis of
hand evaluation, 2nd ed. Osaka, Japan: The Textile
Machinery Society of Japan, 1980.
[23] J Wang, J R Page, and R Paton, "Experimental investigation of the draping properties of reinfocement fabrics," Composites Science and
Technology, vol. 58, pp. 229-237, 1998.
[24] M F Culpin, "The shearing of fabric: a novel approach," Journal of the Textile Institute, vol. 70, pp. 81-88, 1979.
[25] P Harrison, M J Clifford, and A C Long, "Shear characterisation of viscous woven textile composites: a comparison between picture frame and bias extension experiments," Composites
Science and Technology, vol. 64, pp. 1453-1465,
2004.
[26] J Cao et al., "Characterization of mechnaical behaviour of woven fabrics: Experimental methods and benchmark results," Composites: Part A, vol. 39, pp. 1037-1053, 2008.
[27] B Zhu, T X Yu, and X M Tao, "Large deformation and slippage mechanism of plain woven composite in bias extension," Composites: Part A, vol. 38, pp. 1821-1828, 2007.
[28] Robert S Pierce. (2012, December) Shear Strain DIC (for Bias Extension tests) - File Exchange -
MATLAB Central. [Online].
http://www.mathworks.com.au/matlabcentral/fileex change/39544-shear-strain-dic-for-bias-extension-tests
[29] Christoph Eberl. (2010, Nov) Digital Image Correlation and Tracking - File Exchange -
MATLAB Central. [Online].
http://www.mathworks.com.au/matlabcentral/fileex change/12413-digital-image-correlation-and-tracking
[30] Sanjay Sharma and Dennis A Siginer, "Permeability measurement methods in porous media of fiber reinforced composites," Applied Mechanics Review, vol. 63, March 2010.
[31] J R Weitzenböck, R A Shenoi, and P A Wilson, "Radial flow permeability measurement. Part A:
Theory," Composites: Part A, vol. 30, pp. 781-796, 1999.
[32] J R Weitzenböck, R A Shenoi, and P A Wilson, "Radial flow permeability measurement. Part B: Application," Composites: Part A, vol. 30, pp. 797-813, 1999.
[33] Giles Hivet and Philippe Boisse, "Consistent mesoscopic mechanical behaviour model for woven composite reinforcements in biaxial tension,"
Composites: Part B, vol. 39, pp. 345-361, 2008.
[34] P Harrison, F Abdiwi, Z Guo, P Potluri, and W R Yu, "Characterising the shear-tension coupling and wrinkling behaviour of woven engineering fabrics,"