UNIVERSITÉ DU QUÉBEC À MONTRÉAL
V ARIA TION PHÉNOTYPIQUE DE COPÉPODES À TRA VERS DES GRADIENTS ABIOTIQUES ET BIOTIQUES AU NIVEAU DU PAYSAGE
THÈSE PRÉSENTÉE
COMME EXIGENCE PARTIELLE DU DOCTORAT EN BIOLOGIE
PAR
JORGE OCTAVIO NEGRIN DASTIS
C
UNIVERSITÉ DU QUÉBEC À MONTRÉAL Service des bibliothèques
Avertissement
La diffusion de cette thèse se fait dans le respect des droits de son auteur, qui a signé le formulaire Autorisation de reproduire et de diffuser un travail de recherche de cycles supérieurs (SDU-522 - Rév.07-2011 ). Cette autorisation stipule que «conformément à l'article 11 du Règlement no 8 des études de cycles supérieurs, [l'auteur] concède à l'Université du Québec à Montréal une licence non exclusive d'utilisation et de publication de la totalité ou d'une partie importante de [son] travail de recherche pour des fins pédagogiques et non commerciales. Plus précisément, [l'auteur] autorise l'Université du Québec à Montréal à reproduire, diffuser, prêter, distribuer ou vendre des copies de [son] travail de recherche à des fins non commerciales sur quelque support que ce soit, y compris l'Internet. Cette licence et cette autorisation n'entraînent pas une renonciation de [la] part [de l'auteur] à [ses] droits moraux ni à [ses] droits de propriété intellectuelle. Sauf entente contraire, [l'auteur] conserve la liberté de diffuser et de commercialiser ou non ce travail dont [il] possède un exemplaire.»
REMERCIEMENTS
"To be surprised and to marvel i_s to begin to understand"
- José Ortega y Gasset
This work would not have been accomplished without the constant support, motivation and encouragement of numerous people. Firstly, I want to thank my main supervisor, Alison Derry, for her attentive guidance and constant support during these last five years. I wish to acknowledge my appreciation for her ability to challenge me to always think outside of the box, to be consistent, and to drive my perspectives towards new limits. Before starting my PhD program, I was told that a great
supervisor can be the determining factor in achieving both a scientifically productive and enjoyable career. I can attest to the truth of these words now more than ever.
It has also been an immense pleasure to be a part of the interdisciplinary and dynamic UQAM-GRIL interuniversity research group for all these years, and for the funding and research support provided. I am very fortunate to have benefited
intellectually through their symposia, seminars, workshops and courses, as well as socially through interactions in student meetings and gatherings. W orking alongside such an extraordinary group of researchers has not only enriched and widened my ecological knowledge of freshwater aquatic ecosystems overall, but it has also given me a more holistic vision of the complex physical and geo-chemical processes operating with and between lakes ocurring across various biogeographical regions.
I would particularly like to thank the members of my lab: Cristina Charette, Marilyne Robidoux, Anthony Merante, Gillian Martin, Nathalie Westwood, Louis Astorg, Stéphanie Guemon, and stagiaires Louis Donelle, Maëva Latour, Bryan
111 Baptifoy, Margot Angibaud and Emmanuel Dodier, for their friendship and
extraordinary support both in the lab and in the field. I want to also thank Dylan Fraser and Matthew Y ates for their advice and collaboration in the field, as well as Dave Shepherd and Julie Capplemap. at the wonderful Green house in Newfoundland. I also want to thank Katherine V elgue, Alice Parkes and Pierre Carrier-Corbeil for their brilliant guidance and assistance in the lab. I also want to thank dearly Juan Pablo Ni:fio Garcia, Shoji Tottathil, Nicolas Fortin St-Gelais, Maxime Wauthy, Carolina Garcia Chavez, Dominic Vachon, Annick St.;.Pierre, Ming Feng Li, Jean-Francois Lapierre, Clara Ruiz Gonzalez, Cynthia Soued, Sara Mercier-Blais, Terhi Rasilo, Adam Heathcote, Tonya delSontro, Matthew Bogard, Ryan Hutchins, Karelle Desrosiers, Richard Vogt, Trista Vick-Majors, Sophie Crèvecoeur, Martin Demers, Paula Campos Reis, Ji-Hyeon Kim, Pierre-Olivier Benoit, Serge Paquet and Marie-Claude Perron.
I have also had the enriching opportunity to teach a wide array of courses within the UQAM-Departement des Sciences Biologiques, alongside Dan Kneeshaw, Beatrix Beisner, Paul delGiorgio, Dolors Planas, Yves Prairie, Éric Lucas, David Bird, Francois Dragon, Bruno Frechette, Olivier Aubry, Francois Dumont and William Vickery. I wish to thank these professionals for an excellent experience working together and for their excellent course delivery every step of the way. I also want to thank Daniel Rivest, Denis Flipo, Luc Dubé, Sylvain Dallaire and Simon Paradis for providing me with excellent technical laboratory assistance during my delivery of these courses in the laboratory and field. Finally, I would like to
acknowledge Maude Ethier Chiasson and Zakia Chérif of the administrative team at the UQAM-Department des Sciences Biologiques, for their administrative and technological support respectively.
I wish to infinitely thank my loving wife Karla Anne Green and son Gabriel David Negrfn Dastis, bom during my PhD program, for enriching my life and for helping me navigate the ups and downs of an intense research programme.
DÉDICACE
This work is dedicated to my Canadian and Europe an family, who relentlessly and blindly supported me throughout this entire process, and most important/y deeply believed, inspired and stimulated me immense/y,
TABLE DES MATIÈRES
LISTE DES FIGURES ... viii
CHAPITRE I ... ix
CHAPITRE II ... xi
CHAPITRE III ... xii
LISTE DES TABLEAUX ... XV CHAPITRE I ... xvi
CHAPITRE II ... ~ ... xvii
CHAPITRE III ...•... xviii
RÉSUMÉ ... xix
ABSTRACT ... xxi
INTRODUCTION ... 1
0.1 Ma/adaptation ... 4
O. 2 The regional landscape context and its role in determining ma/adaptation ... 5
O. 3 The role of abiotic and biotic ecological gradients ... 10
0.4 Zooplankton plasticity, adaptation and traits ... 13
O. 6 Metapopulation ... 18
O. 7 The importance offatty acids in aquaticfoodwebs ... 19
O. 8 Study system ... ·. 20
CHAPITRE I THE IMPACT OF REGIONAL LANDSCAPE CONTEXT ON LOCAL MALADAPTIVE TRAIT DIVERGENCE: A FIELD TEST USING FRESHW ATER COPEPOD ACID TOLERANCE ... 24
1.1 Introduction ... 25
1.2 Methods ... 3 0 1.3 Results ... 41
Vl
1.4 Discussion ... · ... 48.
CHAPITRE II ASYMMETRY IN SELECTION AND THE EFFECT OF CONNECTIVITY ON MALADAPTIVE PHENOTYPE-ENVIRONMENT MISMATCH AMONG COPEPOD POPULATIONS IN STABLE AND FLUCTUATING ENVIRONMENTS ... 54
2.1 Introduction ... 55
2.2 Methods ... : ... 59
2.3 Results ... 67
2.4 Discussion ... 72
CHAPITRE III A FISH-MEDIATED TROPHIC CASCADE ON FRESHW ATER CALANOID COPEPOD ABUNDANCE IS CONCEALED BY FOOD WEB F ATTY ACID A V AILABILITY, FUNCTIONAL TRAITS AND POPULATION SEXRATIO ... 75 3.1 Introduction ... 76 3.2 Methods ... 78 3.3 Results ... 86 3 .4 Discussion ... 94 3.5 Conclusion ... 97 CONCLUSIONS ... 98
CONTRIBUTIONS TO SCIENTIFIC KNOWLEDGE ... 99
CHAPTER I ...
!···
99 CHAPTER.II ... 100 CHAPTER III ... 101 RELEVANCE ... 103 CHAPTERI ... 103 CHAPTER II ... 103 CHAPTER III ... ~ ... 104LIMITA TI ONS AND A VENUES FOR FUTURE RESEARCH ... 105
Vll
ANNEXE CHAPITRE II ... 114
ANNEXE CHAPITRE III ... 119
lX CHAPITRE!
Fig. 1 Geographic locations and spatial pattern of pH heterogeneity within each of the three regional landscape context types across central to eastern Canada: Laurentians, QC ( open squares), Killarney, ON ( open diamonds ), and Cape Race, NL ( open circ les). Each ·panel shows a three-dimensional scatterplot for geographic locations and inter-annual pH of local lakes/ponds within each region: A. circumneutral, pH-··. homogeneous landscape (Laurentians, QC: 80 lakes sampled in 2010 and 2014 with
pH: min 6.3; max 8.6; mean 7.3); B. pH-heterogeneous landscape with a mixture of lake pH types (Killarney ON: 32 lakes sampled in 2005 and 2011 with pH: min 4.4; max 7.8; mean 5.6); and C. pH-heterogeneous, acidic-dominated landscape (Cape Race NL: 108 ponds sampled in 2013, 2014 and 2015 with pH: min 3.6; max 7.4; median 4.8). Within each region, blue symbols indicate local habitats with temporally-stable, circumneutral pH conditions (pH 2: 6.0), orange symbols indicate local habitats with intermediate acidity (5.0 <pH<6.0), and pink symbols indicate local habitats with very acidic conditions (4.0< pH <5.0). Vertical dashed lines indicate latitude and longitude in degrees, minutes and seconds for each lake/pond.
Fig. 2 A 21-day 2x2 factorial laboratory experiment with adult Leptodiaptomus minutus from the acid-dominated landscape at Cape Race NL revealed a reciprocal fitness tradeoff in survival (mean ± standard error) between acid-tolerant copepods at circumneutral pH 7.0 and acid-sensitive copepods at acidic pH 3.6. Circles indicate copepods from a circumneutral pond source (Bella pond) and triangles indicate copepods from an acidic pond source (NRB2 pond). Solid symbols indicate the copepod pond source treatment at pH 3.6, and open symbols indicate the copepod pond source treatment at pH 7.0. While solid stars indicate pairwise differences in survival that were detected for circumneutral pond-source copepods between levels of pH treatment, white stars with black circle background indicate pairwise differences
X in survival that were detected for acidic pond-source copepods between levels of pH treatment following RM-ANOV A (Tukey HSD tests, P<0.05).
Fig. 3 A 7-day 3x3 factorial field transplant experiment indicated that regional landscape context was important for modifying the mean acid tolerance of freshwater copepods from pH-stable, circumneutral lakes/ponds within each region ( adjusted means in final copepod survival ± standard error, with initial pond source copepod abundance as a covariate ). Regional landscape context is indicated by symbols: circumneutral, pH-homogeneous landscape (squares; Laurentians QC), pH-heterogeneous landscape with a mixture of lake pH types ( diamonds; Killarney ON), and pH-heterogeneous, acidic-dominated landscape ( circles; Cape Race NL ). Letters indicate pairwise differences in adult copepod survival detected between regional landscape context types within each level of pH treatment following a factorial mixed model (P<0.05, Tukey HSD tests).
Fig. 4 Final edible chlorophyll a concentrations (µgL-1) in the experimental cubitainers at the end of the 7-day 3x3 factorial field transplant experiment. Water and basal phytoplankton
+
bacterial resources were sourced from a single lake for the entire experiment (Lac Croche QC). Regional landscape context of copepod population source is indicated by symbols: circumneutral, pH-homogeneous landscape (squares; Laurentians QC), pH-heterogeneous landscape with a mixture of lake pH types ( diamonds; Killamey ON), and pH-heterogeneous, acidic-dominated landscape ( circles; Cape Race NL ). Letters indicate pairwise differences detected between regional landscape context types of copepod source within each level of pH treatment following a factorial mixed model (P<0.05, Tukey HSD tests).Xl CHAPITRE II
Fig. 1 Conceptual figure introducing, A. the frequency distribution of two spatially structured discrete populations with two characteristic phenotypes, B. the influence of the asyrnmetry on fitness, and C. the number of individuals in the population.
Phenotype (P), dispersal; Acid>Neutral (dAN), Neutral>Acid (dNA), (d), environmental optimum (S).
Fig. 2 Uncorrelated environmental noise generated within each patch, fluctuating around the mean deterministic environmental value of S=4 and S=6 for the acid (red) and neutral (blue) patch respectively. The fluctuations were estimated from a sample of random numbers drawn from the normal distribution with mean O and variance 1. A. standard deviation of 0, B. standard deviation of 0.2.
Fig. 3 A. An acid-adapted population embedded in an acidic landscape, B. a circumneutral-adapted population embedded in a circumneutral landscape, C. an acid-adapted population embedded in a circumneutral landscape, D. a circumneutral-adapted population embedded in an acidic landscape. Adult L. minutus survival to acidity was measured as Log10 (Nfina1+1) - Log10 (Ninitia1+1). Tukey HSD pairwise differences (alpha =0.05) represent pairwise differences for the entire mixed model.
Fig. 4 Total regional metapopulation contour plots (A and B) at t=lOOO in stable environments under the influence of within patch local selection and between patch dispersal and metapopulation heterogeneity in population size (C and D).
Fig. 5 Total regional metapopulation contour plots (A and B) at t=lOOO in fluctuating environments under the influence of within patch local selection and between patch . dispersal and metapopulation heterogeneity in population size (C and D).
Xll CHAPITRE III
Fig. 1 Pond water chemical and biotic characteristics resources in the three fish-stocked ponds and seven fishless reference study ponds at Cape Race, NL, Canada. Square symbols represent fish-stocked ponds and circle symbols represent fishless ponds; within these symbols, open symbols represent time of initial stocking in early summer and solid symbols are after two months of brook trout exposure at the time of fish recapture in late summer. A. edible chlorophyll a ( edible chl a; µg L-1), B. total nitrogen (µM), C. bacterial productivity (BP; µg C L-1 day-1). Asterisks (*) represent significant differences between either initial stocking and post-stocking in the fish-stocked ponds or between early summer and late summer in the fishless reference ponds as revealed by matching paired tests (P<0.05).
Fig. 2 Effects of YOY brook trout stocking and season on copepod fatty acids in fish-stocked and fishless ponds. Square symbols represent fish-fish-stocked ponds and circle symbols represent fishless ponds; within these symbols, open symbols represent early summer, which was the time of initial fish stocking in fish:-stocked ponds, and solid symbols represent late summer, which was after two months of brook trout exposure at the time of fish re-capture in the fish-stocked ponds. A. Temporal shifts in phytoplankton indicator fatty acid composition in calanoid copepods as revealed by NMDS. Arrows represent trajectories ofplankton communities between early and late summer. Phytoplankton fatty acid biomarker abbreviations correspond to the following groups; ELAIDIC Elaidic Acid (C18:ln9t), OLEIC Oleic Acid (Cl8:ln9c), LA Linoleic Acid (C18:2n6c), GLA Y-Linolenic Acid (Cl8:3n6), ALA a-Linolenic Acid (C18:3n3), ARA Arachidonic Acid (C20:4n6), EPA Eicosapentaenoic Acid (C20:5n3c), DHA Docosahexaenoic Acid (C22:6n3c) and SDA Stearidonic Acid (C18:4n3). B. Nutritional state of calanoid copepods as revealed by 003:006 ratios in fish-stocked and fishless ponds between early and late summer.
xm Fig. 3 Relationships between copepod body length-fecundity relationships, copepod population abundance and sex ratios, and total crustacean zooplankton abundance in response to fish-stocking and season. Square symbols represent fish-stocked ponds and circle symbols represent fishless ponds; within these symbols, open symbols represent time of initial stocking in early summer and solid symbols are after two months of brook trout exposure at the time of fish re-capture in late summer. Simple linear regressions between individual gravid female calanoid copepod body size (µm) and fecundity (number of eggs / individual gravid female) in A. fishless, reference ponds prior to fish stocking in early summer and B. in fish-stocked and fishless reference ponds at end of summer. C. Ratios of male individual copepod abundance to individual female copepod abundance per L-1. D. Differences population abundance of calanoid copepods in response to fish stocking and season. Asterisks (*) represent significant differences between either initial stocking and post-stocking in the fish-stocked ponds or between early summer and late summer in the fishless reference ponds as revealed by matching paired tests (P<0.05).
Fig. 4 Effects of YOY brook trout stocking and season on the phytoplankton community composition and seston fatty acid composition. In all panels, open symbols represent time of initial stocking in early summer and solid symbols represent late summer, which was after two months of brook trout exposure at the time of fish re-capture in fish-stocked ponds. A. NMDS of phytoplankton community composition (Hellinger-tranformed relative taxon biovolume; mg m·3) and B. NMDS of seston phytoplankton biomarker fatty acid composition. In panels A. and B., square symbols represent fish-stocked ponds and circle symbols represent fishless ponds. Arrows on the NMDS biplots in represent trajectories of phytoplankton communities between these two periods. The biovolume (mg m·3) of three major phytoplankton groups ( cryptophytes, dinoflagellates, and chlorophytes) are shown in C. fish-stocked ponds and in D. fishless ponds. In panels C. and D., we used the
XlV following symbols to designate key phytoplankton groups: downward triangles, crytophytes; upward triangles, dinoflagellates; diamonds, chlorophytes. Asterisks (*) represent significant differences between initial stocking and post-stocking in the fish-stocked ponds (P<0.05).
XVl CHAPITRE!
Table 1 Statistical results of the laboratory transplant experiment ( experiment 1) as revealed by univariate RM-ANOVA that show adult copepod survival in response to copepod pond source and pH treatments over 21 days.
Table 2 Statistical results of the 7-day field transplant experiment ( experiment 2) as revealed by a factorial mixed model, with initial copepod abundance [Log10 (Ninitial
+
1)] as a co-variate, and final adult copepod survival [Log10 (Nfinal+
1)] as the response variable.Table 3 Statistical results of the 7-day field transplant experiment ( experiment 2) as revealed by a factorial mixed model that show final chlorophyll a concentration (Log10 Nfinal [chi a
+
1]; µg L-1) in response to treatments of regional landscape context of copepod source and pH.xvn CHAPITRE II
Table 1 Two-patch model parameters, brief description and values used during simulations.
xvm CHAPITRE III
Table I: Table of geographical coordinates, physico-chemical, and basal resource characteristics of the 7 study ponds in late June 2015 and in early September in 2015 at Cape Race, NL, Canada. The three ponds stocked with YOY brook trout are indicated by #. Except for latitude (Lat), longitude (Long), surface area (SA) and depth (Depth), white column shading corresponds to late June sampling prior to fish stocking and grey column shading corresponds to early September sampling following two-months of fish exposure in the fish-stocked ponds.
Table II: Final mass (grams, mean ± standard error of the mean (SEM)) of YOY brook trout stocked into three fishless ponds in late June and recovered in early September 2015 at Cape Race NL, Canada.
XIX RÉSUMÉ
Les variables abiotiques peuvent modifier considérablement les processus écosystémiques ainsi qu'agir comme agents sélectifs de la diversification évolutive à
l'échelle du paysage. Cependant, l'influence de ces variables abiotiques sur la variation phénotypique pour des traits adaptatifs ou maladaptatifs à travers de paysages avec des niveaux différents d'hétérogénéité spatiale et temporelle est largement inexplorée. À l'aide d'une approche métacommunautaire, ma thèse examinera, les processus écologiques pertinents agissant sur l'étendue de la variation phénotypique à l'échelle locale et du paysage, dans un consommateur aquatique primaire clé et abondant. Le présent travail a été mené pour la plupart à de multiples niveaux trophiques dans un système peu étudié qui s'étend sur de larges gradients abiotiques naturels en acidité. L'acidité est une force écologique puissante qui peut agir de l'échelle individuelle à l'échelle écosystémique, en modifiant les tolérances physiologiques, les interactions de la communauté et les attributs de l'écosystème. L'objectif principal de mon travail sera le rôle de la variation phénotypique parmi les populations de copépodes calanoïdes de Leptodiaptomus minutus à travers de gradients en acidité à l'échelle, couvrant différents niveaux de complexité écologique. Ces copépodes sont souvent les principaux consommateurs primaires qui transfèrent l'énergie et des composés essentiels entre les ressources basales et les prédateurs d'invertébrés et de poissons dans les réseaux trophiques aquatiques nord-tempérés. Il existe trois principaux objectifs de thèse: CHAPITRE I) fera une comparaison au niveau du paysage en termes tolérance au pH de L. minutus dans trois régions qui diffèrent dans l'hétérogénéité spatiale et temporelle et quantifient les conséquences de ces différences écologiques pour la ma des traits intraspécifiques au niveau de la population; CHAPITRE II) produira un modèle métapopulationelle avec des
XX
caractéristiques source-puits comprenant la sélection asymétrique qui est basee sur de l'evidence empirique, afin de modéliser les conditions favorisant la persistance de la ma dans des environnements spatialement hétérogènes; CHAPITRE III) quantifiera les sources de variation phénotypique dans les copépodes de L. minutus (taille corporelle, fécondité et accumulation trophique d'acides gras essentiels) qui sont associés aux gradients d'acidité et de prédation à l'échelle du paysage. Dans ce dernier chapitre, je considérerai également les effets des cascades trophiques générées par la dynamique des nutriments entraînées par les consommateurs (Consumer-driven Nutrient Dynamic ou CND).
ABSTRACT
Abiotic variables can significantly alter ecosystem processes as well · as act as selective agents of evolutionary diversification across landscape gradients. However how abiotic variables can affect phenotypic variation for adaptive or maladaptive traits across landscapes with differing levels of spatial and temporal heterogeneity is largely unexplored. U sing a metacommunity approach, my the sis will examine ecologically relevant processes acting to influence the extent of phenotypic variation operating at the local and landscape levels, in a key and abundant primary aquatic consumer. The present work was conducted for the most part at multiple food web trophic levels in an understudied system that spans broad natural abiotic gradients in acidity. Acidity is a potent ecological force that can operate on different levels, from individuals to the ecosystem scale, acting on physiological tolerances, community interactions and ecosystem attributes. The main focus of my work will be on the role of phenotypic variation among Leptodiaptomus minutus calanoid copepod populations across landscape gradients in acidity, spanning different levels of ecological complexity. These copepods are often the dominant primary consumers that transfer energy and essential compounds between primary producers and. both invertebrate and fish predators in north-temperate aquatic food webs. There are three main thesis objectives: CHAPTER-1) will make a landscape level comparison of L. minutus pH tolerance across three regions that differ in spatial and . temporal heterogeneity and quantify the consequences of these ecological differences for copepod population-level maladaptatation in terms of phenotype-environment mismatches; CHAPTER II) will produce a two-patch metapopulation model based on empirical evidence, with source-sink characteristics and asymmetric selection to
XXll model the conditions that favour the persistence of phenotype-environment mismatches in spatially heterogeneous environments; CHAPTER Ill) will quantify sources of phenotypic variation in L. minutus copepods (body size, fecundity, and the trophic accumulation of essential fatty acids) that are associated with landscape gradients in acidity and predation. In my final chapter, I will also consider the effects oftrophic cascades generated through consumer-driven nutrient dynamics (CND).
INTRODUCTION
Human disturbance is becoming increasingly problematic for the persistence of populations and species worldwide. As a result of anthorpogenic disturbance and climate change, biodiversity is declining globally with major consequences for key ecosystems processes (Hooper et al. 2012; Cardinale et al. 2012; Dirzo et al. 2014). This is of concem for the survival of native species and resident natural populations when disturbed in their wild natural habitat. In combination with environmental changes, human activity on short contemporary scales is already producing unexpected ecological and evolutionary outcomes. Ecology and evolution must be inextricably linked if they are occurring on similar contemporary timescales, with current day ecology being in large part what shapes adaptive evolutionary change (Darwin 1859). Such anthropogenic alterations can be a potent source of selection for evolutionary responses that occur over ecological time frames (<190 years) (Stockwell et al. 2003; Hendry et al. 2011 ). This has led scientists to ask on the effect of evolution on ecological interactions (Yoshida et al. 2003; Hairston 2005; Palkovacs et al. 2009; Post and Palkovacs 2009; Fussmann et al. 2007; Walsh et al. 2012; Ellner 2013) and ecosystem processes (Harmon et al. 2009; Palkovacs et al. 2009; Bassar et al. 2010; Matthews et al. 2011; Zandona et al. 2011; Bassar et al. 2012). Changes in the performance of ecologically important traits, could potentially have cascading effects at the gene, individual, population, community, and ecosystem levels (Whitham et al. 2006; Fussmann et al. 2007; Post and Palkovacs 2009; Matthews et al. 2011; Schoener 2011; Hendry et al. 2011; Ellner 2013; Reznick 2013). Analysis of rapid evolution as an ecological process has the potential to make
2 evolutionary ecology one of the most central of applied biological sciences (Thompson 1998; Stockwell et al. 2003; Hendry et al. 2011).
How natural populations are able to cope and respond to these disturbances has important implications for predicting population responses to multiple sources of disturbance. There is ample evidence in the scientific literature to suggest that populations can evolve rapid responses to these ecological disturbances in contemporary timescales (Thompson 1998; Hairston et al. 1999; Hendry and Kinnison 1999; Palumbi 2001; Bradshaw and Holzapfel 2001; Stockwell et al. 2003; Reale et al. 2003; Yeh 2004; Olsen et al. 2004; Hairston et al. 2005; Hendry et al. 2006; Derry and Arnott 2007; Fisk et al. 2007; Hendry et al. 2011; De Leon et al. 2011 ), and, as a result, have cascading effects on communities arid ecosystems. Deeper insights into how disturbance in native habitats affects evolution, and also physiological responses of populations to these stressors would give us greater capacity to predict how interactions between ecology and evolution mediate responses in altered aquatic food webs. This work is important as a global unit because it allows us to better comprehend interactions between ecology and evolution in natural, unperturbed ecosystems, and because it can inform us of possible consequences of human disturbance in anthropogenic-challenged ecosystems in other reg1ons.
I here provide a brief overview, structured in subsections, of the theoretical and empirical work that was carried out throughout this research. The thesis made use of an excellent model species, the calanoid copepod (Leptodiaptomus minutus), with widespread distribution across lakes and ponds, but also rapid generation times, sexual species, often dispersal limited, but counter-intuitively the most dominant zooplankton species found across freshwater environments in the northeastem North American biogeographic range. First I will empirically quantify the influence of the regional landscape context on local trait divergence in natural populations. Then at the local level, I incorporate the dynamic forces of asymmetry in selection and migration into a theoretical heterogeneous two-patch model with source-sink
3 characteristics, to explain the underlying mechanisms that maintain adaptation or maladaptation in natural populations. I then expand my research at the community level, to quantify the importance of the abiotic and biotic environment in determining these responses. Finally and again at the local level, I address the important role of food webs and the nutritional state of aquatic ecosystems situated along these environmental gradients.
There are three specific thesis objectives: CHAPTER I will explore ecological differences in L. minutus pH tolerance at the landscape level at broad scales across three regions that are subject to a combination of environmental, spatial, and historical influences; CHAPTER II will produce a mathematical two-patch model based on the results obtained from a two-year experiment conducted in nature, to better understand the effect of asymmetric selection for maladaptive trait-environmental mismatch in natural populations of L. minutus; CHAPTER III will quantify sources of phenotypic variation in L. minutus copepods that are associated with landscape gradients in acidity and fish predation, such as body size, fecundity, and the trophic accumulation of lipids and essential fatty acids ·(HUF As) across a simplified food web. These chapter objectives are addressed experimentally by means of common environment transplant experiments in both the laboratory and the field ( CHAPTERS I and Il), a discrete two-patch mathematical model ( CHAPTER II) and by means of a whole-pond stocking experiment (CHAPTER III). The first two chapters make unique contributions to the scientific literature in the fields of metapopulation ecology and aquatic ecology, and the third chapter makes a novel contribution to our understanding of food web ecology in shallow aquatic ecosystems. Overall the thesis is a unique blend of metapopulation ecology, landscape ecology, and food web ecology, giving new insights into factors that determine intraspecific trait variation ( adaptive and maladaptive) of crustacean zooplankton in aquatic ecosystems.
4 0.1 Maladaptation
Widespread maladaptation in nature is undisputed by theoretical (Steams and Sage 1980; Gillespie 1994; Lande and Shannon 1996; Garcia-Ramos and Kirkpatrick 1997; Holt and Gomulkiewicz 1997; Kirkpatrick and Barton 1997; Crespi 2000; Ronce and Kirkpatrick 2001; Thompson et al. 2002; Nesse 2005; Roy et al. 2005; Frank 2007; Garant et al. 2007; Hanski 2010) and empirical (Steams and Sage 1980; Jarvinen and Valsanen 1984; M01ler 1995; Thomas et al. 1996; Dias and Blondel 1996b; Post and Forchhammer 2008; Rolshausen et al. 2015) studies. The reasons for widespread maladaptation in nature are numerous (Haldane 1956; Barton and Partridge 2000), with a general agreement that phenotypes tend to be usually lagging behind changes in the environment and that maladaptation is more of a persistent state rather than an outcome of many natural populations. If maladaptation is widespread in nature, then it is important to study it, explain how it persists over extended spatial and temporal scales (Hendry and Gonzalez 2008).
Maladaptation can be defined as mismatches between the mean population phenotype and the optimal phenotype in relation to the environment in a point in time, and can cause a decrease in the local fitness of a population (Lande and Shannon 1996), with a lack of plasticity also leading to maladaptation. Maladapted populations are therefore dominated by phenotypes with lower fitness than other available phenotypes (Dias and Blondel 1996b ). In fragmented landscapes in particular, dispersal (Hanski and Gaggiotti 2004; Leibold et al. 2004) and gene flow (Ronce 2007) between habitat patches constrain local adaptation and ensure persistent maladaptation because of migration load (Lenormand 2002; Hendry and Taylor 2004; Bolnick and N osil 2007; Moore et al. 2007). The extent of local maladaptation and population differentiation will therefore highly depend upon dispersal rates and spatial patterns in fragmented landscapes (Legrand et al. 2017). The conventional view of local adaptation assumes stable local populations in which the phenotypic distribution approaches equilibrium (Hanski and Singer 2001 ). However local
5 adaptation defined in this way is not a measure of migration load because populations are not being compared to an optimum they would achieve in the absence of migration (Lenormand 2002). Thus, increasing maladaptation is more likely to occur in heterogeneous fragmented habitats where the environment is highly variable in space and time, often fluctiating that is, but also where initial population sizes are small, genetic variation is reduced or limited and dispersal from neighbouring habitats is sufficiently strong to introduce maladapted variants.
O. 2 The regional landscape context and its role in determining mal adaptation
Under natural selection individuals tend to adapt to their local environmental conditions (local adaptation), however local adaptation is hardly ever perfect and cannot be so dim to trade-offs, varying on a continuum from highly adapted to poorly adapted (Parkas et al. 2015), with some degree of maladaptation being common in nature (Crespi 2000). This spectrum of adaptive trait variation is particularly important and necessary to overcome the challenges imposed under environmental change. Theory and empirical evidence suggest that local adaptation is hard to attain and that maladaptation is widespread (Steams and Sage 1980; Gillespie 1991; Lande and Shannon 1996; Garcia-Ramos and Kirkpatrick 1997; Holt and Gomulkiewicz 1997; Kirkpatrick and Barton 1997; Crespi 2000; Thompson et al. 2002; Nesse 2005; Roy et al. 2005; Frank 2007; Garant et al. 2007). Local adaptation is expected under scenarios of low dispersal and strong selection (Brown and Pavlovic 1992; Day 2000; Kisdi 2002; Spichtig and Kawecki 2004 ), with fitness being maximized when the population's phenotypic distribution is found matching the optimum environmental value in a habitat. At this optimum, it is usually assumed that the adaptive value of a population is maximized and that fitness declines toward zero as the deviation of the actual from the optimum phenotype increases (MacArthur and Levins 1964). When selection is very strong however, fitness can fall off very quickly as the phenotypic distribution of a population deviates from this local optimum. Migration can also
6 contribute to deviating populations from their optima for survival. This is because an increase in the connectivity of two habitats above some threshold results in a process of 'migrational meltdown' (Ronce and Kirkpatrick 2001 ), with the collapse of the total population size and the complete loss of one of the two habitats. Sorne other common constraints to local adaptation are related to diff erences in population sizes, genetic variation, as well as the spatio-temporal dynamic nature of the environment ( e.g. fine vs. coarse-grained environments, stabilizing vs. fluctuating selection, spatial network structure and configuration). Together as a whole, these factors ensure that optima are rarely attained by local phenotypes and that maladapatation is prevalent and persistent (Hendry and Gonzalez 2008).
It is well known that observed patterns and their apparent relationships with response variables often depend upon the scale that is chosen for observation and the rules that are adopted for defining and mapping variables (Wiens 1989). Landscape context (Fig. 1) can thus contribute to reducing local adaptation in populations depending on the pattern of environmental heterogeneity, the spatial distance between habitats on landscapes, and the level of habitat connectivity (Hanski et al. 201 O; Richardson et al. 2014; Farkas et al. 2015). These theoretical predictions are based on a wealth of empirical studies that have shown that local adaptation is contingent on a balance between selection, gene flow, and genetic drift operating within landscapes (Slatkin 1987; Lenormand 2002; Hendry et al. 2002; Nosil and Crespi 2004). Local adaptation often occurs in response to local selection gradients in fragmented landscapes with low connectivity (Endler 1986; Schluter 2000; Kawecki and Ebert 2004; Ghalambor et al. 2007; Hereford 2009). However, local adaptation can be further reduced depending on spatial landscape context because of
(1.)
phenotypic plasticity, which can be highly adaptive (plasticity as an adaptive trait that can evolve without genetic change) that is favoured under conditions of high gene flow and spatial environmental heterogeneity (Sultan and Spencer 2002; Lind and Johansson 2007; Hollander 2008; Crispo 2008; Baythavong 2011; Lind et al. 2011), (ii) high genetic trait variance that may occur in the presence of low levels of gene flow from7 habitats with strong opposing selection (maladaptation: Urban 2006; Farkas et al. 2015), (iii) temporal variation in selection pressures and (iv) cost versus benefits of traits (trade-offs).
A B
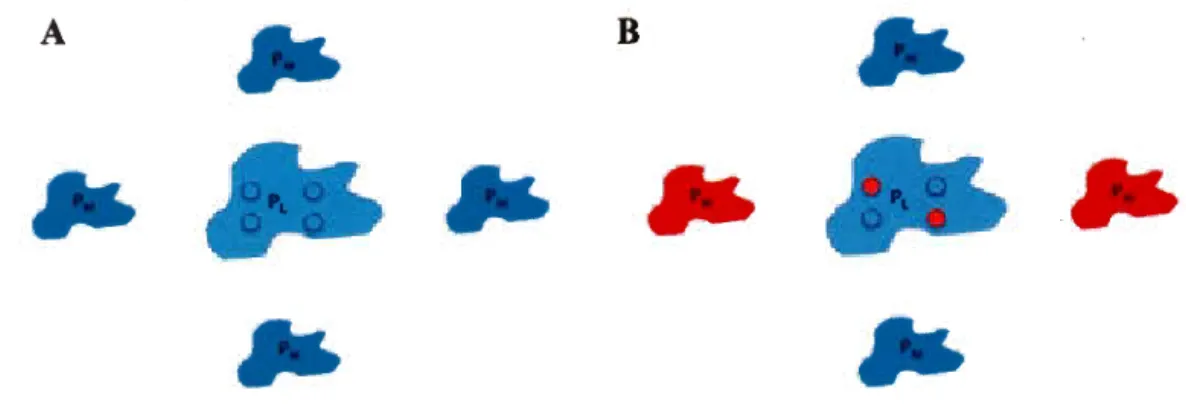
PL -Local population phenotype PM -Migrant population phenotype
C
Fig. 1 Theoretical predictions explaining the relationship between landscape context and local maladaptive trait divergence of the local population phenotype (PL) subject to incoming migration from the migrant population (PM) inhabiting in-close proximity habitats. A. Low local maladaptive trait variation in a homogenous landscape; B. Intermediate local maladaptive trait variation in a heterogeneous landscape; C. High local maladaptive trait variation in an asymmetric landscape. Thus, the degree of local maladaptive trait variation can strongly be influenced by the characteristics of the landscape (Fig. 1 ), especially across landscapes that are spatially heterogeneous (Fig. lB and Fig. 1 C) and in habitats with contrasting environmental conditions that are found in-close proximity to each other.
The response of aquatic local food webs to altered environmental conditions thus depends on metacommunity responses - the balance of local filtering imposed
8 by abiotic conditions and biotic interactions (Leibold et al. 2004 ), and effects of regional dispersal among habitats (Westley et al. 2010; Gray and Amott 2012a). Vell end (2016) elegantly described the processes used to explain community patterns as going through a series of filters that are system-specific ( dispersal, abiotic and biotic filters) that cause fitness differences among species in a metaconununity framework. While local environmental conditions and biotic interactions are selective agents, dispersal supplies a community with different species and genotypes on which the selective agents act (Cottenie and DeMeester 2004; Urban et al. 2008). These same concepts can be applied at the metapopulation-level, where in addition to local environmental filtering, local evolutionary processes may also occur (Urban et al. 2008). Thus abiotic variables ( e.g. pH) can significantly alter ecosystem processes as well as act as selective agents of evolutionary diversification across landscape gradients. However, the influence of abiotic variables on interactions between ecology and evolution is largely w1explored. The possible consequences of fitness differences are relatively small in number (speciation, dispersal, drift, selection), but universally applicable (Vellend 2016).
Standing genetic variation for adaptive traits can be maintained among spatially heterogeneous habitats with divergent selection, and among-habitat dispersal may theoretically help (Bell and Gonzalez 2009; Gonzalez and Bell 2013) or hinder (Schiffers et al. 2013) local evolutionary responses to disturbance depending on the level of maladaptation of migrants. Reciprocal transplant experiments and common garden transplant experiments can be used to characterize the nature of phenotypic variation and adaptation among populations along enviromnental gradients, and the nature of selection on traits (Conover and Schultz 1995; Kawecki and Ebert 2004). A multitude of reciprocal transplant experiments have shown that adaptation is what causes local individuals to have higher fitness than foreign individuals (Leimu and Fischer 2008; Hereford 2009) enabling populations to persist through environmental change.
9 In the context of climate change it is imp011ant to keep in mind that,
establishing that an observed phenotypic shift bas a genetic basis as a necessary condition for inferring adaptive evolution in response to climate is not entirely sufficient because genetic changes might not be adaptive (Merila and Hendry 2014). Phenotypic responses to selection could result from genetic differences (local adaptation), materna! effects, phenotypic plasticity, or a combination of these, and these sources of variation could potentially result in different evolutionary (Ghalambor et al. 2007) and ecological (Urban et al. 2008) outcomes. Ecological factors predicted to promote local adaptation include: low gene flow (i.e. low dispersal or strong habitat fidelity), strong selection against genotypes optimally adapted to other habitats but moderate selection against intermediate genotypes (most likely under moderate differences between habitats with respect to traits under selection), little temporal variation in the forces of selection, small differences between habitats in size and quality (e.g. the amount of resources), and costs of or constraints on adaptive plasticity (Kawecki and Ebert 2004). Local adaptation is expected to predominate in spatial heterogeneous but temporally stable environments among which dispersal is somewhat limited (Endler 1986; Schluter 2000; Kawecki and Ebert 2004; Ghalambor et al. 2007). However, local adaptation may also lead to trade-offs where adaptations to one environment can corne at a cost of adaptation to another environ.ment (Hereford 2009; Jones 2013). To name a few examples in nature of specialist phenotypes that incur adaptive fitness responses to selection at the local and the landscape level, includes; functional diversity among predators of the freshwater snail Physa creates an adaptive trade-off for the snail's shell morphology (De Witt et al. 1998), tadpoles of the pacifie treefrog (Pseudacris regilla) survived
best when exposed to the predator whose eues they were reared with, and worst when
exposed to the other predator (Benard 2006), adaptive trade-off in floral morphology mediates specialization for flowers pollinated by bats and hummingbirds (Muchhala 2007), L. minutus is highly adaptive to changes in environmental conditions with
10 fitness trade-off in copepods with high acid tolerances at circumneutral pH (Derry and Amott 2007; Negrin Dastis and Derry 2016) and butterfly flight activity affects reproductive performance and longevity relative to landscape structure (Gibbs and Van Dyck 2010). A trade-off in a fitness-determining trait can have a counterintuitive influence on the evolution of specialization (Egas et al. 2004). If maladaptation is persistent in natural systems, there must be weak trade-offs of adaptation associated with it (Hereford 2009). This would explain why predictions of theory relating evolution of specialization to costs of adaptation are frequently not met (Futuyma and Moreno 1988).
O. 3 The role of abiotic and biotic ecological gradients
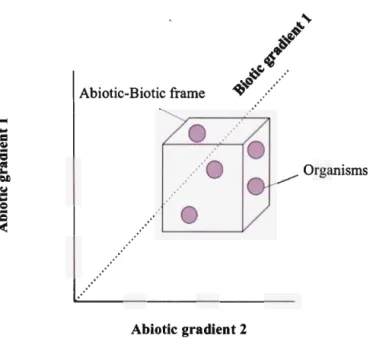
The distribution and success of an organism is a fonction of abiotic constraints and biotic processes (Bronmark and Hansson 2010). In abiotic terms, pH, DOC ( dissolved organic carbon) and temperature, among others, can act separately or in concert as patent ecological forces that can operate from the individual to the community level, affecting physiological tolerances and community interactions. Biotic factors such as predation can also have profound effects on aquatic food webs (Carpenter et al. 1985; Magnan 1988; Pace et al. 1999). Thus in combination, the abiotic and biotic factors provide the frame that determines the successful or unfavourable colonization of a species (Fig. 2).
Abiotic-Biotic frame
0
0
.. ···\) Organisms
Abiotic gradient 2
Fig. 2 A graphical representation of abiotic and biotic environmental gradients. Spheres are species
that have a niche that fits the Abiotic-Biotic frame and thus may colonize the specific lake (modified from Brënmark and Hansson 2010).
11
In regions, for example, were the bedrock is rich in bicarbonates, a combination of water and soils can have high acid neutralizing capacity (high alkalinity) and can thus buffer against acidity. In contrast, in other regions where bedrock is absent, pH can drop sharply. Thus the geological.formation of a region can strongly affect the pH of a lake or pond, but processes such as respiration can also add carbon dioxide to the system via carbon fixation, which releases H+ ions, leading to lower pH (Brônmark
and Hansson 2010). Increased photosynthesis, on the other hand, which is essential
for phytoplankton, may raise pH with carbonate ions precipitated as calcium carbonate, and represents the autotrophic proportion of basal production in the pelagic food web (Faithfull et al. 2011 ). In net-autotrophic systems photosynthesis rate exceeds respiration rate and oxygen is exported to the atmosphere, in contrast with net-heterotrophic systems where organisms are subsidized with carbon (dissolved organic carbon 'DOC' and/or particulate organic carbon 'POC'), and respiration rate becomes higher than photosynthesis rate leading to export of carbon dioxide to the atmosphere (Brônmark and Hansson 2010).
12 The relationship between pH and DOC is important, because pH can also be strongly influenced by the organic acids in DOC (Erlandsson et al. 2011 ). DOC can also thus reduce light penetration via shading, causing lower algal biomass (Ask et al. 2012), and potentially increase bacterial productivity and food web dependence on bacterially-derived carbon somces in place of phytoplankton (Sherr and Sherr 1987;
Kankaala 1988; Jansson et al. 1999; Bergstrom and Jansson, 2000; Lem1on and Pfaff 2005; Rautio and Warwick 2006; Lennon and Cottingham, 2008; Karlsson et al. 2009;
Kankaala et al. 2010; Andersson et al. 2013; Forsstrom et al. 2013), affecting aquatic food webs (Faithfull et al. 2011 ). Carbon that is derived from pelagic bacteria has a lower nutritional value because it lacks the essential poly-unsatmated fatty acids (PUFAs) that are synthesized by algae (Wenzel et al. 2012). Therefore, DOC can have strong effects on basal resources such as phytoplankton and bacteria, which have very different nutritional value to higher consumers (Faithfull et al. 2011 ). Differences in DOC among aquatic habitats could therefore potentially modulate the availability of essential fatty acids to intermediate aquatic consumers such as zooplankton by stimulating or suppressing phytoplankton growth. There is evidence that increased terrestrial inputs of DOC to nutrient-poor aquatic ecosystems can lead to reduced production in higher trophic levels (Karlsson et al. 2009) and reduced overall net ecosystem production (Ask et al. 2012).
Landscape gradients in dissolved organic carbon (DOC) often co-occm with naturally derived acidity from humic sources (wetlands and peat) (Pastor et al. 2003). DOC, and its association with humic sources of acidity as mentioned earlier, is anticipated to potentially either increase or decrease in aquatic environments in regions that experience changes in precipitation and terrestrial runoff associated with climate change (Schindler et al. 1996; Zhang et al. 2010; Larsen et al. 2011). DOC can exert mild chemical stress on organisms, yet reduce iono-regulator distmbance from acidic waters, but still disrupt the types and quantities of basal resources available to higher consumers by inhibiting photosynthesis and algal growth and by promoting bacterial productivity (Steinberg et al. 2006). One avenue by which
13 climate change is anticipated to impact the ecology of north-temperate freshwater ecosystems is through altered amounts of precipitation and associated allochthonous inputs of DOC to aquatic habitats (Larsen et al. 2011 ).
O. 4 Zooplankton plasticity, adaptation and traits
In its simplest definition, a trait is a surrogate of organismal performance, and evolutionists have used this meaning of the term for a long time (Vialle et al. 2007). Zooplankton responses to selective pressures and traits are ecologically significant because they can affect survival ( e.g. pH tolerance ), materna! investment ( e.g. egg number and size ), and growth and reproduction (body size, lipid accumulation, larval survival, fecundity, and abundance). These traits are of special interest because they can act as potential sources of phenotypic variation along landscape environmental gradients and can thus directly affect performance and fitness along these gradients. These responses and traits can be particularly important because they can alter ecological processes (Matthews et al. 2011; Reznick 2013). Stockwell et al. (2003) identified three primary contexts in which humans drive trait changes: in situ anthropogenic disturbance, introduction of populations to new habitats, and introductions of new interacting species (e.g., hosts, pathogens, and predators) within the existing range of a species. Traits can range from the individual to the ecosystem level, including but not limited to the study of; morphological character developments,
life-history changes and other demographic traits related to birth and death rates. According to Walsh et al. (2012), changes in the performance of these traits could have cascading effects at the gene, individual, population, community, and ecosystem levels, potentially impacting both top-down and bottom-up trophic interactions in food webs (Post et al. 2008; Palkovacs et al. 2008).
How phenotypic trait changes operate in nature is still not completely clear. How can we explain the causes that make certain trait changes more plastic than others and what properties do these traits contain that make them special in the sense
14 that they provide spec1es a certain evolutionary advantage is still unknown. One experimental tool, unrelated to the genetic mechanisms that underlie the adaptive evolution of a trait, has been particularly useful in addressing whether a specific trait has evolved in part by the process of adaptation is manipulation of the phenotype
after Sinervo and Basolo ( 1996). Other experimental approaches, after (Pigliucci et al. 2006) have controlled for genotype within family variation, depicting genotypic reaction norms illustrating the concept of phenotypic plasticity taking into accow1t that the slope of such reactions is a measure of the degree and pattern (positive or negative) of phenotypic plasticity. Thus, categorizing phenotypic traits in relation to their fonction is especially important when considering the potential for how evolution in these traits might have a feedback on ecology.
Generally, an adaptation is a phenotypic feature which is functionally designed by past natural selection, and which improves Darwinian fitness relative to alternative features (Williams 1966). However, plasticity and selection can jointly facilitate local adaptation (Torres-Dowdall et al. 2012). Local adaptation however may also lead to trade-offs, in which adaptation to one environment cornes at a cost of adaptation to another environment, yet, many studies have not demonstrated local adaptation, suggesting that sometimes native populations are no better adapted than are genotypes from foreign environments (Hereford 2009). However, examples of locally adapted prey to fish exist, as is the case for Daphnia studies (De Meester 1996; Boriss et al. 1999; Declerck et al. 2001; Cousyn et al. 2001) for the most part. Boriss et al. (1999) showed that the observed changes in life-history characteristics might lead to differences in fitness under different predation regimes, such that populations from habitats with fish have highest fitness under fish predation regimes and populations without a fish background have higher fitness values under invertebrate predation regimes. Cousyn et al. (2001) also reported the case for rapid, local adaptation of zooplankton behavior to changes in predation pressure in the absence of neutral genetic changes and found in this particular study concerning resting egg bank of the waterflea Daphnia, that the population studied experienced variable and
well-15
documented levels of fish predation over the past 30 years and shows correlated genetic changes in phototactic behavior, a predator-avoidance trait that is related to diel vertical migration and that these changes mainly involve an increased plasticity response upon exposure to predator kairomone, the direction of the changes being in agreement with the hypothesis of adaptive evolution. While adaptation to fish predation has been proven to be an important mechanism in Daphnia, in a different context, Daphnia exposed also to high cyanobacteria levels over long periods of time can adapt to being more tolerant of toxic cyanobacteria in their diet (Sarnelle and Wilson 2005).
0.5 The role of consumer nutrient dynamics (CND) and abiotic gradients
Environmental gradients are key structuring agents that determine the structure of biodiversity across landscapes (Loreau et al. 2002; Hooper et al. 2005). However, much of the focus on understanding the spatial distribution of species richness and community compositional patterns in aquatic ecosystems has focused on abiotic factors such as pH, temperature, and nutrients (Pinel-Alloul 1995; Shurin et al. 2010; Greig et al. 2010; MacLennan et al. 2012; Shurin et al. 2012). Fish can also play an important role in supplying additional nutrients in the form of phosphorus (Schindler et al. 2001) and endogenous nitrogen to the ecosystem through excretory processes (Vanni 2002), where fish are able to affect ecosystem processes as much as bottom-up factors (El-Sabaawi et al. 2015). Fewer studies have addressed the role of biotic factors, especially top predators, in regulating the biodiversity and species composition of prey communities, especially at the landscape scale (Zarnetske et al. 2017). This is despite the known importance of fish predators in regulating prey communities in small local habitats (Estlander et al. 2017) as well as fish altering key ecosystem fw1ctions such as nutrient regeneration (Vanni 2002).
16 Salmonids are commercially important fish and are broadly distributed across their native range at northern latitudes (Scott and Crossman 1973). Salmonids can cause trophic cascades that result in increased algal biomass and production and are responsible for changes to energy and nutrient flux in both streams and lakes (Simon and Townsend 2003). Salmonid introductions in naturally fishless ponds and lakes can thus have varied effects that depend on both landscape characteristics of a region, such as geology and historical biogeography, as well as local habitat properties, such as water chemistry and local community assemblages of zooplankton.
Consumer-mediated nutrient dynamics (CND) are an indirect mechanism by which predators can alter prey organismal traits and have ecological consequences at the ecosystem-scale (reviewed in Atkinson et al. 2016). The importance ofCND has been widely recognized, with pioneering work taking place in freshwater ecosystems (Kitchell et al. 1979). In aquatic ecosystems, animals have been recognized to play an integral role in the storage and remineralisation of elements (Vanni et al. 2006; Vaughn, 2010). Consumers thus play, an important functional role in biogeochemical processes (Capps et al. 2015). Studies that have measured the contribution of migrations of anadromous fish to nutrient dynamics in stream ecosystems (Holtgrieve and Schindler 2011; Tiegs et al. 2011) are a clear example of CND. Although there is empirical evidence to support CND effects from animals acting as sources of nutrients through excretion and nutrient sinks through growth, there are still many fondamental questions (Capps et al. 2015) involving CND that remain unclear (e.g. (1) the potential ecosystem-level effects of nutrient remineralisation, transport and storage between small aquatic and large aquatic and terrestrial animais, (2) the influence of immigration and emigration of consumers on nutrient dynamics, (3) context dependence of species effects on biogeochemical cycling (El-Sabaawi et al. 2012; Marshall et al. 2012), (4) the importance of homeostasis and ontogeny in driving excretion rates (Pilati and Vanni 2007; Small and Pringle 2010; Hossack et al. 2013) and (5) eco-evolutionary feedbacks in CND (Zandona et al. 2011; El-Sabaawi et al. 2015), among many others (Atkinson et al. 2016). Animais can be important
17 mediators of biogeochemical cycles through "bottom-up" processes of storage (in tissues) and supply (through excretion and egestion) of nutrients (Elser and Urabe
1999; Sterner and Schulz 1998; Vanni 2002) (Fig. 3).
Acidic
Overall nutritional state
pH gradient Neutral
~ ~
Young of the Year ~ ....,..._.~ _... nitrogenous Fish
'Brook trout' waste
+
,~---,
r
Body size-fecundity : 1 .& 1 1 r.\l 1 1 1 1 1 1 1 1\
!!!:~~
-
A
_
f
!~!!~~
~
,
~
..
____ _
,---,
1 Sex ratio 1'---'
1 1 Population 1 attribute : 1 1 1 1 1•---.1
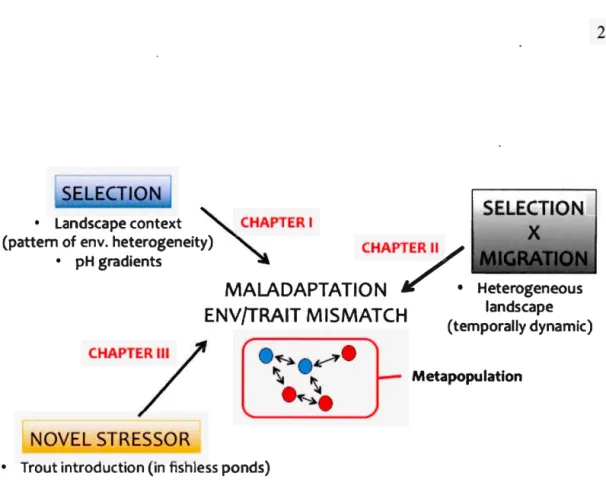
Fig; 3 Conceptual representation oftop-down (Predation) and bottom-up effects (Consumer Nutrient Dynamics) offish on zooplankton abundance, traits and nutritional state. Feedbacks from algae back onto the zooplankton are also shown.
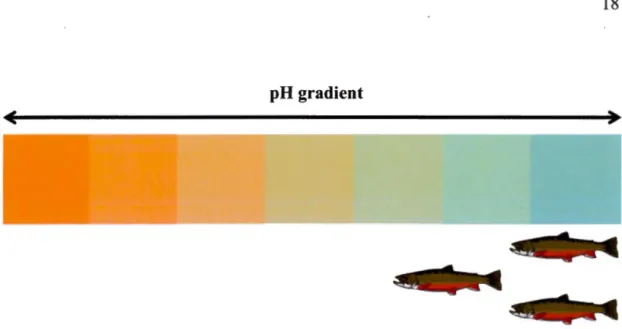
Abiotic factors (e.g. pH) can also strongly modulate the presence/absence of certain predators (Fig. 4). For example, the ecological tolerances of many fish species are exceeded in extremely saline lakes where large-bodied, predation-vulnerable but salinity-tolerant zooplankton can proliferate (Derry et al. 2003; Brucet et al. 2010). Therefore, it is important to consider both abiotic ( e.g. pH) and biotic factors ( e.g. top predators) when assessing the distribution of biodiversity in prey communities across landscapes.
pH gradient
Fig. 4 The absence/presence of fish determined along a pH environmental gradient. Due to fisb physiological intolerances to acidic pH (orange area), fish are found closer to neutral conditions (emerald blue area).
O. 6 Metapopulation
18
Theoretical models for understanding mechanisms underlying the continuum between maladaptation and local adaptation in populations differ in assumptions conceming the landscape structure and the genetic detenninism of traits underlying population-level performance traits. These theoretical models can be categorized as models of continuous landscapes with evolutionarily stable strategy models and single locus models (Brown and Pavlovic 1992; Garcia Ramos and Kirkpatrick 1997; Kirkpatrick and Barton 1997) versus models of patchy landscapes with multiple loci (Holt and Gaines 1992; Kawecki 1995; Holt 1996; Day 2000). Models that have blended these theoretical approaches are rarer (but see Kawecki (1995), Holt (1996), Holt and Gomulkiewicz (1997), Ronce and Kirkpatrick 2001, Hendry et al. 2001; Lenormand (2002); Hanski et al. 2010; Polechovà and Barton (2015). Ronce and Kirkpatrick (2001) two-patch quantitative genetic model showed how imbalances in population size between two habitat types connected by gene flow generated positive feedbacks at the population level, leading to specialization in the larger better-adapted
19 population (migrational meltdown). Migrational meltdown with potentially alternative stable equilibria corresponds to the source-sink dynamics analyzed by Kawecki (1995), Holt (1996), Holt and Gomulkiewicz (1997), Lenormand (2002), in which gene flow prevents adaptation in the habitat with a small and poorly adapted population (sink population). As an extension of the two-patch model proposed by Ronce and Kirkpatrick (2001 ), Hanski et al. (2010) expanded this idea to a network of many populations that undergo local extinctions in which maladaptation was found to decrease population growth and increase the probability of local extinction.
In a large number of models however, symmetric selection operating between habitats occurring within a landscape, have been assumed for mathematical convenience when studying evolution of quantitative traits under stabilizing selection (Urban et al. 2013). This is despite that asymmetric fitness responses to selection are common (Hughes et al. 2007; Derry and Arnott 2007; Haak et al. 2011; Porter and Rice 2012; Negrin Dastis and Derry 2016). However it has been long thought that asymmetric selection is ubiquitous in nature (Schluter 1988), maintaining sub-optimal fitness traits through a bias of the equilibrium mean phenotype away from the individual fitness optimum (Parker and Smith 1990).
O. 7 The importance of fatty acids in aquatic food webs
Fatty acids are increasingly being incorporated in food web studies (Twining et al. 2016). Severa! studies have addressed environmental and community-level determinants of EF A composition in primaiy consumers such as crustacean zooplankton (Burns et al. 2011; Lau et al. 2012; Gladyshev et al. 2015). EFAs such as polyunsaturated fatty acids (PUF As), and especially highly unsaturated fatty acids (HUFAs), can limit development, reproduction, and fitness of individual consumers at multiple trophic levels in aquatic food webs (Parrish 2009; Strandberg et al. 2015;
20 producers (Taipale et al. 2013), and are trophically-transferred from pnmary producers to higher consumers (Müller-Navara et al. 2003; Martin-Creuzburg et al. 2009; Tai pale et al. 2011; Strandberg et al. 2015; Gearheaii et al. 2017).
In aquatic ecosystems, fish consumer traits such as body s1ze, tissue composition, growth rate, reproduction, life span, degree of homeostasis, and temperature preference and tolerance (Atkinson et al. 2016), have the potential to modulate or alter CND by boosting primary production that allows phytoplankton communities to thrive owing to the greater availability of nutrients due to fish excretory processes (Vanni et al. 2006; Wilson and Xenopoulos 2011 ). This in turn can directly affect organismal traits of prey (EFAs) through consumer-mediated trophic cascades. EF As can then be potentially mediated to the population and/or community level (e.g. influencing competition for resources), with the potential to affect ecosystem structure and fonction.
O. 8 Study system
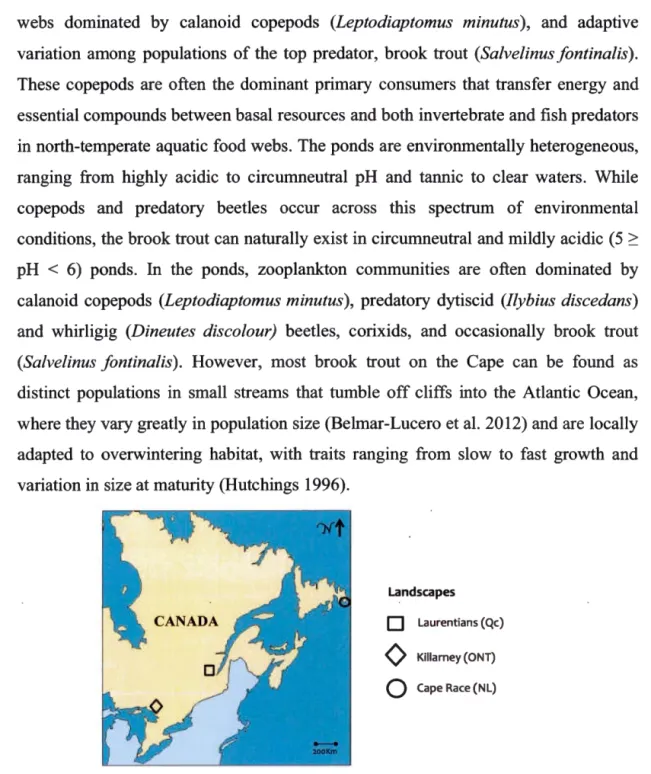
For only CHAPTER I and in order to pro vide a comparison at the larger landscape level, I will also be working in various Canadian aquatic landscapes of north-eastern North America; (1) a homogeneous pH landscape (Laurentians, Qc) of exclusively circumneutral lakes (pH 2: 6.0); (2) a heterogeneous pH landscape with a mixture of acidic and circumneutral lakes (Killarney, Ontario); and (3) a heterogeneous pH landscape in which relatively infrequent circumneutral ponds are embedded in a predominantly acidic landscape (Cape Race, NL). For the remaining chapters of my thesis (CHAPTER II, CHAPTER III), research will be centered on aquatic food webs of small ponds that span pH gradients on Cape Race (NL) (Fig. 5).
There are many characteristics of the pond system on Cape Race that are attractive as a natural laboratory for investigating abiotic and biotic ecological gradients for adaptive and maladaptive population phenotypic variation in calanoid copepods: a multitude of small pond ecosystems, broad environn1ental gradients in DOC, pH, and salinity among ponds within close proximity of each other, simplified pond food
21 webs dominated by calanoid copepods (Leptodiaptomus minutus ), and adaptive variation among populations of the top predator, brook trout (Salvelinus fontinalis). These copepods are often the dominant primary consumers that transfer energy and essential compounds between basal resources and both invertebrate and fish predators in north-temperate aquatic food webs. The ponds are environmentally heterogeneous, ranging from highly acidic to circumneutral pH and tannic to clear waters. While copepods and predatory beetles occur across this spectrum of environmental conditions, the brook trout can naturally exist in circumneutral and mildly acidic (5 ~
pH < 6) ponds. In the ponds, zooplankton communities are often dominated by calanoid copepods (Leptodiaptomus minutus ), predatory dytiscid (Ilybius discedans) and whirligig (Dineutes discolour) beetles, corixids, and occasionally brook trout (Salvelinus fontinalis). However, most brook trout on the Cape can be found as distinct populations in small streams that tumble off cliffs into the Atlantic Ocean, where they vary greatly in population size (Belmar-Lucero et al. 2012) and are locally adapted to overwintering habitat, with traits ranging from slow to fast growth and variation in size at maturity (Hutchings 1996).
Landscapes
D
Laurentians (Qc)0
Killarney (ONT)Q
Cape Race (NL)Fig. 5 Loca6on of the three study regions. Most of the detailed experimental work will be focused on