HAL Id: tel-01212488
https://pastel.archives-ouvertes.fr/tel-01212488
Submitted on 6 Oct 2015
HAL is a multi-disciplinary open access
archive for the deposit and dissemination of
sci-entific research documents, whether they are
pub-lished or not. The documents may come from
teaching and research institutions in France or
abroad, or from public or private research centers.
L’archive ouverte pluridisciplinaire HAL, est
destinée au dépôt et à la diffusion de documents
scientifiques de niveau recherche, publiés ou non,
émanant des établissements d’enseignement et de
recherche français ou étrangers, des laboratoires
publics ou privés.
Transition ductile-fragile des aciers pour gazoducs :
Étude quantitative des ruptures fragiles hors plan et
corrélation à l’anisotropie de microtexture
Franck Tankoua Yinga
To cite this version:
Franck Tankoua Yinga. Transition ductile-fragile des aciers pour gazoducs : Étude quantitative des
ruptures fragiles hors plan et corrélation à l’anisotropie de microtexture. Mécanique des
matéri-aux [physics.class-ph]. Ecole Nationale Supérieure des Mines de Paris, 2015. Français. �NNT :
2015ENMP0014�. �tel-01212488�
N°: 2009 ENAM XXXX
MINES ParisTech
Centre des Matériaux – UMR CNRS 7633 B.P.87 - 91003 EVRY Cedex
École doctorale n° 432 : Sciences des Métiers de l'Ingénieur
présentée et soutenue publiquement par
Franck TANKOUA
le 02 juillet 2015
Ductile to brittle transition in pipeline steels: Quantitative
investigation of brittle out-of-plane cracking and correlation to
microtexture anisotropy
Transition ductile-fragile des aciers pour gazoducs: Etude
quantitative des ruptures fragiles hors plan et corrélation à
l’anisotropie de microtexture
Doctorat ParisTech
T H È S E
pour obtenir le grade de docteur délivré par
l’École nationale supérieure des mines de Paris
Spécialité Sciences et Génie des matériaux
Directeurs de thèse : Anne-Françoise GOURGUES-LORENZON, Jérôme CREPIN
T
H
È
S
E
Jury
M. Jean Hubert SCHMITT, Professeur, Ecole Centrale des Arts et Manufactures de Paris Président
M. Benoît TANGUY, Ingénieur de Recherche, HDR, CEA Saclay DEN/DANS/DMN/SEMI Rapporteur
M. Javier GIL-SEVILLANO, Professeur, Université de Navarre Rapporteur
Mme Clotilde BERDIN, Professeur des Universités, ICMMO, Université Paris-Sud 11 Examinateur
M. Thomas PARDOEN, Professeur, Université Catholique de Louvain, Belgique Examinateur
M. Yazid MADI, Chargé de recherche EPF-Ecole d'ingénieurs Examinateur
Mme Anne-Françoise GOURGUES, Professeur, Centre des Matériaux, MINES ParisTech Examinateur
M. Jérôme CREPIN, Directeur de Recherche, Centre des Matériaux, MINES ParisTech Examinateur
Avant-propos
C’est toujours avec beaucoup d’émotions qu’on débute la rédaction de cette page d’avant-propos qui annonce la fin… Avec ces dernières lignes, qui pour le lecteur seront ses premières du manuscrit, je tiens à présenter mes remerciements à tous ceux qui ont contribué à l’aboutissement de cette étude. Cette thèse est le fruit d’une collaboration entre le Centre des Matériaux de l’Ecole Nationale Supérieure des Mines de Paris et le Centre de Recherche OCAS d’ArcelorMittal à Gand. Chaque centre m’a donné le meilleur tant scientifique qu’humain.
Je souhaite tout d’abord remercier Philippe THIBAUX et Steven COOREMAN qui m’ont suivi à OCAS et qui tout le long de cette thèse ont apporté leur vision industrielle au projet. J’associe à ces remerciements, Nuria, Laura et toute l’équipe métallurgie d’OCAS. Je n’oublie pas tous les techniciens d’OCAS, en particulier Andries et Marteen qui ont réalisé les essais DWTT et Charpy.
Mes remerciements vont aussi à mes directeurs de thèse au Centre des Matériaux : Anne-Françoise GOURGUES et Jérôme CREPIN. Leurs qualités tant scientifiques qu’humaines ont été pour moi un soutien inestimable. Ils ont fait preuve d’une grande disponibilité et m’ont totalement fait confiance. Je suis très reconnaissant envers Yazid MADI et Benoît TANGUY avec qui j’ai fait mes premiers pas dans le monde de la recherche au travers des stages au Centre des Matériaux et au CEA. Je leur remercie aussi d’avoir accepté de faire partie de mon jury en tant qu’examinateur et rapporteur. De même, je remercie aussi tous les autres membres du jury, Jean Hubert SCHMITT, Javier GIL-SEVILLANO, Clotilde BERDIN et Thomas PARDOEN, pour l’intérêt qu’ils ont porté à mon travail et leurs commentaires.
Tout au long de cette thèse, j’ai pu profiter des conseils des responsables scientifiques du Centre des Matériaux et en particulier André PINEAU et Jacques BESSON. Je vous exprime toute ma gratitude pour cette aide.
J’ai eu la chance de disposer de moyens expérimentaux de grande qualité au Centre des Matériaux. Mes remerciements vont d’abord à nos techniciens de l’atelier : René, Georges, Christophe, Jean-Pierre. Avec leur expérience, ils ont usiné avec une grande précision toutes les éprouvettes de cette étude, malgré la sévérité de certaines géométries. Je souhaite par la suite remercier Abdenour et Régis pour l’aide qu’ils m’ont apportée dans la réalisation des essais mécaniques. Je te remercie Anne pour ton aide avec les cartographies EBSD et je te souhaite du courage pour la suite. Je profite par la même occasion pour remercier toute l’équipe Microscopie et Analyse du laboratoire, et en particulier Fabrice, Brigitte, Maria, Lyn-thy pour leur formation en microscopie.
J’ai aussi eu la chance de profiter de moyens numériques performants et surtout de personnes prêtes à me débloquer en cas de soucis dans Zset, Abaqus ou Zmat. Je remercie Fifou, Farida, Djamel, NiKolay, Kaïs, Françoise, Lucien et Son pour cette aide.
Je remercie aussi toute l’équipe administrative qui s’occupe de la vie quotidienne du Centre des Matériaux et de l’équipe informatique avec Olivier et Gregory. Je remercie sincèrement Odile pour son aide précieuse dans mon étude bibliographique.
Pendant cette thèse, j’ai aussi pu développer mes talents footballistiques avec nos séances de foot du mercredi. Je remercie toute l’équipe de foot du Centre des Matériaux pour ces bons moments passés. De même, je remercie tout l’ensemble des doctorants, post-doctorants, permanents et stagiaires que j’ai pu rencontrer, et dont leur bonne humeur ou tout simplement leur sourire a rendu ces années de thèse agréables. Une pensée particulière pour mes amis du bureau B107 au Centre des Matériaux et du célèbre bureau « coralito » à OCAS.
Enfin je remercie tous ceux qui m’ont supporté pendant cette grande étape de ma vie : Mes parents, mes frères et sœurs et toute ma famille en générale.
1
Table of Contents
Introduction ... 3
Chapter I – Metallurgical characterization of as-received materials... 5
I.1. General presentation and reference of the two steels... 7
I.2. Chemical composition ... 7
I.3. Nature and distribution of inclusions... 7
I.4. Hardness ... 9
I.5. Microstructure ... 9
I.6. Average texture ... 12
I.7. Summary and conclusion ... 13
Chapter II – Toughness characterization of as-received materials ... 15
II.1. Literature survey ... 18
II.1.1. Battelle drop weight tear tests (DWTT) ... 18
II.1.2. Brittle-out-of plane cracking during impact tests ... 23
II.2. Results of drop weight tear tests ... 24
II.2.1. Impact toughness of Steels A and B ... 24
II.2.2. Fracture modes during DWTT and effect on impact toughness ... 24
II.2.3. Effect of the loading direction ... 30
II.2.4. Summary ... 31
II.3. Results of Charpy tests ... 31
II.3.1. Charpy impact toughness of Steels A and B ... 32
II.3.2. Fracture mode and effect on impact toughness ... 33
II.3.3. Summary of Charpy results and comparison to DWTT results ... 39
II.4. Brittle out-of-plane cracking during fracture toughness tests ... 42
II.4.1. Brittle out-of-plane cracking during tests on pre-cracked CT specimens ... 43
II.4.2. Comparison with impact tests ... 43
II.5. Discussion and conclusions ... 44
Chapter III – Plastic flow and fracture anisotropy ... 45
III.1. Introduction and state-of-the-art ... 48
III.2. Experimental approach ... 50
III.3. Plastic anisotropy and elastic-plastic behavior ... 50
III.3.1. Strain anisotropy ... 50
III.3.2. Anisotropy in strength ... 51
III.3.3. Evolution of the plastic flow behavior with temperature ... 52
III.3.4. Summary on the plastic flow behavior ... 54
III.4. Fracture resistance of the rolling plane (tensile tests along ND) ... 54
III.4.1. Fully ductile fracture mode ... 55
III.4.2. Mixed ductile-cleavage fracture mode ... 57
III.4.3. Full cleavage fracture mode ... 59
III.5. Fracture resistance of the θ-plane (tensile tests along BTD) ... 60
III.5.1. Fully ductile fracture mode ... 60
III.5.2. Mixed ductile-delamination-cleavage fracture mode ... 61
III.5.3. Full cleavage fracture mode ... 62
III.6. Fracture resistance of the TD-ND plane (tensile tests along RD) ... 63
III.6.1. Fully ductile fracture mode ... 63
III.6.2. Mixed ductile-delamination fracture mode ... 63
III.6.3. Full cleavage fracture mode ... 65
III.7. Fracture resistance of the RD-ND plane (tensile tests along TD) ... 66
2
III.7.2. Mixed ductile-delamination fracture mode ... 67
III.7.3. Mixed delamination-brittle out-of-plane fracture mode ... 67
III.7.4. Full cleavage fracture mode ... 68
III.8. Discussion and conclusions ... 69
Chapter IV – Quantitative study of cleavage stress anisotropy ... 71
IV.1. Literature survey ... 73
IV.1.1. Microstructural parameters controlling cleavage fracture in bcc steels ... 74
IV.1.2. Local approach to fracture ... 76
IV.1.3. Literature survey of physically-based cleavage fracture models ... 77
IV.2. Anisotropy in potential cleavage facet distribution ... 83
IV.2.1. The concept of potential cleavage facets ... 83
IV.2.2. Analysis of potential cleavage facets for different planes of the plate ... 87
IV.3. Anisotropy in critical cleavage stress, correlation with PCFs ... 91
IV.3.1. Procedure ... 91
IV.3.2. Critical cleavage stress along ND, BTD, RD and TD ... 92
IV.3.3. Correlation between PCF size and critical cleavage stress ... 93
IV.4. Conclusions ... 94
Chapter V – Prediction of brittle out-of-plane cracking with a deterministic approach ... 95
V.1. Introduction and state-of-the-art ... 97
V.2. Prediction of the onset of brittle out-of-plane cracking during quasi-static tensile tests on notched specimens ... 98
V.2.1. Application of the macroscopic critical stress criterion to the prediction of delamination .. 99
V.2.2. Effect of stress triaxiality ... 100
V.2.3. Effect of the ductile crack on the stress state at the onset of delamination ... 101
V.2.4. Effect of prior plastic deformation on critical cleavage stress... 105
V.2.5. Discussion of the criterion for numerical prediction of brittle out-of-plane cracking ... 106
V.3. Prediction of brittle out-of-plane cracking occurrence during impact tests on Charpy specimens ... 107
V.4. Conclusions ... 109
Chapter VI – Application: Study of delamination on pre-strained and on heat treated Steel B ... 111
VI.1. Study of delamination on prestrained Steel B (20pct-steel) ... 113
VI.1.1. Metallurgical characterization of the 20pct-steel ... 113
VI.1.2. Results of Charpy tests on 20pct-steel ... 115
VI.1.3. Quantitative study of the cleavage sensitivity along (RD-TD) plane of the 20pct-steel .. 116
VI.2. Sensitivity of Steel B to delamination after a heat-treatment ... 120
VI.2.1. Metallurgical characterization of the heat-treated steel ... 120
VI.2.2. Charpy impact behavior of the heat-treated steel ... 122
VI.2.3. Tensile behavior in the ductile to brittle transition domain ... 122
VI.2.4. Cleavage fracture behavior of the heat-treated steel ... 124
VI.3. Conclusions ... 127
Conclusions and Outlooks ... 129
A- Interrupted DWTT and results of impact tests ... 133
B- Design of NT2 geometry and results of tensile tests on smooth and notched specimens... 141
C- Elastic-plastic constitutive modelling for quasi-static tests ... 155
D- Simulation of Charpy tests: Ductile crack advance modeling up to the onset of delamination ... 175
3
Introduction
To take the increasing natural gas demand all over the world during the past decades into account, the gas pressure inside pipelines has been increased. More and more resistant pipeline steels generally produced using thermomechanically controlled process (TMCP) routes are used. A good toughness of these pipeline steels at lower temperatures is required to avoid long brittle crack propagation.
In order to validate the toughness requirement, a first test so-called “full scale test” could be used. In this test, investigations are performed on a real linepipe after initiation of a brittle crack with explosive charge. The crack propagation distance before arrest is evaluated. In addition to being excessively expensive and time consuming, the full scale test could not be easily performed at very low temperatures. Therefore, in linepipe industry the drop weight tear test (DWTT) is the alternative test commonly used for impact toughness validation. In DWTT test, a three point bending specimen with the same thickness as the pipeline wall is impacted by a mass. The brittle area measured after DWTT should be lower than 15% of the total fracture area to consider the specimen as valid. Steels which fulfilled this requirement were found to also be validated according to full scale test.
The so-called Charpy test, the famous impact toughness test, is also used in pipeline industry. This test is especially convenient for new pipeline steel design, because of the small size of the specimen comparing to that for DWTT. A good correlation between DWTT and Charpy tests exists for lower pipeline steel grade (<X70). Unfortunately, this correlation is partly lost for modern pipeline steel grades generally obtained by TMCP.
The difference in experimental conditions between Charpy and DWTT tests might not be the major cause of the poor correlation, since for lower grades this correlation still exists. One plausible cause could be the difference in the criterion of validation. For Charpy tests, a minimal absorbed energy is required and for DWTT it is a maximal brittle area imposed. But, in modern pipeline steels, brittle out-of-plane cracks observed within the ductile to brittle transition domain could increase this brittle area and could also affect the impact toughness evaluation differently in Charpy and DWTT tests.
These brittle out-of-plane cracks (Figure 1) are mainly due to delamination, which propagates along the rolling plane, and to brittle tilted fracture (BTF), which propagates along so-called θ-planes (tilted by 40° around the rolling direction). This topic also raises the scientific problem of the anisotropy in brittle fracture, as BTF does not propagate in the usual Mode I. This study aims at answering the three
4 following questions: How does brittle out-of-plane cracking affect the ductile to brittle transition? Which are the origins of brittle out-of-plane cracks? How could we predict brittle out-of-plane cracking? To this aim, the local approach to fracture was applied. As a result, the study started with the investigation of brittle out-of-plane cracking on impact specimens. Then, anisotropy of brittle fracture was characterized using tensile specimens, so that the planes associated to brittle out-of-plane crack propagation could be studied via mode I loading. From these tests, the origin of brittle out-of-plane cracks was investigated and criteria for their prediction were proposed. Hypotheses concerning physical mechanisms that control brittle out-of-plane fracture were proposed. Some of them were then tested by modifying the as-received material. This approach is closely followed in the following manuscript.
In chapter I, the two materials under investigation are presented.
In chapter II, brittle out-of-plane cracking is studied from two kinds of impact tests, namely, Charpy tests and Battelle drop weight tear tests (DWTTs). The effect of these cracks on the impact toughness is analyzed. The occurrence of these fracture modes is compared for Charpy and DWTT specimens. Further comparison is made with fracture of precracked compact tensile specimens tested in a quasi-static manner.
In chapter III, tensile tests are reported along different directions to study the anisotropy in brittle fracture and the sensitivity to cleavage along the rolling plane and along the θ-plane.
In chapter IV, a quantitative value is assigned to the sensitivity to cleavage fracture along each plane, via calculation of critical cleavage stresses. This criterion was derived from thorough mechanical analysis of tests on tensile specimens. The microtexture along each plane was quantified to correlate the anisotropy in critical cleavage stress to microtexture anisotropy.
In chapter V, going back to brittle out-of plane fracture, a criterion is proposed to numerically predict the occurrence of delamination cracking on tensile and Charpy specimens. The effects of a ductile micro-crack and of plastic deformation have been taken into account.
In chapter VI, effects of plastic deformation and of initial microtexture anisotropy on critical cleavage stress are tentatively determined in more detail. To this aim, the as-received material was modified by prestraining or by a heat treatment, and the resulting sensitivity to delamination was studied using a simplified approach based on the above described methodology.
Figure 1: Schematic drawing of brittle out-of-plane cracking in DWTT specimens. Delamination propagates along the rolling plane and BTF propagates along θ-plane.
5
Chapter I – Metallurgical characterization of
as-received materials
Table of Contents
I.1. General presentation and reference of the two steels... 7
I.2. Chemical composition ... 7
I.3. Nature and distribution of inclusions... 7
I.4. Hardness ... 9
I.5. Microstructure ... 9
I.6. Average texture ... 12
I.7. Summary and conclusion ... 13
This first chapter focuses on the metallurgical characterization of the two as-received steels provided
for this study. The chemical composition, inclusion distribution, hardness, microstructure and texture
of both steels are presented.
6
Résumé
Dans ce chapitre, les deux aciers de nuance X70 de l’étude (aciers A et B) sont présentés. La
composition chimique, la nature et distribution des inclusions, la microstructure et la dureté
des aciers ont été étudiées dans l’état de réception.
La composition chimique des deux aciers est assez proche avec un bas niveau en soufre (<30
ppm) et des taux de carbone et nickel légèrement plus élevés pour l’acier A. Les inclusions
majoritaires dans les deux aciers sont des MnS et d’autres complexes riches en aluminium,
oxygène, magnésium et calcium. Des inclusions riches en titane ont aussi été observées pour
l’acier B. Bien que les deux aciers aient des fractions inclusionnaires surfaciques très proches
(2×10
-4), l’acier B possède plus de particules et donc une distance inter-particulaire plus
faible. La dureté Vickers des deux aciers est aux environs de 210 et leur microstructure est
essentiellement ferritique avec quelques colonies perlitiques. Des entités allongées suivant la
direction de laminage, constituées de sous-grains, recouvrent toute la surface analysée. Le rôle
de ces entités sur la rupture par clivage sera mis en évidence dans cette étude.
7
I.1.
General presentation and reference of the two steels
The two steels of this study have been provided by ArcelorMittal. They have been taken from hot-rolled coils used for linepipe manufacturing, which were obtained after thermomechanical conthot-rolled processing. The first steel, referenced as Steel A hereafter, is 19.5-mm-thick and the second steel, referenced as Steel B hereafter, is 23–mm-thick. Both steels are X70 grade. The three principal directions of the plate are referenced as RD (rolling direction), TD (transverse direction) and ND (normal direction).
I.2.
Chemical composition
The chemical composition of the steels is presented in Table I-1. Both are low alloy steels, with a slightly higher amount of carbon and nickel for Steel A. The level of manganese is higher for Steel B. The sulfur content, almost identical for both steels, is low.
C Mn Si P Ni+Cr+Mo Al Ti+Nb Cu S Steel A 0.047 1.18 0.24 0.013 0.640 0.018 0.083 0.31 0.0025
Steel B 0.031 1.7 0.21 0.013 0.403 0.05 0.138 0.28 0.0018
Table I-1: Chemical composition of Steel A and Steel B (wt. %)
I.3.
Nature and distribution of inclusions
Analyzing the nature, size and distribution of inclusions is important for the study of ductile fracture. In fact, these inclusions are expected to generate void nucleation. Quantitative analysis of inclusions was performed on INCA equipment attached to the scanning electron microscope available at OCAS. The analysis was done on polished specimens in the (RD-ND) plane. A scanned area of 1.31×10⁶
µm2, divided into 276 elementary fields of 4.76×103 µm2 each in area was considered for Steel A; the same elementary field area was also considered for Steel B but in that case only 142 fields have been scanned. The size of these scanned areas was chosen to obtain representative results.
The observed inclusions are: ((Al,Mg)-oxide + sulfide + Ti); ((Al,Mg)-oxide + (Ca,Mn)-sulfide); (Al,Mg)-oxide; Al-oxide; Ti-rich particles, and MnS sulfide. The aspect ratio for all these inclusions remains close to 1 and is slightly higher for Al-Oxide (sometimes higher than 2) in Steel A. This suggests an equiaxed shape of inclusions.
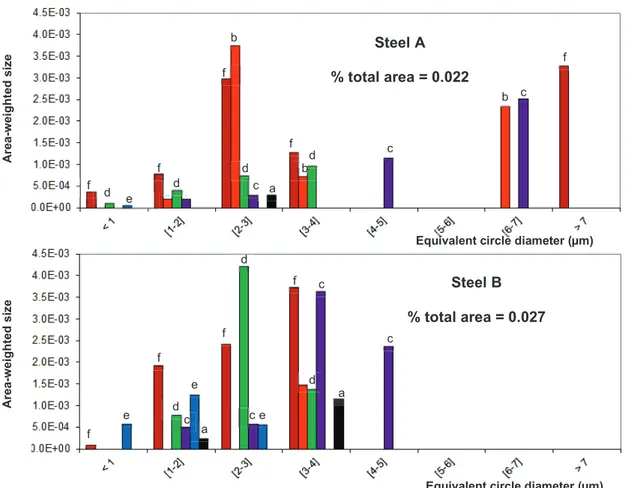
The size distribution of inclusions (equivalent circle diameter) in number is presented in Figure I-1. Steel A mostly contains MnS, ((Al,Mg)-oxide+ (Ca,Mn)-sulfide) and (Al,Mg)-oxide. Steel B also exhibits a large amount of MnS, and (Al,Mg)-oxide with additional Ti-rich particles. No obvious correlation has been found between the nature and the size of inclusions. The small size of MnS particles, especially for Steel A, highlighted the benefit role of calcium treatment. 76 inclusions have been counted for Steel A and only 55 inclusions counted for Steel B. Before dropping into any conclusion, it is important to normalize this number of inclusions by the total scanned area, since the scanned area was almost two times higher for Steel A. For an equivalent area, Steel B has 40% more inclusions than Steel A. Moreover, according to Figure I-1, the inclusion size is uniformly distributed in the range [1 – 4 µm] within Steel B. The inclusion size is more scattered for Steel A, with many inclusions lower than 1 µm and some inclusions which can reach 7 µm. The area-weighted size distribution of inclusions is presented in Figure I-2.
8
f
Steel A
Scanned area =1.31×106 µm2
Equivalent circle diameter (µm)
N um ber of incl usio ns
Equivalent circle diameter (µm)
N um ber of incl usio ns Steel B Scanned area =6.76×105 µm2 f f f f e e e e c c c c c d d a a f d e f b b d c f b d dc a b bd c c b f d b b c b
Equivalent circle diameter (µm)
A re a-we ighte d si ze Steel A % total area = 0.022
Equivalent circle diameter (µm)
A re a-we ighte d si ze Steel B % total area = 0.027 f d e f f b d c c a f b bd c c b f d f f f f e e e c c c c d d a a d e c Inclusions Number AlMg-Oxide+ CaMn-sulfide+ Ti 1 a AlMg-Oxide+ CaMn-sulfide 14 b AlMg-Oxide 12 c Al-Oxide 4 d Ti-rich particles 2 e MnS 43 f Inclusions Number AlMg-Oxide+ CaMn-sulfide+ Ti 2 a AlMg-Oxide+ CaMn-sulfide 1 b AlMg-Oxide 10 c Al-Oxide 7 d Ti-rich particles 20 e MnS 15 f
Figure I-1: Distribution in number of inclusions by equivalent circle diameter and total number of inclusions
9 The total area fractions of inclusions are respectively 2.2×10⁻⁴ and 2.7×10⁻⁴ for steels A and B. Since these values are close for both steels and at the same time Steel B has a 40% higher number of inclusions, the average distance between inclusions is expected to be lower for Steel B than Steel A. Investigations of ductile fracture reported in chapter III showed that the nature of particles from which voids nucleated was in good agreement with the inclusion analysis. The lower average distance between inclusions in Steel B facilitates void coalescence. Actually, the number density of voids is higher in Steel B than in Steel A.
I.4.
Hardness
Hardness analysis was performed with two aims: characterizing the average steel hardness and investigating the heterogeneity within both steels. Vickers hardness measurements were performed on BUEHLER equipment with an indentation load of 300g and indentation duration of 10s per point. The hardness evolution across the thickness of the steel plates has been measured within the (RD-ND) plane. The distance between two indentation points was set to 0.5mm. Figure I-3 gives the results of this analysis. Taking the experimental uncertainty of hardness measurement (around 10 Vickers) into account, the hardness of Steel B could be considered as homogenous across the plate thickness. Concerning Steel A, the hardness measured close to the external skin is slightly higher than in the rest of the plate. This difference could probably result from slight hardening generated during hot coiling. Nevertheless, the discrepancy between the skin and mid-thickness is less than 10%, thus Steel A could be also considered as macroscopically homogenous across its thickness. The average values of hardness of steels A and B are respectively HV0.3 = 210±10 and HV0.3 = 220±10.
I.5.
Microstructure
The microstructure was observed using light optical microscopy after Nital etching. SEM observations with backscattered electrons were also carried out to obtain images at higher magnifications. Preliminary observations performed at mid-thickness, quarter thickness and close to the outer surface confirmed the homogeneity of both steels along the thickness as suggested in the previous section. Consequently, quantitative observations were performed only around mid-thickness within the (RD-ND) plane.
Figure I-4 shows the results of optical and SEM observations on Steel A. The steel is essentially composed of ferrite grains with rare pearlite colonies observed at some grain boundaries (Figure I-5). No pronounced banded structure was observed, even if ferrite grains seem to be elongated along the rolling direction. Some elongated entities that are relatively dark in SEM images were found all over the observed region. Closer views of these entities revealed the presence of sub-grain boundaries. These entities with a typical length of 30 µm were surrounded by smaller equiaxed ferrite grains (2 – 5 µm) and rare elongated ferrite grains with a typical length of 10 µm along RD.
HV0.3 Distance to inner surface (mm) Internal skin External skin Mid-thickness HV0.3 Steel A HV0.3 Distance to inner surface (mm) Internal skin External skin Mid-thickness Steel B
10
Pearlite colony
ND RD
Figure I-5: Pearlite colony observed on grain boundaries (Steel A)
Figure I-4: Optical and SEM observations of Steel A microstructure: Elongated entity surrounded by small circular ferrite grains
Zoom on the entity
Elongated ferrite grains
Equiaxed ferrite grains
ND
RD Elongated entities
Zoom on the entity
11 Figure I-6 shows the microstructure of Steel B. The microstructure as for Steel B is essentially ferritic, with no pronounced banded structure. The elongated entities observed in Steel A are also present in Steel B. These entities, which are thinner in Steel B, exhibited more pronounced sub-grain boundaries. Equiaxed ferrite grains (1 – 4 µm) were also observed.
Elongated entities observed within both steels have been characterized in more detail in chapter IV. At this step, we can keep memory that they are clusters of sub-grains that could be somewhat detrimental if well oriented for cleavage fracture. In that case, the higher density of these entities might lead to easier cleavage crack propagation.
Figure I-6: Optical and SEM observations of Steel B microstructure: Elongated entity surrounded by small circular ferrite grains
Elongated entities
Zoom on the entity
Equiaxed ferrite grains
ND RD
Zoom on the entity
Pearlite
12
P
H
I
Phi1
Constant Phi2 = 45
0 10 20 30 40 50 60 70 80 90 0 10 20 30 40 50 60 70 80 90 3.78 3.15 2.51 1.88 1.25 0.61I.6.
Average texture
Texture analysis has been done to investigate the anisotropy in crystal orientation distribution in the two steels. The orientation distribution functions (ODF) sections at φ2 = 45° (Bunge angle notation)
have been determined by X-ray diffraction. After conventional cloth polishing down to 1 µm diamond paste, further polishing using OPS colloidal silica solution was carried out to remove superficial hardening and increase the surface quality of the sample. The analysis was performed along the (RD-TD) plane at mid-thickness.
The results of ODF sections at φ2 = 45° are presented in Figure I-7 and Figure I-8 respectively for
Steels A and B. Even if Steel A has a relatively stronger average texture than Steel B, no sharp texture has been observed in both steels. This suggests that the plastic anisotropy of these steels might be low, at least for small strains, i.e., before extensive crystal rotation induced by plastic deformation.
Figure I-7: ODF section (j2 = 45°) of Steel A
Figure I-8: ODF section (j2 = 45°) of Steel B
Max Max 1.5 2.5 3.5 4.5 1. 2. 3. 4. 5. .
13
I.7.
Summary and conclusion
The two steels under study are API X70 grade used for linepipe manufacturing. The chemical compositions of both steels are close to each other, with slightly higher contents of carbon and nickel in Steel A; the level of sulfur is lower than 30 ppm. The observed inclusions are mainly MnS and some complex particles containing aluminum, oxygen, magnesium and calcium. Titanium-rich inclusions were also observed in Steel B. The volume fraction of inclusions, around 2×10⁻⁴, is similar for both steels. However, the number of inclusions is 40% higher within Steel B, suggesting a lower inter-inclusion distance for this steel. The size distribution of inter-inclusions is also more homogeneous in Steel B compared to Steel A, which contains both coarse and fine inclusions. This distribution of inclusions is to be correlated to the onset of coalescence during ductile fracture in chapter III. The average values of hardness of the two steels were found similar, around (210-220) HV0.3 and no obvious
evolution in hardness across the thickness was found. The microstructure of these steels is essentially ferritic. Some elongated entities wherein sub-grain boundaries were observed, covered all the volume of the steel. These entities which might be a problem for cleavage fracture are investigated in chapter IV. The average texture is rather weak for both steels.
15
Chapter II – Toughness characterization of
as-received materials
Table of Contents
II.1. Literature survey ... 18 II.1.1. Battelle drop weight tear tests (DWTT) ... 18 II.1.2. Brittle-out-of plane cracking during impact tests ... 23 II.2. Results of drop weight tear tests ... 24 II.2.1. Impact toughness of Steels A and B ... 24 II.2.2. Fracture modes during DWTT and effect on impact toughness ... 24 II.2.3. Effect of the loading direction ... 30 II.2.4. Summary ... 31 II.3. Results of Charpy tests ... 31 II.3.1. Charpy impact toughness of Steels A and B ... 32 II.3.2. Fracture mode and effect on impact toughness ... 33 II.3.3. Summary of Charpy results and comparison to DWTT results ... 39 II.4. Brittle out-of-plane cracking during fracture toughness tests ... 42 II.4.1. Brittle out-of-plane cracking during tests on pre-cracked CT specimens ... 43 II.4.2. Comparison with impact tests ... 43 II.5. Discussion and conclusions ... 44
This chapter focuses on the toughness of the two as-received steels. Impact toughness was
investigated with both Battelle drop weight tear tests (DWTTs) and Charpy tests. Fracture toughness
was characterized by quasi-static tests on compact tensile (CT) specimens.
Before studying the fracture toughness of our steels, a literature survey on Battelle drop weight tear
tests commonly used for pipeline steels characterization is reported. This literature survey also
includes a study of brittle out-of-plane cracking observed after impact tests.
The results of Battelle drop weight tear tests and Charpy tests are then reported for Steels A and B.
Detailed toughness values are reported in Appendix A. In this chapter, special attention has been paid
to the fracture mode analysis and to the effect of brittle out-of-plane cracking on impact toughness.
Finally, fracture modes occurring during quasi-static tests on compact tensile specimens have been
analyzed and compared to the ones exhibited in impact tests.
16
Résumé
La résilience et la ténacité de nos aciers sont à l’honneur dans ce deuxième chapitre. Les
résultats d’essais de flexion par choc sur éprouvettes DWTT et Charpy des deux aciers sont
analysés, de même pour les essais de ténacité qui ont été effectués sur des éprouvettes CT
sous sollicitation quasi-statique.
Dans un premier temps, une étude bibliographique a été faite sur les essais DWTT et leur
instrumentation. Cette étude a permis de mettre en évidence des ruptures fragiles hors-plan
qui se manifestent pour les températures situées dans la transition ductile-fragile.
Une étude approfondie de ces modes de rupture fragile hors-plan après essais DWTT a été
faite sur nos aciers. Les deux ruptures fragiles hors-plan généralement observées sont : Le
délaminage qui se propage par clivage dans un plan parallèle au plan de laminage et la rupture
fragile en biseau (BTF) qui se propage par clivage dans des plans
θreliés par de microfissures
ductiles. Ces plans
θsont inclinés de 40° autour de l’axe RD par rapport au plan de laminage,
contrairement à l’anti-plan
θqui est, lui, incliné de 40° autour de l’axe TD. Contrairement au
délaminage qui n’est pas pris en compte lors de l’évaluation de la taille de la zone fragile
après l’essai DWTT, le BTF est pris en compte et par conséquent affecte directement la
résistance à l’impact de l’acier selon la norme API5L. Le BTF qui est observé après essais
DWTT sur des éprouvettes prélevées dans la direction TD, ne l’est plus quand l’éprouvette est
prélevée dans la direction RD. Ceci semble souligner le rôle important que jouerait la
microstructure sur l’apparition du BTF, avec entre autres le rôle des plan
θ. Pour une
éprouvette prélevée dans la direction TD, le BTF se propage dans les plans
θ ;par contre pour
une éprouvette prélevée dans la direction RD, l’anti-plan
θremplace le plan
θet dans cette
nouvelle configuration le BTF n’a pas été observé. Pour ce qui est du délaminage, l’amorçage
peut se faire sur la zone ductile triangle ou le slant ductile. Pour certaines éprouvettes le
délaminage a subi une rotation pour rejoindre le plan principal de sollicitation. Avec le slant
ductile, le délaminage est l’un des sites d’amorçage du BTF.
L’analyse des ruptures fragiles hors-plan sur éprouvettes Charpy a aussi signalé la présence
de délaminage et de BTF. Deux types de délaminage ont été identifiés : Le délaminage de
type 1 qui amorce au niveau de l’entaille et sans avancée ductile, et le délaminage de type 2
où une avancée ductile est observée avant le délaminage. Le délaminage de type 1 observé
aux basses températures (-100°C) est généralement le site d’amorçage d’autres ruptures
17
fragiles hors-plan qui se propagent dans l’ensemble de l’éprouvette étant donnée la petite
taille du ligament. Le délaminage après une propagation dans le plan de laminage peut subir
une rotation progressive pour rejoindre le plan principal de sollicitation. Une autre possibilité
est de voir le BTF qui amorce sur une microfissure de délaminage.
Une comparaison entre les résultats d’essais Charpy et DWTT montre que les ruptures
fragiles hors-plan sont visibles à de plus hautes températures pour l’essai Charpy, conduisant
ainsi à une température de transition ductile-fragile plus élevée. La longueur du ligament des
éprouvettes Charpy semblerait insuffisante pour une propagation du BTF après de grandes
avancées ductiles comme c’est le cas pour les éprouvettes DWTT.
Les ruptures fragiles hors-plan ont aussi été mises en évidence sur éprouvettes de ténacité
CT sollicitées en quasi-statique. Ceci montre que ces modes de rupture ne sont pas
nécessairement liés aux phénomènes dynamiques. La compréhension de l’origine des ruptures
fragiles hors-plan passera par l’analyse de l’anisotropie de la rupture par clivage avec une
étude de la réponse des plans
θet de laminage aux sollicitations de traction en mode I.
18
II.1.
Literature survey
This literature survey concerns Battelle drop weight tear tests and focuses on the brittle out-of-plane cracking observed during impact tests. Readers interested by a detailed literature survey of the Charpy test procedure could refer to [1].
II.1.1.
Battelle drop weight tear tests (DWTT)
a) Introduction
Avoiding the propagation of long brittle cracks is one of the major issues in pipeline industry. To ensure the safety of linepipes, the test originally used was the so-called “Athens test”. It is a full-scale burst test on a section around 200 m in length, pressurized with natural gas (Figure II-1). From this test, it was possible to know whether a crack initiated in the linepipe would propagate or not in a catastrophic manner i.e. would arrest after only a long distance.
Burst tests are expensive and not convenient for experimental campaigns where many temperatures and materials are evaluated. Consequently, an alternative laboratory-scale test was needed, especially for alloy development and quality control. The work of Battelle Memorial Institute on this alternative laboratory-scale test resulted in the so-called drop weight tear test. The Battelle drop weight tear test (DWTT) has been adopted by the American Petroleum Institute in 1965 as recommended practice API 5L3.
Nowadays, DWTT is widely used to evaluate the impact toughness of pipeline steels within the ductile to brittle transition. As for Charpy tests, a notched three point bending specimen is impacted by a hammer. Since specimens are larger for DWTT, a steady-state propagation regime could more likely be reached than for Charpy tests. Thus, it gives a better prediction of pipeline burst test results than classical Charpy tests for linepipe applications [3]. A high number of papers have been published on DWTT [4-11].
b) Procedure and typical experimental results
The experimental procedure of DWTT is available from API 5L3 standard [5]. The specimen is impacted with a hammer and the percent shear area is evaluated. As prescribed by the standard, the specimen thickness should be the same as that of the wall pipe unless the pipe thickness is higher than 19 mm. Specimens taken from pipe with wall thickness greater than 19mm shall be either: the full wall thickness or reduced in thickness down to 19mm with a reduction of the test temperature. Two kinds of notch geometry could be used for the specimen: Pressed notch (made by indentation) or Chevron notch (made by machining). Complete dimensions of the specimen are presented in Figure II-2. Since the specimen dimensions are much greater than those of a Charpy specimen, the impact energy that is necessary for this test is significantly higher than that for Charpy tests, and specific equipment (hammer attached to a falling weight) is used for this test (Figure II-3).
19
After DWTT, the fracture surface of the specimen is observed by eye and the percentage of shear area is measured. A minimal shear area percentage of 85% is required for the fulfillment of the API 5L3 standard requirement [5]. In fact, it has been assumed that for such values of shear area, the material is sufficiently tough to resist crack propagation in a full scale burst test [3]. As can be observed in Figure II-4, the brittle area could be easily identified by its shiny aspect. The area with a silky or dull aspect is shear (ductile) fracture. Due to boundary conditions (pressed notch and hammer impact zones), zones at both ends of the fracture surface are not taken into account for the evaluation of the percent shear area.
Figure II-2: Dimension of Battelle specimens, hammer and anvils according to API 5L3 standard [5]
Hammer
2.
19
m
Figure II-3: Battelle drop weight tear test equipment
No
tch
Brittle area (shiny) Shear lips (ductile)
Imp ac t z o n e Zone of interest ND RD 10 mm
Figure II-4: Typical fracture surface of pipeline Steel A at -30°C, detailed study reported in the second part of the chapter
20
c) Instrumentation of Battelle drop weight tear tests
By using conventional DWTT equipment, the shear area percentage is the only measurement extracted from the test. But over the years, this measurement became no longer sufficient and more detailed information about the mechanical behavior of the steel seemed necessary, for instance the fracture energy and the crack propagation velocity.
- Fracture energy
A first way to measure the fracture energy from DWTT is to use a pendulum drop weight tear tester. The drawback of this method is that only global fracture energy could be extracted. There is no way to distinguish the energy consumed during crack initiation and the one consumed by crack propagation. For this reason, the energy absorbed during instrumented DWTT is more commonly extracted from load-displacement curves [6]. As observed in Figure II-5, before the maximum load all the area under the curve is associated to crack initiation. The complementary area corresponds to the energy that is necessary for crack propagation. Now, the issue is to find a method to measure the load and displacement values.
The load evolution is generally measured with sensors fixed on the hammer. In most cases, the value of displacement is generated from the load measurement using the second Newton’s law. In fact, if neglecting all contact issues, the deceleration of the hammer is proportional to the applied load. From this deceleration, the velocity and then the displacement of the hammer could be extracted. This method is an indirect way to determine displacement and might lead to some inaccuracy. This explains why some authors as Wilkowski [7] used high-speed camera to measure the specimen displacement.
- Crack propagation velocity
Measurement of the crack propagation velocity could be interesting, especially to compare the crack speeds observed during drop weight tear tests and during full scale burst tests. Two techniques could be used to measure this velocity: High speed camera or electrical wires (Figure II-6). Crack propagation is divided into three stages: Crack initiation, steady-state propagation and crack arrest (or deceleration). Figure II-7 shows the evolution of the crack length and crack tip opening angle (CTOA) of two specimens during drop weight tear tests. The three stages of crack propagation are well visible on the crack length evolution curve. Crack initiation is associated to a zero value crack speed; Steady-state propagation is associated to a constant value of the crack speed; Crack deceleration or arrest is associated to a decreasing value of the crack speed.
Maximum load
Load (kN)
Displacement (mm)
Initiation
Propagation
21
Moreover, Figure II-7 shows that the CTOA value remains constant during steady-state propagation. There seems to exist a relationship between fracture speed and CTOA within the steady state propagation stage. Wilkowski et al. [7] showed that the higher the CTOA value, the lower the crack speed during the steady state stage (Figure II-8). Other authors [8] proposed a correlation between the CTOA at steady state and DWTT propagation energy (Figure II-9). For all these reasons, CTOA at steady state could be considered as an intrinsic parameter for impact toughness. Some authors as O’Donoghue et al [12], which worked on fracture propagation models for linepipes chose a crack arrest criterion based on the CTOA at steady state during DWTT. The crack propagating during full scale burst tests was assumed to be arrested as soon as the CTOA value predicted by the model becomes higher than the critical CTOA value extracted from DWTT.
d) Abnormal fracture appearance
According to the API 5L3 standard, for a DWTT test to be valid, the fracture surface should exhibit cleavage fracture under the notch tip, which will turn into ductile fracture during propagation of the crack, with the exception of specimens exhibiting complete ductile fracture. Every time when the ductile shear crack turns into a cleavage crack, it is considered as abnormal fracture appearance (AFA). Two types of AFA are generally observed: The first type occurs when the ductile shear crack is initiated from the notch root; the second type, so-called “inverse fracture”, is similar to the first type, but in that case there is a cleavage crack close to the impacted region (Figure II-10).
Electrical wires
Figure II-6: Fracture crack velocity measured with electrical wires and high-speed camera [7]
Initiation Arrest
Arrest
Initiation
22
Figure II-8: CTOA vs. fracture speed (feet per second) during steady state propagation [7]
Figure II-9: Correlation between CTOA at the steady state and DWTT propagation energy [8]
Abnormal fracture (Type1)
Cleavage fracture Ductile shear
Abnormal fracture (Type2) Ductile shear
Cleavage fracture Inverse fracture
ND RD No tch RD No tch Steel A, -30°C Steel A, -40°C
23 This abnormal fracture appearance is frequently observed on DWTT fracture surface of modern pipeline steels [8-9]. The first type can be partially solved by inserting a fatigue pre-crack or a chevron notch instead of a conventional pressed notch, so that cleavage fracture could more easily initiate from the notch root. Even if including a chevron notch enables one to reduce Type 1 abnormal fracture appearance, the machining cost is higher and the shear area percentage is generally 5-8% lower than for a pressed notch [8]. Type 2 abnormal fracture mode with inverse fracture is not removed by using chevron notches. According to [8-9], this fracture mode is mainly induced by the work hardening due to hammer impact. Consequently, the high plastic deformation introduced by hammer impact is claimed to play an important role during this inverse fracture. The shear area percentage is decreased by the presence of inverse fracture and thus toughness properties are deteriorated. A closer look on the inverse fracture surface yet shows that the brittle crack does not obviously initiate from the back of the specimens, and it propagates out of the main loading plane. It could be out-of-plane brittle cracking instead of inverse fracture, at least in some cases. Consequently, it seemed necessary to study brittle-out-of plane cracking.
II.1.2.
Brittle-out-of plane cracking during impact tests
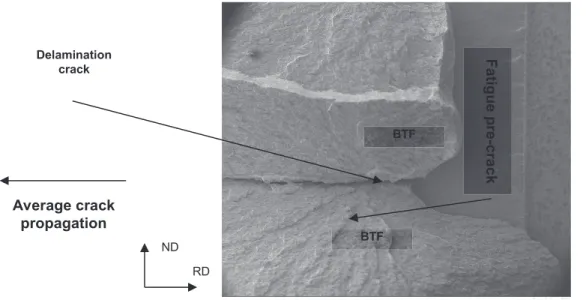
Brittle out-of-plane cracking is associated to all brittle cracks which propagate within a plane other than the main loading plane (i.e. the plane perpendicular to the direction of applied load). This phenomenon is more pronounced within the ductile to brittle transition. The most widely known and studied brittle out-of-plane cracking is delamination fracture [13-24]. This delamination fracture propagates within the rolling plane (Figure II-11). Another brittle out-of-plane cracking is the so-called brittle tilted fracture (BTF), also called brittle slant in some papers [2, 24]. The propagation plane of BTF is macroscopically tilted by an average angle of 40° around RD, with respect to the rolling plane [2,24].
a) Delamination cracking
Delamination cracking generally occurs by cleavage or by ductile fracture along MnS-rich bands. In some cases, cleavage fracture could be completed or replaced by intergranular fracture. Cleavage fracture initiates from interfaces between phases, or from intersections between {100} and {111}
DWTT at -20°C, Steel A Charpy at -20°C [17] ND RD RD ND Delamination fracture DWTT at -30°C, Steel A Charpy at -60°C [23] RD ND
Brittle tilted fracture
ND
RD
10 mm 10 mm
0.25 mm 0.5 mm
24 planes, or from flat inclusion decohesion zones. Some authors as [14] observed delamination after large plastic deformation leading to uncommon cleavage facets. This fracture mode was called quasi-cleavage. Delamination fracture is sensitive to microstructure (banded structure, segregation and shape, dimensional anisotropy of grains), presence of inclusions (mainly MnS) and texture (average distribution of {100} planes) [16].
According to the API 5L3 standard, delamination cracks are not taken into account for the shear area percentage measurement. Even if some authors like [13] and [17] support that delamination cracks do not really deteriorate the impact toughness and sometimes could increase the fracture resistance of steels, the main tendency reported in literature is that delamination fracture decreases the upper shelf energy. According to Figure II-11, delamination cracks could rotate to join the main loading plane or could be the initiation point of other brittle cracks. This might suggest a negative effect of delamination on impact toughness.
b) Brittle tilted fracture
Brittle tilted fracture which occurs by cleavage might be influenced by the microstructure and texture (distribution of {100} planes) [2]. It is clearly detrimental to the fracture resistance of pipeline steels. In DWTT data processing, the brittle tilted area is taken into account for the measurement of the percent shear area and thus, reduces impact toughness. Hara [13] also showed that the presence of brittle tilted fracture drastically decreases the fracture energy of pre-cracked DWTT specimens. Finally, the presence of brittle tilted cracks may have further consequences on the propagation of the main crack. Impact tests have been carried out on our as-received steels to investigate their impact toughness and to study brittle out-of-plane cracking. Special attention has been paid to analyze the effect of these brittle out-of-plane cracks on toughness properties. Occurrence of brittle out-of-plane cracking has also been investigated during quasi-static tests via CT tests, to assess the influence of dynamic loading conditions.
II.2.
Results of drop weight tear tests
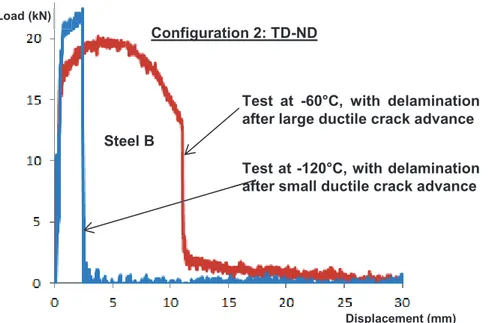
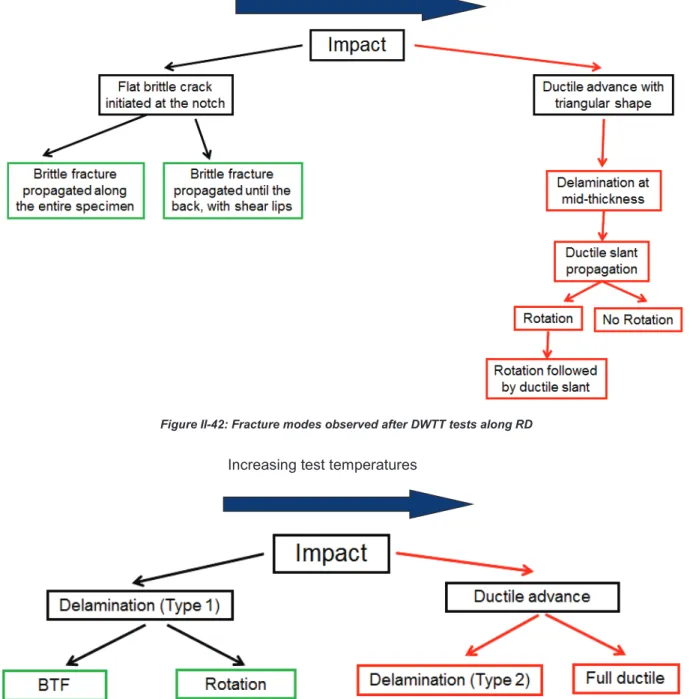
Battelle drop weight tear tests were performed on pressed notch specimens taken along the transverse direction TD, according to API 5L3 standard. Full thickness geometry was considered for Steel A (19.5 mm). For Steel B, the plate thickness was reduced from both sides from 23 mm to 19 mm. These tests were done on the instrumented DWTT equipment of OCAS, with a hammer of 985 kg hanging 2.19 meters above the specimen. The maximal energy provided by the hammer is 21 kJ and the speed at the impact is 6.5 m/s. Specimens were cooled down to various temperatures between 0°C and -100°C, after immersion into a batch of silicone solution for temperatures higher than -70°C or with a climatic chamber for temperatures lower than -70°C. Some interrupted tests (reported in appendix A) were performed on Steel B at -60°C to study the interaction between fracture modes. Finally, some specimens of Steel B taken along RD were tested after being flattened by four-point bending (because of the hot coil geometry), so that anisotropy issues on brittle out-of-plane cracking could be studied.
II.2.1.
Impact toughness of Steels A and B
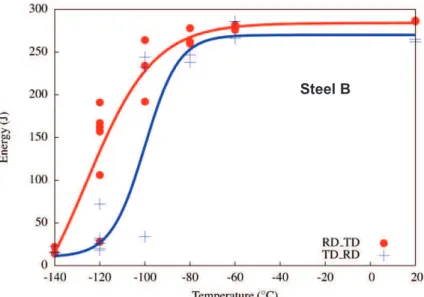
The evolutions of impact energy and shear area percentage with temperature are presented in Figure II-12 and Figure II-13 respectively for Steels A and B. The fracture appearance transition temperature (FATT) at 50% was found around -60°C for both steels. The temperature associated to 85% shear percentage (required by API 5L standard) was around -20°C for Steel A. This temperature seemed to be lower for Steel B, but there is not enough data at higher temperature to extract an accurate value. In a general tendency, the shear area percentage is slightly lower for Steel B than Steel A.
II.2.2.
Fracture modes during DWTT and effect on impact toughness
The fracture surface of DWTT specimens generally exhibits many fracture modes which interact together. This section presents these fracture modes, their evolution with temperature and how they affect the impact toughness properties.
25
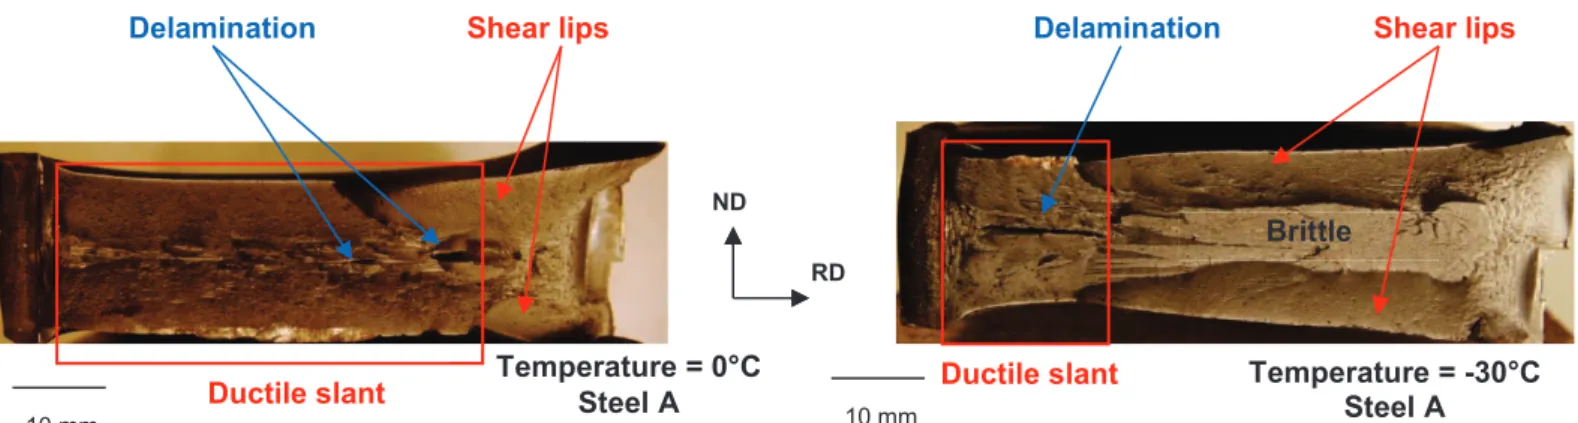
a) Ductile slant and shear lips
Ductile slant is the desired fracture mode during drop weight tear tests. For both steels, this ductile slant was mixed with delamination even within the upper-shelf domain (Figure II-14). By decreasing the test temperature, brittle fracture modes appeared and the ductile slant fracture did no longer propagate over the entire thickness. This ductile slant propagated independently on both sides of the brittle area leading to shear lips (Figure II-14). These shear lips were also observed close to the impact area, possibly because the work hardening induced by the hammer did not enable ductile slant propagation. Ductile crack propagation is associated to a stable decrease in the load on the load-displacement curve (Figure II-15).
b) Triangular ductile crack advance
For almost all specimens, namely, for temperatures outside the lower shelf domain where full cleavage fracture occurred, a small ductile crack advance was observed at the notch root. This ductile advance with a triangular shape is presented in Figure II-16. A mid-thickness delamination was frequently initiated from this triangular ductile crack.
E ner gy (k J) S hea r are a per ce nt age ( % ) Temperature (°C) Steel A Shear area
Figure II-12: Evolution of the impact energy and shear area percentage with temperature (Steel A)
E ner gy (k J) S hea r are a per ce nt age ( % ) Temperature (°C) Steel B Shear area
26
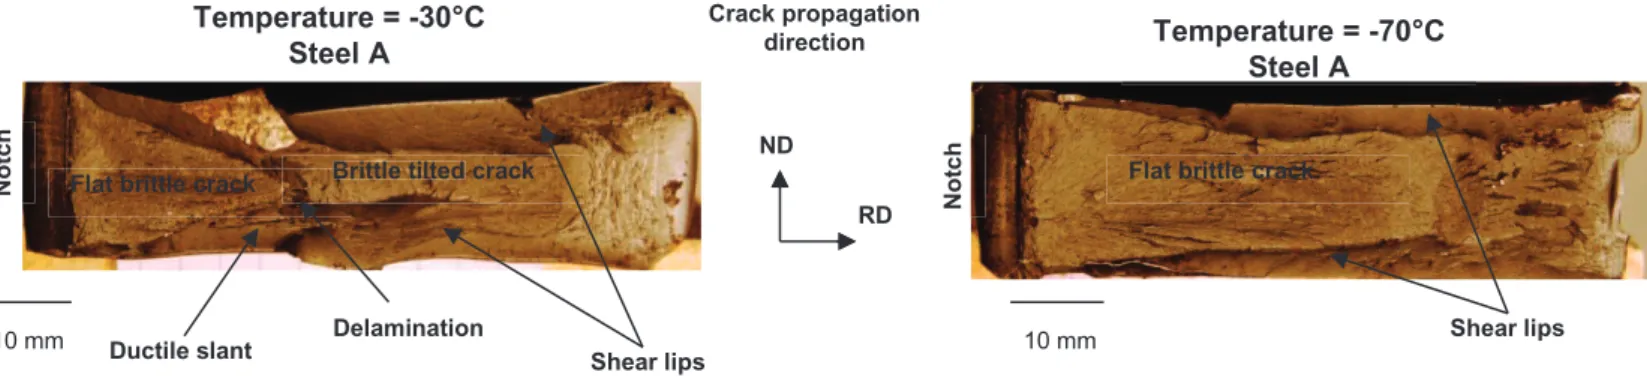
c) Flat brittle fracture
Within the ductile to brittle transition, it was rare to get specimen without triangular ductile crack advance at the notch root (this was only the case for two specimens of Steel A). In those two cases, a large flat brittle area replaced the triangular ductile crack advance (Figure II-17). According to the API 5L3 standard, all specimens in valid tests must exhibit brittle fracture at the notch root, which then turns into ductile slant. However, with the high ductility of modern pipeline steels, brittle fracture initiation at the notch is more difficult. The usage of a machined notch (chevron) or of a pre-cracked notch is the solution proposed in literature [8] but was not adopted here.
This flat brittle fracture could be followed by ductile slant, delamination and brittle tilted fracture, or could simply propagate along the entire ligament (Figure II-17). Presence of the flat brittle fracture is associated to an earlier drop of the load on the load vs. displacement curve (Figure II-18). When the brittle crack is followed by ductile slant, a stable decrease is observed on the curve (-30°C). In absence of ductile slant, the load abruptly drops to zero (-70°C and -100°C). As a consequence, the absorbed energy is lower when flat brittle crack initiates from the notch root.
ND RD Ductile slant Shear lips Delamination Ductile slant Brittle Shear lips Delamination Temperature = 0°C
Steel A Temperature = -30°C Steel A
10 mm 10 mm
Figure II-14: Observation of ductile slant and shear lips after drop weight tear tests
Load (kN)
Displacement (mm)
Ductile slant propagation
Maximal load
Figure II-15: Load displacement curve at -20°C, Steel A
ND RD
Notch
Temperature = 0°C Temperature = -30°C 1 mmNotch
Dimples 5 mm27
d) Delamination
For Steel A, delamination was observed for temperatures higher than -60°C. In fact, at -70°C and -100°C, the brittle crack initiated at the notch root propagated along the entire ligament and thus no delamination was observed. Steel B was more sensitive than Steel A to delamination. In fact, a delamination crack was still initiated from the triangular ductile crack at -80°C. Since the ductile triangular crack was initiated after prior plastic deformation, it is plausible to suspect that the plastic deformation facilitated the occurrence of delamination.
From interrupted tests reported in appendix A, delamination was generally initiated either from the ductile crack, or behind the ductile slant front. In some rare instances, it was initiated behind the flat brittle crack. Observation of the inside of delamination crack with SEM was difficult on DWTT specimens. Delamination does not seem to stop ductile slant fracture, which could propagate on both sides.
The occurrence of delamination was not associated to an abrupt drop of the load on the load vs displacement curves. Nevertheless, it might accelerate the decrease in load, since it introduces damage within the specimen. As a whole, the energy is less affected by delamination comparing to other brittle cracking modes.
e) Rotation of the delamination crack
The delamination crack was observed in some instances to rotate to join the plane perpendicular to the main loading direction. This fracture mode was sometimes observed close to the impact region of Steel A, but rarely in Steel B. The occurrence of this so-called delamination rotation was not obviously noticeable on the load vs displacement curves, perhaps because it happened rather close to the back
ND RD Crack propagation
direction
Flat brittle crack
Temperature = -70°C Steel A
Shear lips Brittle tilted crack
Br Flat brittle crack
Ductile slant Delamination Shear lips
Temperature = -30°C Steel A N ot ch N ot ch 10 mm 10 mm
Figure II-17: Specimens with flat brittle crack initiated from the notch root
Load (kN)
Displacement (mm) Flat brittle fracture initiated
at notch root (-30°C)
Triangular ductile advance at notch root (-30°C)
Steel A
Load (kN)
Displacement (mm) Without shear lips (-100°C)
With shear lips (-70°C)
Steel A
28 of the specimen. Delamination rotation brings additional brittle fracture area that is taken into account for shear area calculation.
f) Brittle tilted fracture (BTF)
Brittle tilted fracture macroscopically propagates along a plane tilted around RD by 40° with respect to the (RD, TD) plane. This plane is called “θ-plane” thereafter. Brittle tilted fracture has been observed for temperatures lower than -30°C for Steel A and -20°C for Steel B.
Within the ductile to brittle transition temperature range, the BTF crack was commonly initiated either behind the delamination crack or close to the ductile slant front (Figure II-19). Within the propagation region of BTF, entities similar to macroscopic rivers were observed. These macroscopic rivers were more pronounced far from the initiation site (Figure II-19). SEM observations of the fracture surface were performed after tilting the specimen by 40° around RD, so that the BTF surface became perpendicular to the incident electron beam. A stair-shaped fracture mode has been observed around macroscopic rivers (Figure II-19 and Figure II-20). This suggests that BTF propagates along more than one θ-plane and that these parallel cracks along θ-planes are joined by ductile slant.
Brittle tilted fracture leads to an abrupt drop of the load on the load vs displacement curve. The larger the area of BTF, the higher the drop in load. Consequently, brittle tilted fracture reduces the impact energy.
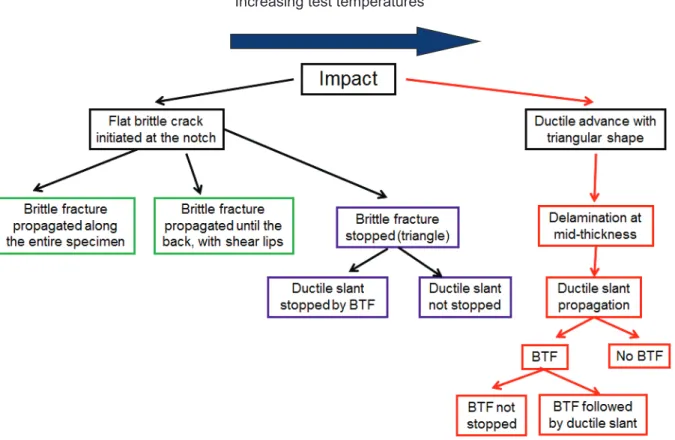
Summary of fracture modes observed in DWTT specimens and effect on load vs. displacement curves Figure II-21 shows the seven typical load vs. displacement curve shapes observed after DWTT along TD. Brittle fracture leads to a drop in load which decreases the absorbed energy. By increasing the test temperature, the following fracture modes are observed:
1: Brittle fracture initiates at the notch root and propagates along the entire ligament. Full cleavage fracture without shear lips is observed.
2: Brittle fracture initiates at the notch root and propagates along the entire ligament, with shear lips. 3: Brittle fracture initiates at the notch root turns into ductile slant. BTF follows the ductile slant. 4: Brittle fracture initiates at the notch root turns into ductile slant (entire ligament).
5: Ductile slant initiates at the notch root after some triangular ductile crack advance. This ductile slant is followed by BTF which propagates along the entire ligament.
Delamination
Slant fracture Brittle tilted fracture
Macroscopic rivers
Temperature = – 60°C
Steel B
ND RD 5 mm29 6: Ductile slant initiates at the notch root after a triangular ductile crack advance. This ductile slant is followed by BTF which turns into a final ductile slant.
7: Full ductile slant is observed.
40° TD ND 45° Cleavage along parallel θ-planes Ductile slant 40 µm 100 µm Ductile slant Clea vage a lon g θ -p lane Clea vage a lon g θ -p lane Clea vage a lon g θ -p lane Clea vage a lon g θ -p lane RD ND RD ND
Temperature = -30°C
Steel B
a)
b)
c)
Figure II-20: BTF with a stair aspect: Parallel cleavage cracks which propagate along parallel θ-planes are joined together by ductile slant (a,b) SEM images; (c) schematic view of the macroscopic crack in the (TD, ND) plane.
Load
Displacement
1 < 2 < 3 < 4 < 5 < 6 < 7 < Bri tt le fr actu re Bri tt le fr actu re Bri tt le fr actu re Bri tt le fr actu re BT F BT F BT FMaximal load
Ductile slant
Plastic deformation
E
la
sti
c de
fo
rma
tion
BT Ductile slant Ductile slantFigure II-21: Load vs displacement curves for the seven kinds of fracture surfaces observed after DWTT along TD. Labels also refer to the seven types listed in the text.
![Figure II-1: Pipe fracture appearance after a full scale burst test (temperature 5°C, pressure 15 MPa) [2]](https://thumb-eu.123doks.com/thumbv2/123doknet/2923475.76680/25.892.102.811.641.804/figure-pipe-fracture-appearance-after-scale-temperature-pressure.webp)