Development of multilayered and W03 nanoparticle
silica-based fibers for second harmonic generation
Thèse
Salah Mohammed Salah Abdullah
Doctorat en physique
Philosophiæ doctor (Ph. D.)
Development of multilayered and WO
3nanoparticle
silica-based fibers for second harmonic generation
Thèse
SALAH ABDULLAH
Sous la direction de:
Résumé
Cette thèse décrit le développement de la modélisation et de la fabrication de nouvelles fibres multicœurs concentriques de silice dopées utilisant le dépôt chimique en phase vapeur modifié (MCVD). Cette structure multicouche alternative a été développée avec plusieurs cycles de fabrication avec un nombre différent de couches (4, 8, et 16) avec différents dopants tels que le germanium (Ge) et le phosphore (P) selon le modèle proposé par l’Advanced Photonics Component Laboratory (APCL) à l’Université de Carleton sous la direction du Prof. Jacques Albert. Cette fibre multicouche cylindrique de silice dopée alternativement au germanium et au phosphore est considérée comme une conception prometteuse pour générer la deuxième harmonique (SHG). Il est proposé que les couches dopées au germanium (ou phosphore) piègent les charges positives qui migrent au cours du processus de polarisation. Le piégeage des charges positives crée des régions de déplétion dans chaque couche, ce qui élargit la région entière d’effet non linéaire à l’intérieur de la fibre à cœur unique. Ces préformes de structures multicœurs concentriques ont été caractérisées en termes de profils d’indice de réfraction (RIP), de pourcentage en poids de l’aide de la spectroscopie dispersive en longueur d’onde (WDX) et de la mesure des franges Maker afin de comprendre l’effet non linéaire de second ordre initial, principalement la SHG, dans les préformes fabriquées. Ces préformes ont été étirées en fibres tout en conservant la géométrie identique à celle obtenue à l’étape des préformes. Ces fibres formées de 16 couches concentriques polarisées sont caractérisées en termes de propriétés de propagation et non linéaires du second ordre (SON), principalement la SHG, par le couplage d’un faisceau laser pulsé dans les échantillons. Ces fibres en 16 couches se sont avérées produire une intensité de SHG et cette intensité a été améliorée du premier cycle de fabrication au troisième cycle de fabrication, où l’émission de lumière verte de SHG a été observée via une caméra standard et détectée par un tube photomultiplicateur (PMT) (1050 mV et 1600 mV) pour les premier et troisième cycles de fabrication des fibres à 16 couches. Il a été observé que les intensités de SHG pour les échantillons de préformes et les échantillons de fibres obéissent aux lois des relations quadratiques.
De plus, une autre approche prometteuse a été l’adoption de la fibre à cœur à multicomposition. Dans cette approche, des nanoparticules métalliques WO3−x, obtenues par un procédé de
polyol, ont été incorporées dans le cœur de la fibre. L’un des métaux distingués, le tungstène (W), a un potentiel énorme pour produire des effets non linéaires élevés. Les nanoparticules
WO3−x ont été incorporées avec l’aluminium via le MCVD couplé à une technique de dopage
en solution. Ces échantillons de préformes et de fibres ont démontré une intensité de SHG élevée, mesurée à l’aide d’un analyseur de spectre optique (OSA), et la relation quadratique entre la puissance injectée et l’intensité de SHG a été observée.
Abstract
This thesis deals with the process of modelling and fabrication of two novel structured doped fibers through modified chemical vapour deposition (MCVD) for second harmonic generation (SHG). The first one is constituted of multilayered core structure doped silica fiber. This alternative structure has been developed with several fabrication cycles which include dif-ferent number of layers (4, 8, and 16) with difdif-ferent dopants such as germanium (Ge) and phosphorous (P). The doped core is consisting of alternating germanium (phosphorous) layers which is a promising design for SHG. It is proposed that the germanium (or phosphorous) doped layers trap the positive charges that migrate during the poling process. The trapping of positive charges creates depletion regions in each layer which enlarge the nonlinear region within the core fiber. In a first stage, multilayered core structure preforms were character-ized in terms of refractive index profiles (RIPs), weight percent using Wavelength Dispersive Spectroscopy (WDX) and Maker fringe measurements to check their potential for non-linear conversion. These preforms were drawn into fibers while maintaining their primary geometry. The fibers are characterized in terms of propagation properties and second order nonlinear (SON) conversion through the coupling of pulsed laser beams into the poled fibers samples. Of these, 16-layers fibers have been demonstrated to produce the most intense SHG resulting in three cycles of fabrication to improve green light emission as detected by regular camera and a Photomultiplier (PMT) (1050 mV and 1600 mV). The SHG intensify for preform samples and fiber samples obeys the quadratic relationship laws.
The second approach was the adoption of multi-composition core fiber. In this approach metal nanoparticles were incorporated into fiber core. One of the unique metals, tungsten (W) has a massive potential to produce high nonlinear response. The WO3−x nanoparticles
were incorporated along with aluminum via MCVD coupled with solution doping technique. These preform samples and fiber samples have shown high SHG intensity as obtained by op-tical spectrum analyzer i.e. quadratic relationship between injected power and SHG intensity endorses is verified.
Contents
Résumé iii
Abstract v
Contents vi
List of Tables viii
List of Figures ix
List of Abbreviations xiii
Acknowledgements xiv
General Introduction 1
1 Basic concepts and literature review on nonlinear optics techniques 6
1.1 Introduction . . . 6
1.2 Introduction to fabrication of silica doped fibers . . . 6
1.3 Basics of the nonlinear optics . . . 9
1.4 Second harmonic generation (SHG) . . . 10
1.5 Silica glass as nonlinear material . . . 11
1.6 Thermal poling technique . . . 12
1.7 Maker fringe measurement . . . 14
1.8 Thermal poling and SHG in silica fibres . . . 15
1.9 Multilayered silica structure development . . . 21
1.10 Summary . . . 25
2 Experimental methods and characterization techniques 27 2.1 Introduction. . . 27
2.2 Fabrication of optical fibers with a core structure made of muliple layers of doped/undoped silica using MCVD . . . 27
2.3 Preform Characterization . . . 35
2.4 Nonlinear optics measurement for preforms . . . 44
2.5 Fabrication of 16 layers GeO2 doped silica fiber . . . 47
2.6 fiber drawing . . . 49
2.7 Basic fiber characterization . . . 51
2.8 Sixteen multilayer fiber nonlinear measurements. . . 54
3 Improvement of 16 multilayer fiber structure fabrication and
propaga-tion characteristics 65
3.1 Introduction . . . 65
3.2 Second cycle of fabrication of 16 layers Ge doped silica (High GeO2 con-centration and periodic ratio reduced to 4:1). . . 66
3.3 Background loss . . . 72
3.4 Nonlinear measurements for second cycle 16 layers fiber . . . 74
3.5 Third cycle of 16 layers GeO2 doped silica with depressed clad fabrication . 82 3.6 Nonlinear measurements for third cycle of 16 layers fiber with depressed clad 87 3.7 Summary . . . 95
4 Incorporation of nanoparticles into silica fiber for generation of the second harmonic 96 4.1 Introduction to nonlinear optics in metallic material . . . 96
4.2 Metallic Nanoparticles (MNPs) in silica fiber . . . 98
4.3 Experimental procedures . . . 100
4.4 Characterization of the preform and optical fiber . . . 105
4.5 Summary . . . 115
Conclusions and Perspectives 116
List of Tables
1.1 Summary of fibre preforms tested by thermal poling [46] . . . 17
2.1 Functions of different components used in MCVD system . . . 28
2.2 Typical trace impurities in F300 substrate tube (Heraeus Quarzglas GmbH, Germany).. . . 28
2.3 Deposition parameters for 4 layer core silica doped GeO2/undoped structure. . 30
2.4 Collapse process parameters for 4 layer preform. . . 31
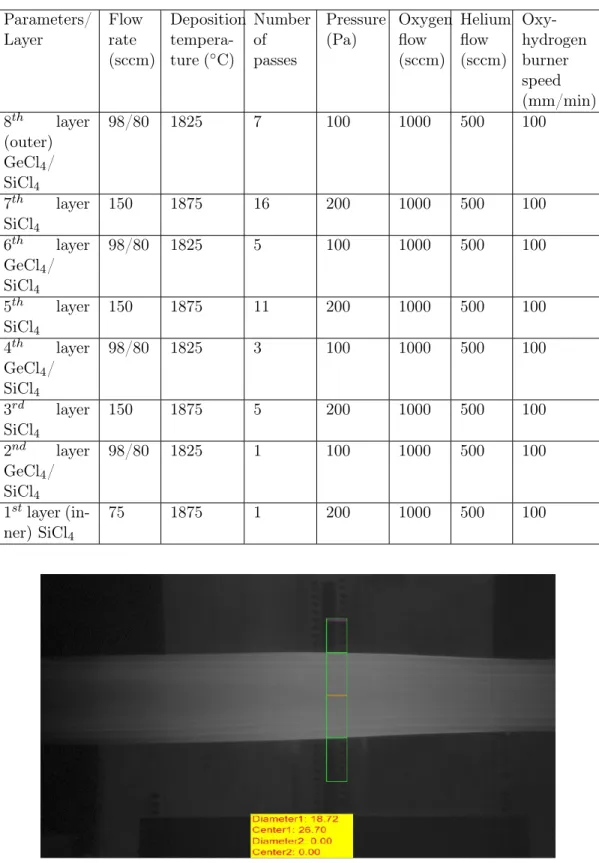
2.5 Deposition parameters of 8 layer core silica doped GeO2/undoped structure preform. . . 33
2.6 Deposition parameters for the P2O5 doped silica four-layer structure. . . 34
2.7 Deposition parameters for 4 layers core SiO2 doped GeO2/undoped structure. . 35
2.8 Collapse process parameters for multilayer preforms. . . 35
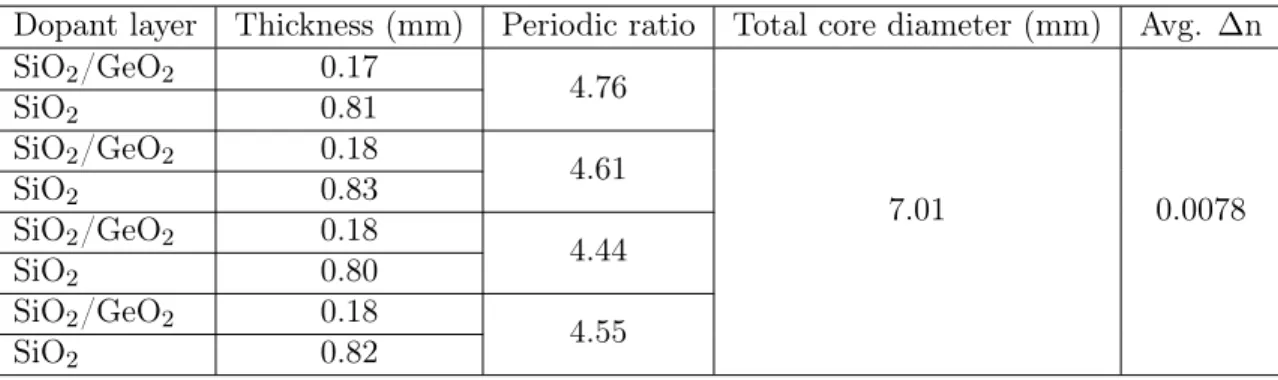
2.9 Results deduced from RIP for GeO2 doped silica preform. . . 37
2.10 Results deduced from RIP for 8 layers GeO2 doped silica preform. . . 38
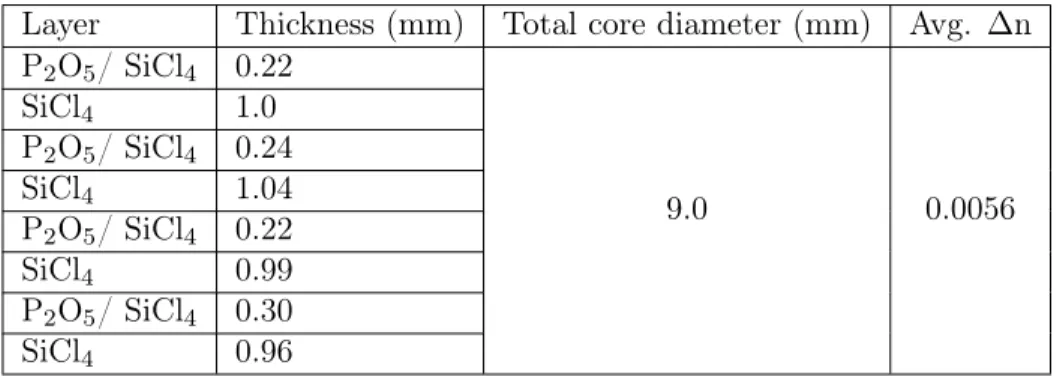
2.11 Results deduced from RIP graph for 4-layers P2O5 doped structure. . . 38
2.12 Results deduced from RIP graph for 8-layer P2O5 doped structure. . . 39
2.13 (λ/2) plate angle vs. SHG power. . . 59
3.1 Design parameters and results for the second cycle of 16 layers fibers.. . . 67
3.2 MCVD parameters for second cycle of 16 layers preform fabrication. . . 68
List of Figures
1.1 Schematic of MCVD Process for Preform Fabrication (Taken from Fibracem)
[15]. . . 8
1.2 MCVD process procedures (adapted from Heraeus Quarzglas. Hanau,Germany) [6]. . . 9
1.3 Schematic of a fiber drawing tower (adapted from Fibracem) [15]. . . 9
1.4 (a) Geometry of SHG. (b) Energy-level diagram describing SHG [17]. . . 11
1.5 Silica glass matrix before poling [27]. . . 13
1.6 Charge migration model for the poling-induced second-order nonlinearity in glasses [Adapted from 32]. . . 13
1.7 Propagation of fundamental wave and the corresponding second harmonic wave through a nonlinear medium. . . 15
1.8 SEM image of the cross section of a twin-hole for SMF fibre [31]. . . 16
1.9 SEM image of the 125 µm fiber cross section where the anode hole is the closest to the core [40]. . . 17
1.10 Twin hole and second harmonic signal in Er doped germano-silicate fibre sample poled at 4.0 kV and 280◦C for 45 minutes [47]. . . . . 19
1.11 Experimental setup for SHG measurement from poled fiber [48].. . . 19
1.12 SHG signal dependence on period of QPM [48]. . . 20
1.13 The setup to pole twin-hole silica fibers via electrostatic induction and the cross section of a twin-hole silica fiber poled via this technique [50]. . . 21
1.14 The schematic of D fiber and SHM image for nonlinear layer at core/clad interface. 22 1.15 Thin film multilayer silica structure developed by Fleming et al. [57]. . . 22
1.16 Thin film multilayer silica structure with alternating doped layers, developed by Yadav et al. [58]. . . 23
1.17 Multilayer silica structure with forty alternating doped layers, developed by Yadav et al. [8]. . . 24
1.18 Sample A and B of multilayered structures of phosphorous doped silica and undoped silica [9]. . . 24
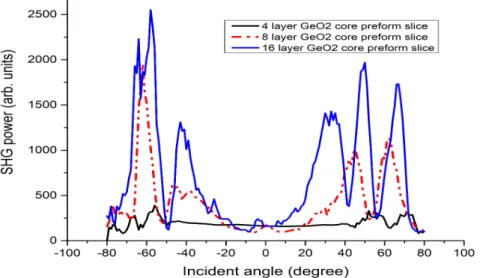
1.19 Measured SHG for prepared multilayered samples as a function of incidence angle and a bare substrate silica [9]. . . 25
2.1 Substrate tube alignment and pyrometer for temperature measurement. . . 29
2.2 Four layers structure GeO2 deposition process. . . 30
2.3 Collapse process for 4 layers preform.. . . 31
2.4 Final sealed rod (preform). . . 32
2.5 Deposition process of 8 layers structure inside the inner tube wall. . . 33
2.6 PK2600 preform analyser used for RIP scanning. . . 36
2.8 RIP for 8 layers GeO2 doped/undoped silica preform. . . 37
2.9 RIP of P2O5 4 layers doped/undoped silica preform . . . 38
2.10 RIP of P2O5 8 layers doped/undoped silica preform . . . 39
2.11 Preform samples preparation for WDX measurements. . . 40
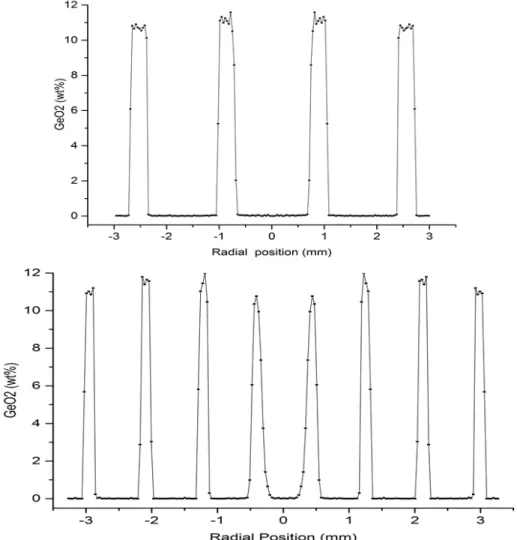
2.12 Image mapping for 4 and 8 layers GeO2 doped/undoped silica preforms. . . 41
2.13 Point ID analysis along the core for 4, and 8 layers structures for GeO2 doped/undoped silica preform.. . . 41
2.14 Mapping images for 4 and 8 layers of P2O5 4 layer’s core cross section. . . 42
2.15 WDX-Point ID measurement for 4 and 8 layers of P2O5 (wt%) doped/undoped silica. . . 43
2.16 Schematic for corona poling.. . . 44
2.17 Corona poling apparatus for preform samples. . . 45
2.18 Maker fringe apparatus to check SHG power. . . 46
2.19 Maker fringe results for multilayer preform samples. . . 46
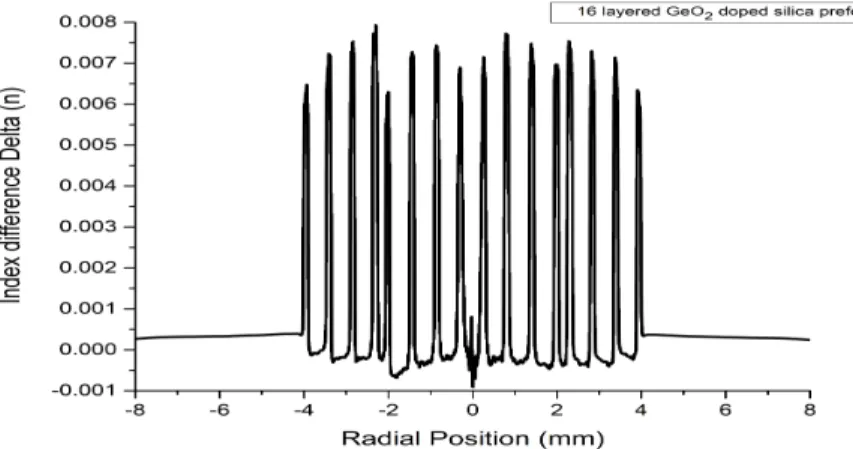
2.20 RIP for 16 multilayer structure for GeO2 doped/undoped silica preform (rod in tube technique). . . 47
2.21 Image mapping across core region of 16 layers preform sample. . . 47
2.22 WDX-Point ID measurement for 16 layers GeO2 doped silica preform. . . 48
2.23 Maker fringe pattern obtained from 16-layers preform and compared with 4 and 8 layers. . . 48
2.24 The quadratic relationship for input power and SHG power for 16 layers preform slice. . . 49
2.25 Various steps performed on each multilayer preform before drawing it into fiber. 50 2.26 Loading the multilayer preform into the drawing tower’s furnace. . . 50
2.27 SEM images of the fiber pulled from the 8 layers GeO2 doped/undoped silica preform. . . 51
2.28 SEM images of the fiber pulled from the 16 layers GeO2 doped/undoped silica preform. . . 51
2.29 Broadband setup coupling into 8 and 16 layers fibers.. . . 52
2.30 Light coupled from SMF28 at 7cm and 13 cm respectively. . . 52
2.31 Light coupled (core region) for 8 layers Ge doped silica at 7cm and 13cm. . . . 52
2.32 Light coupled (core region) for 16 layers Ge doped silica at 7cm and 13cm.. . . 53
2.33 Basic coupling setup for power transmitted measurement in both fibers. . . 53
2.34 Thermal poling apparatus.. . . 54
2.35 16 layers Ge doped silica fiber’s samples. . . 55
2.36 Experimental setup for thermal poling technique. . . 55
2.37 Modified Maker fringe setup schematic for 3 cm bare fiber samples. . . 56
2.38 Modified Maker fringe experimental setup. . . 57
2.39 Zoomed coupling schematic for bare fiber coupling. . . 57
2.40 SHG intensity of 3 cm fiber’s sample (16 layers) by PMT. . . 58
2.41 The quadratic relationship for input power and SHG power for 16 layers fiber’s sample. . . 59
2.42 SHG power for different fiber samples as captured by PMT. . . 60
2.43 SHG power from S and P polarization states for 3 cm of 16 layers fiber sample. 61 2.44 Experimental images for light propagation in the 16 layers fiber sample. . . 62
2.45 Comparison of SHG signals for different fiber’s sample drawing sample.. . . 63
2.46 SHG signal for 3 cm fiber sample drawn at 30 m/min at S and P polarization states. . . 63
3.1 Captured images for 56 passes during second cycle of MCVD deposition process. 69
3.2 RIP for second cycle of the 16 layers GeO2 doped/undoped silica preform. . . . 70
3.3 Mapping image for second cycle 16 layers of GeO2doped/undoped silica preform. 70 3.4 Line scan across the core region of the preform with 16 layers of GeO2doped/undoped silica preform.. . . 71
3.5 WDX Point ID analysis for second of the preform with 16 layers/undoped of GeO2 doped silica preform. . . 71
3.6 SEM images for second cycle 16 layers of GeO2 doped/undoped silica fiber. . . 72
3.7 Schematic of cutback measurement technique [6]. . . 73
3.8 Background loss for the second cycle 16 layers fibre (149 m and 1.4 m). . . 73
3.9 Output spectrum comparison for 16 layers fiber and SMF. . . 74
3.10 Voltage furnished by the PMT corresponding to SHG intensity for the second cycle 16 layers fibre with a repetition rate of 0.5 KHz. . . 75
3.11 Some simulation images of confined modes (LP01and LP11) spatial distribution within the second cycle of 16 layers fiber’s cores. . . 76
3.12 Experimental setup schematic used for coupling femtosecond laser beam to 6 cm fiber sample. . . 78
3.13 Spectra in the OSA for 6 cm second cycle of 16 layers fibers with LPF and for different input powers. . . 79
3.14 Spectra in the OSA for 6 cm second cycle of 16 layersed fibers without LPF and for different input power. . . 80
3.15 Spectral evolution in function of pulse variation (50–500 fs) pumped at 835 nm from Dudley et al. [65]. . . 81
3.16 Images at the output tip of the 6 cm poled fibre. . . 81
3.17 Output spectra power for the unpoled 16 layers fibre and an SMF fibre for 50, 100, and 150 mW input laser power. . . 82
3.18 RIP for first stage core structure of third cycle 16 layers preform. . . 84
3.19 WDX points ID analysis for first stage core structure of third cycle 16 layers preform. . . 85
3.20 RIP and geometry image for final third cycle 16 layers preform with long de-pressed clad. . . 86
3.21 SEM images for third cycle 16 layers fiber with depressed clad. . . 86
3.22 Background loss for third cycle 16 layers fiber with depressed clad. . . 87
3.23 SHG intensity for third cycle of 16 layers depressed clad fiber. . . 88
3.24 Femtosecond pump laser spectrum only as detected by OSA. . . 89
3.25 Spectrum detected by OSA for 1 cm of third cycle 16 layers fiber. . . 90
3.26 SC generation spectrum of 6 cm unpoled 16 layers fiber with depressed clad.. . 91
3.27 Resulted spectrum of 6 cm unpoled SMF. . . 91
3.28 SC generation spectrum of poled 6 cm of 16 layers core with depressed clad. . . 92
3.29 Enhanced experimental setup for SHG acquisition from 6 cm poled third cycle 16 layers fiber. . . 93
3.30 Entire confined power at the core region of 16 layers fiber (third cycle) as seen by the camera. . . 94
3.31 Original images obtained for SHG intensity as a function of coupled input power 50, 80, 110 and 150 mW. The arrow indicates the power increase. . . 95
3.32 Processed images using ImageJ for SHG intensity as a function of coupled input power of Fig. 4.30 (50, 80, 110 and 150 mW). The arrow indicates the power increase. . . 95
4.1 TEM images of WO3−x yellow annealed under air at magnifications of a) 20
nm b)100 nm [124].. . . 101
4.2 Silica soot porous layers used for solution doping. . . 102
4.3 Schematic of experimental solution doping process. . . 103
4.4 Different steps to produce nanoparticles doped silica fiber [129]. . . 103
4.5 Experimental setup for preform sample SHG measurement. . . 104
4.6 Experimental setup for fiber SHG spectrum measurement. . . 105
4.7 RIP for Al2O3-WO3NPs doped silica preform. . . 106
4.8 SHG spectrum obtained from BBO reference. . . 106
4.9 SHG deconvoluted spectrum obtained from Al2O3-WO3NPs doped silica preform. 107 4.10 Evolution of the output intensity versus input intensity for preform sample. . . 107
4.11 Mode profile power and field diameter for Al2O3-WO3NPs fiber. . . 108
4.12 Unfiltered output light obtained from Al2O3-WO3NPs doped silica fiber. . . 109
4.13 Green light emission (SHG) obtained from Al2O3-WO3NPs doped silica fiber. . 109
4.14 Longitudinal green light emission (SHG) obtained from Al2O3-WO3NPs doped silica fiber. . . 110
4.15 Green light images (SHG) with input power of 100 mW at different distances. . 111
4.16 SHG spectrum intensity for Al2O3-WO3NPs doped silica fiber. . . 111
List of Abbreviations
MCVD Modified chemical vapour deposition OVD Outside vapour deposition
VAD Vapour axial deposition
NBO Non-bridging oxygen
SEM Scanning electron microscopy
WDX Wavelength dispersive X-ray spectrometry RIP Refractive index profile
Δn Refractive index difference SON Second order nonlinearity SHG Second harmonic generation THG Third harmonic generation SFG Sum frequency generation
SC Supercontinuum generation
SPM Self phase modulation
XPM Cross phase modulation SRS Stimulated Raman scattering
PMT Photomultiplier tube
OSA Optical spectrum analyser
HPF High pass filter
LPF Low pass filter
BPF Band pass filter
MFD Mode field diameter
Acknowledgements
This dissertation would not have been possible without many people who contributed to it in their own particular way and for that I want to thank them. First and foremost, I would like to thank my supervisor Prof. Younes Messaddeq for believing in me, for giving me a wonderful opportunity to be his PhD student and for being an excellent advisor. His magical word " we can do it! " has always been a moral support and has made every part of this journey easier. His outstanding guidance, advice, and support during this work encouraged me and allowed me to achieve significant scientific results.
A great praise without boundaries to the super-hero Prof. Virgilio Anjos, who really guides me during lab experiments and stands with me during difficult moments where no results could be obtained. I still remember his promises “Don’t worry Salah, I will stay here in COPL until we get the magical green light from your multilayered fiber”. He joined me during weekends in the lab. He called over nights to give me guidance and enhancements for further experiments. Thank you from the deep of my heart for your unlimited assistance, and I would not be where I am today without him.
I am eternally indebted in my co-supervisors Prof. Christopher Smelser and Prof. Jacque Al-berts who enlightened and motivated me with their immense knowledge, enthusiasm, and wise advice. They provided a dynamic and excellent research environment with the most modern equipment and generous research support. Finally, I would like to thank my both supervisors for the financial support I received through their projects and for allowing me to participate in international conferences, trainings, and high-level meetings.
Nicolas (Sifu) Gregoire deserves a very special word of gratitude. I always feel lucky to work with him and learn from his MCVD skills. I still remember his first sentence “Dealing with MCVD is similar with taking care of girls, in order to obtain good results”. He has always taken the time to discuss and enrich my knowledge, helped me with all my fabrication ex-perimental works and simple ways to improve my complicated design. I would like to thank Steeve Morency (Lord of the towers), for his assistance, sharing knowledge and effort towards my fibers.
Vincent Fortin and Jerome Lapointe deserve a very special word of gratitude. I always feel lucky to have had a chance to work with them and learn from them. They have always taken the time to discuss and enrich my work, in term of simulation and experimental work.
I would also like to acknowledge the contributions of the technicians to the success of this project, especially Stéphan Gagnon, Patrick Larochelle and Marc d’Auteuil who were always available and answered with a great patience to all my technical needs.
I also mention my gratitude to Prof.Michel Piche for pre-reading my thesis and for his mean-ingful comments.
I would like to thank Younes group members, Sandra, Yannick, Ali, Mourad, Michelle, Alexan-dre, Wagner, Mazen and Ismail ben Amar for their kind motivation and support.
I am very grateful to Prof.Jacque Albert group especially to Seyed Hamed Jafari for his im-mense help with my experiment’s setup at Algonquin college. And I must also mention that I thoroughly enjoyed working with my teammate Tahseen Haque and Fu Liu.
I would like to thank Ozan, a great friend and COPL mate, who generously gave his time to offer me valuable comments toward improving my experimental setups and made excellent discussion to my research work. Many members of Bernier and Vallée research groups con-tributed to my research project and helped me along the way.
I would like to thank especially Jean-Philippe, Frédéric Maes, and Jean-Christophe Gauthier, for insightful discussions and comments. I am grateful to all of the Centre d’optique pho-tonique et laser (COPL) members I had the pleasure to work with during my PhD project. I would like to thank Nezih belhaj my colleague at Coractive for guiding me in MDF simulation. The list of people who contributed to my happiness outside the professional context is quite exhaustive, but I would like to thank especially Abdulaziz (big brother), Nasr, Afan, uncles( Musleh, Ahmed, Khaled,Ahmed, Abdullah, Fahdi), Essams, Ayad, Fadle, Ahmed Almasri and Almokhtar for support and standing with me during difficult times.
A special mention here for my uncle Salah Mutair, the wise, caring, kind and awesome man peace be upon him and Allah bless him.
A very special thanks to my family for their endless love and support. The words cannot express how grateful I am to my mother, father and brother who encouraged me all the time and this work would not have been possible without them. In addition, thanks to my aunt and uncle who have always supported me with their love.
MAM, DAD, Aziz, Uncle Salah, Afan
General Introduction
Introduction
Silica glass plays a vital role for commercial applications in the field of photonics. Its appli-cations range from chip fabrication to optical communication systems that span continents. Besides its low cost and wide availability, its exceptional physicochemical properties proved to be remarkably advantageous. For example, it is immune to electromagnetic interference and supports high transmittance for various wavelengths, including infrared radiation. This property is suitable for long distance communications and it also has very high optical damage threshold, making it excellent for applications with high-power lasers. It exhibits low thermal expansion and can be formed into many desired shapes, sizes or thicknesses with a broad range of fabrication processes, thus making its production and implementation relatively easy. Sil-ica’s amorphous structure results in it not being birefringent [1]. Silica is also centrosymmetric. This means that the material structure has a center through which it displays inversion sym-metry. Consequently, silica does not possess an even order nonlinearity. This property limits silica from exhibiting the second-order nonlinear optical process, one of which is the second harmonic generation (SHG). Currently, the SHG process has several key applications in ar-eas such as laser frequency conversion (frequency doubling), nonlinear spectroscopy, quantum cryptography [2], surface study and characterization of second order nonlinear optical (NLO) properties of materials [3]. Ongoing research explores appropriate modifications, perhaps even replacements of the nonlinear materials in conventional optical systems. The 1970s and ’80s has witnessed substantial research on nonlinear effects in glass-based optical fibers. In 1986, Margulis et al. reported efficient SHG coming from a germanium doped glass fiber [4]. This discovery triggered a spark of interest within the field of Photonics, because of the prospects of eliminating most losses and integration difficulties by building active nonlinear devices with only one material, silica.
Thesis Motivation
Since the discovery of second harmonic generation (SHG) in silica optical fibres and poled bulk silica, the second order nonlinearity in silica glass has gathered considerable interest.
Silica is one of the most abundant materials on the earth; while nonlinear optical crystals such as LiNbO3 include rare materials where the crystal growth costs much [4]. LiNbO3 crystals
are prone to the effect of optical damage. Optical damage is a semi-permanent alteration in the refractive index due to the intense light passing through the sample. The affected region gives rise to beam distortion. Industrial applications introduce dopants such as Magnesium and Zinc to improve the optical damage threshold of these crystals [5]. Another significant disadvantage arises from the lack of compatibility with the existing silica-based infrastructure. LiNbO3 and other crystalline materials cannot be made into fibers. There are also significant
differences in the optical and thermal properties when compared to silica. Therefore, manu-facturers need to implement complicated designs, to adapt and minimize losses in the systems during integration. These issues add to the cost of today’s high-speed optical networks. Be-sides that, using conventional nonlinear materials such as nonlinear crystals in optical fibre systems can suffer from many drawbacks which include high transmission loss, high package cost, low optical damage threshold and difficult integrability with the incumbent fibre systems [6]. In addition, using nonlinear optical crystals as frequency converter containing both fibres and bulk optical component leads to necessity of adjustment of the optical component and to additional losses on them [6]. Alternative and efficient approach is using optical fibres as a nonlinear medium of frequency conversion in fibre optics system avoid many disadvantages associated with nonlinear optical crystals. Compared to nonlinear optical crystals, optical fibres offer inherently lower insertion loss, high optical damage threshold, greater stability and lower manufacturing cost. It is well known that silica is used as a preferred substrate in optical fibre waveguide and lasers. However, silica is a centrosymmetric material and therefore does not possess a second order susceptibility which prevents it to be used as frequency doubler, a nonlinear optical process in which photons interacting with a nonlinear material are effectively combined to form new photons with twice the energy, and therefore half of wavelength [6]. The second order nonlinearity in silica can be induced by applying an electric field in the silica sample under an elevated temperature, this process is called thermal poling (Myers et al. 1991) [7]. Recent studies conducted at the Advanced Photonics Component Laboratory (APCL) at Carleton University under the direction of Prof. Albert led to the development of multilayer thin film structure on micro and nano-layer structures. This multilayer structure was formed by alternating dopant on poled silica glasses which has shown to be a very inter-esting approach [8,9]. In fact, alternating a series of Ge-doped silica and undoped silica layer produced 200 times higher SHG intensity compared to bulk silica samples. This approach makes this new process to produce higher SHG competitive with lithium niobiate already known in the literature. The question that arises is whether this technology can be carried out to develop more reliable compact fiber laser sources and other optical components. The answer to these questions leads to the exploration of new strategies and new designs of fibers based on the well-known silica-based materials. In this project, special multilayer doped silica core structure fibres are designed and fabricated using Modified Chemical Vapor Deposition
(MCVD) to specifically take advantages of the unique nonlinear properties observed at inter-faces. This multilayer germanium (or phosphorous) doped core in silica-based fibre is adopted as a promising design for second harmonic generation (SHG). It is proposed that the germa-nium (or phosphorus) doped layer traps the positive charges that migrate during the poling process. The trapping of positive charges creates depletion regions in each layer which may enlarge the total area of nonlinear effect within the core region. Although each interface has a small nonlinear coefficient (typically 1 pm/V), larger cumulative thickness of nonlinearity will have a greater overlap with the fundamental wave. This attribute in effect would allow for enhanced effective second order nonlinearity (SON). This approach contrasts with other methods (e.g. various poling techniques), which aim to only increase the nonlinear coefficient of the induced SON in silica glass. To reiterate, the purpose of this design of multilayer core structure fiber is to raise the magnitude of the effective nonlinearity by inducing a sufficient large nonlinear area upon poling. The silica-dopants interfaces will help to control the prop-erties of the nonlinear region (e.g. width and distribution). An extended nonlinear region will allow sufficient overlap between the nonlinearity and optical field propagating through the core region, resulting in efficient nonlinear interaction. Success in this methodology will result in fibers that can be the base materials for all sorts of non-linear optical applications, such as second harmonic generation (SHG), electro-optical modulation and switching. From another point of view, metal materials such as gold and silver have been known as an efficient source for nonlinear effects. One of the metals, which has a massive potential to produce high nonlinearity response is tungsten (W). Nonetheless, tungsten nanoparticles have never been incorporated into optical fibers for nonlinear applications. In this work, we report the devel-opment of optical fibers containing tungsten trioxide (WO3) nanoparticles using the modified
chemical vapor deposition (MCVD) and solution doping technique. We are the first to report WO3 nanoparticles incorporation into the core of silica fiber and explore this fiber for SHG.
Thesis Objectives
The long-term objective of this project is to achieve a silica-based second harmonic generator for fibre lasers. Ideally, the second harmonic generator would come in the form of an optical fibre itself as this would ensure maximum compatibility with existing fibre lasers. Based on the previous studies that reported on multilayer thin films [8,9], we will explore a novel design of the fibre multilayer structure (design, manufacture, and testing). The specific objectives of the thesis can presented as follow:
1. A first multilayer structure silica doped fibers with 4, 8, and 16 layer using different dopants as germanium and phosphorus will be explored. Several theoretical modelling studies will be conducted to select the appropriate geometry to be implemented. 2. The fabricated preforms will be characterized in terms of refractive index profile (RIP),
weight percent using wavelength dispersive spectroscopy (WDX) to ensure the quality of the geometry initially proposed.
3. Measurement of the second order nonlinear effect (mainly SHG) in the fabricated pre-form. This stage is very important to ensure the quality of the produced prepre-form. 4. Drawing these preforms which proves the existence of second order nonlinearity (SON)
into a single mode fiber which has the identical proposed geometry.
5. Optical characterization of the drawn multilayer fibers in terms of propagation properties and nonlinear optics (mainly SHG) through the coupling of pulsed laser beam into the poled layer fiber sample. Optical losses will be also performed using cut-back method. 6. A new approach will be also explored based on the incorporation of nanoparticles of
heavy oxide materials based on WO3 that were prepared in our laboratory. These
synthesized nanoparticles will be introduced into the core of the preform during the MCVD process. The produced preform will be drawn into a single mode fiber as well. Then, the optical characterization including the SHG will be evaluated.
Thesis Organization
This thesis is divided into six chapters. The first chapter gives a concise overview of the research related to this study as well as the motivations and objectives of the study. In Chapter 2, information regarding the fabrication of optical fiber using MCVD, nonlinear optics basics, SHG concept and Maker fringe technique will be presented. We will present also a detailed literature review on the progress made by other research groups on inducing second-order nonlinearity in silica doped fibers, previous fiber designs, and SHG characterization. Particular emphasis is given to reports of poled glass structures with interfaces, which motivated the original idea for our work on multilayer structures. An experimental demonstration of the second-order nonlinearity existence using multilayer core fiber structure is the topic of the following two chapters. Chapter 3 explains in detail the experimental set-up, design, and procedures used to fabricate and characterise the first cycle production of multilayer core-doped silica preforms and fiber. The method to characterize SHG and preliminary results will be presented as well. Chapter 4 presents the procedures for improvement of this multilayer fiber design through simulation, modelling, and fabrication method. The obtained results from fiber measurements will be analysed comprehensively. Chapter 5 will present a detailed explanation on the process and production of doped nanoparticles core optical fiber to produce a highly
non-linear optical fiber. This approach will be presented for the first time in the literature. Finally, Chapter 6 will outline the conclusions of this research and recommendations for future work.
Chapter 1
Basic concepts and literature review
on nonlinear optics techniques
1.1
Introduction
In this chapter, we will introduce the basic concepts underlying the fundamentals of fabrication process of optical fibers based on silica materials. It is very important to introduce MCVD as one of the most technologies used for optical production as it will be the technique that we will use at COPL for the production of optical fiber in this thesis. Then, we will introduce the concepts of nonlinear optics and second harmonic generation in Section 1.3 and in 1.4, respectively. As a nonlinear material, we will be focused on silica glass and the different process explored by several researchers with special attention to thermal poling technique (section 1.5). The Maker fringe technique (MFT) widely used to establish the effective second-order nonlinear optical coefficient (def f) and the thickness (L) of nonlinear materials will
be explained in section 1.7. Afterward, extensive elaboration of thermal poling and second harmonic generation for silica fibres is given in Section 1.8 and it will be followed by another detailed discussion about multilayered silica structure development in Section 1.9.
1.2
Introduction to fabrication of silica doped fibers
The silica glass is a highly transparent material with low loss and is thus used for optical fibres and components. Interest in optical communication has flourished with the invention of the laser, and somewhat later, with the development of optical fibres. The invention of the laser in 1960 marked the beginning of photonics [10], a modern form of optics–a branch of science in which photons act as the agents in the generation, transmission, interaction and detection of the optical signals [10]. Only about a decade after the invention of the laser an efficient
low-loss transmission medium, the optical fiber, was introduced paving the way for a truly long-distance communication technology [11].
In optical fiber fabrication, three techniques are mainly used in the production line; outside vapour deposition (OVD) [12], vertical axial deposition (VAD) [13] and modified chemical vapour deposition (MCVD) [11]. However, MCVD is the most commonly used technique in research due to its flexibility since it can be adapted to any change in the fabrication process, its lower cost, and its superior fiber quality such as low OH¯ content [11]. MCVD was first invented by Bell Labs in 1974 [14] and since then its development has tremendously expanded. An MCVD system typically consists of a glass working lathe, a bubbler gas delivery system and a scrubber for neutralising gaseous by-products. The glass working lathe (Figure 1.1) is comprised of two rotating clamps to hold the silica glass substrate tube used in the fabrication process. An oxy-hydrogen burner is fixed on the lathe and traverses along the length of the substrate tube. The temperature of the oxy-hydrogen burner is controlled by adjusting the flow of hydrogen and oxygen using mass flow controllers. In addition, a pyrometer and a substrate tube diameter monitor move synchronously with the burner to measure the surface temperature and the diameter of the substrate tube, respectively. At one end of the substrate tube, a rotary seal is attached to allow the passage of gases into the tube and at the other end, an exhaust tube is used to remove the hazardous gases and particles produced during the fabrication process. As shown in Figure 1.1, the soot precursors are located remotely in glass bubblers kept at a temperature high enough to produce constant vapour flow during the fabrication process. Each bubbler has a separate input line for a carrier gas (oxygen) that is passed through the liquid precursor to produce vapours of the precursor material. A mass flow controller is used to control the rate of oxygen flowing to the bubbler and hence the rate of the produced vapour. The vapour is then delivered to the substrate tube where it meets an additional oxygen flow and the deposition process takes place [11, 14].
Figure 1.1: Schematic of MCVD Process for Preform Fabrication (Taken from Fibracem) [15]. The MCVD process can be divided into three stages [14]. The first stage is the substrate tube preparation and includes mounting the substrate tube on the lathe, fusing the substrate tube with the exhaust tube, and etching the substrate tube.
The second stage is mainly concerned with the deposition of silica soot layer. For example, a typical fabrication process of standard single mode (SM) or multi-mode (MM) fibers consists of cladding and core depositions. Silica or silica with other dopants such as the oxides of germanium (Ge) and phosphorus (P) are deposited during this stage. The deposition is com-prised of two sequential steps. The first step is the formation of submicrometer particles (i.e. soot) by the oxidation of raw materials (e.g., SiCl4 and GeCl4). Depending on the process
parameters such as precursor and carrier gas flow rates, and reaction temperature, these parti-cles can grow in size up to few micrometres. The oxide products are generated by homogenous gas phase reactions and the nucleation of a solid oxide phase occurs homogenously [11, 14]. The second step is the transportation of the formed particles to the substrate tube interior wall due to thermophoretic effect [14].
The third stage consists of sintering, substrate tube collapsing and core sealing to obtain a solid rod called preform. The sintering process is carried out to convert the deposited soot into an optically transparent glassy layer. Oxygen and/or helium are used in this process to enhance the process and to minimise bubble formation that can degrade the quality of the preform. Once the glass is sintered, the temperature is increased to collapse the substrate tube and obtain an optical fiber preform. The deposition, sintering, and collapsing processes are illustrated in Figure 1.2.
Figure 1.2: MCVD process procedures (adapted from Heraeus Quarzglas. Hanau,Germany) [6].
Once the preform is ready, a drawing tower (Figure 1.3) is used to pull the preform into an optical fiber. Typically, the preform fabricated by MCVD is heated to elevated temperatures (> 2000◦C) using a graphite furnace and is carefully “drawn down” to the accepted standard
diameter of 125 microns with typical core diameters in the range of 6-10 microns [15]. The fiber drawing process must be carefully controlled to prevent negative impacts to the fiber’s mechanical and optical properties. The drawn fiber is then coated with a protective polymer layer and its final diameter is 250 microns. If a state-of-the-art drawing process is used, the fiber should essentially have the same refractive index profile as the preform from which it was drawn.
Figure 1.3: Schematic of a fiber drawing tower (adapted from Fibracem) [15].
1.3
Basics of the nonlinear optics
Generally, optics describe the interaction of light with matter. Light interaction with different mediums has linear response and therefore a variety of optical phenomena were described based on the linear refractive index. The invention of laser which emerged in 1960’s enabled optical power to be increased to high levels where the response of mediums commenced to deviate the linear behaviour. At this high-level intensity of light, the material response depends on
the light intensity. This marked the birth of a new field called nonlinear optics. This led to the discovery of second harmonic generation (SHG), sum frequency generation and the Kerr effect [16].
To understand what is meant by optical non-linearity, we consider the dependence of the polarization P(t) of a medium on an electric field E(t). In the presence of an applied electric field E(t), the positive and negative charges are displaced in opposite directions. This distorts (or polarizes) the material, and thus the electric field induces a dipole moment within the medium. This distortion effect is usually characterized by the polarization P (t), which is defined as the dipole moment per unit volume [16, 17]. In the case of linear optics, the induced polarization P(t) in the medium depends linearly on the amplitude of the electric field according to the following equation [17].
Pl(t) = ε0χ(1)E (t) (1.1)
where χ(1) is the well-known linear susceptibility and ε
0 is the permittivity of free space. For
nonlinear optics, the response of the material is often described as a Taylor expansion of the material polarization P (t) in powers of the electric field E (t).
P (t) = ε0χ(1)E (t) + ε0χ(2)E2(t) + ε0χ(3)E3(t) (1.2)
As observed from Eq. (1.2), the overall nonlinear polarization consists of linear and nonlinear polarization. The major nonlinear contributions are second order susceptibility (χ(2)) and/or
third order susceptibility (χ(3)). These nonlinear processes due to (χ(2)) effects are
electro-optic effect, second harmonic generation (SHG), sum and difference frequency generation (SFG/DFG), and optical parametric amplification or oscillation (OPA/OPO). On the other hand, the (χ(3)) effects include the optical Kerr effect, third harmonic generation (THG),
self phase modulation (SPM), cross phase modulation (XPS), four wave mixing (FWM) and stimulated Raman scattering (SRS). The equations of propagation of the optical waves in a non-linear medium are derived from Maxwell’s equations [16]. An important case of second order nonlinearity effect is SHG, essentially frequency doubling (or half the wavelength) of a monochromatic wave.
1.4
Second harmonic generation (SHG)
SHG refers to a nonlinear optical process in which photons interacting with a nonlinear mate-rial are combined effectively to form new photons having twice the frequency (halving wave-length) of initial photons [17].
During this process, two photons of lower frequency are annihilated, and a photon of higher frequency is created. The polarization for SON is defined by
Figure 1.4: (a) Geometry of SHG. (b) Energy-level diagram describing SHG [17].
Let us consider a laser beam whose electric field is represented as E(t) = 1
2 [ E0e
i(kz−ωt)+ c.c] = E
0cos (kz − ωt) (1.4)
If we substitute equation (2.4) in (2.3), the nonlinear polarization created in a medium with χ(2)6= 0 is P (t) = ε0χ(1)E0cos (kz − ωt) + 1 2ε0χ (2)E2 0(t) + 1 2ε0χ (2)E2 0(t) cos(2kz − 2ωt) (1.5) Then, P (t) = P(ω)+ P(0)+ P(2ω) (1.6)
The principles of SHG can be basically described as the following. Consider an electric field E(t) with frequency (ω) launched into a medium that has nonlinear polarization. In this case, the dipole inside the medium vibrates with different frequencies and this vibration of the dipole is represented by P (t). A direct inspection of (1.6) and (1.5) shows there are three types of polarization P(ω), P(0), and P(2ω). The first term has a polarization with frequency
(ω) which represents induced charge centers vibrating synchronously with the fundamental one. The second term has a zero frequency and it doesn’t vibrate continuously, that is called optical rectification. The third term has a frequency 2(ω), which indicates an induced dipole therefore, its corresponding polarization, vibrates with frequency 2(ω) which is the second harmonic frequency [17,18]. The most common use of SHG is to convert the output of a fixed-frequency laser to a different spectral region. For instance, the Nd:YAG laser operates in the near infrared at a wavelength of 1064 nm. SHG is routinely used to convert the wavelength of the radiation to 532 nm, in the middle of the visible spectrum [17].
1.5
Silica glass as nonlinear material
Basically, SHG is a second-order nonlinear process that couples the input fields to the generated radiation through the second-order nonlinear susceptibility χ(2). Any material that is invariant
under inversion (centrosymmetric) has χ(2) = 0 and therefore cannot exhibit second-order
nonlinear processes in the electric dipole approximation [19]. As silica glass has an amorphous structure, it is a centrosymmetric material. Therefore, the material does not possess any
even-order nonlinear properties. Its lowest nonlinear coefficient arises from the third order susceptibility tensor (χ(3)). Despite that, Margulis et al. reported SHG in silica-based optical
fibers, which meant a non-zero χ(2) in this silica glass. In the experiment, they coupled a
high-intensity pulsed beam into a Ge-doped silica-based optical fiber and observed frequency doubling after several hours of constant illumination. The magnitude of the output steadily increased with time. After about 12 hours, the nonlinear process finally saturated. The average second harmonic power was measured to be 0.7 mW, with a peak power as high as 1.6 mW. This experimental procedure is now called optical poling or photoinduced SHG process. The phenomenon is understood to be a consequence of poling of the fiber to break its symmetry [19].
1.6
Thermal poling technique
Researchers developed new ways of poling, to increase the amount of induced second order nonlinearity (SON) in silica glass such CO2 laser assisted poling [20], UV poling [21], UV-fs
poling [22], electron-beam poling [23] and proton implantation poling [24]. A major draw-back of these methods is that poling-induced second order nonlinearity is thermodynamically unstable and tends to decay over time. A significant breakthrough to break the silica symme-try occurred in 1999 by Myers et al. [25]. In this work, the silica symmesymme-try was broken by applying a strong electric DC field to the material at high temperature for certain period of time. The electric field induces a static polarization, which breaks the symmetry and allows SHG processes. The applied external field can be permanently recorded in a so-called thermal poling process. The procedure consists of heating the sample to an optimum poling temper-ature (250-3000 C) and simultaneously applying a strong electric field between 3-5 KV/cm
for a sufficiently long time (5- 30 minutes). This is followed by allowing the sample to cool down to room temperature before the poling voltage is removed. It has been suggested that a high electrostatic field Edc appearing in a thin depletion region near the anodic surface,
is in fact responsible for the observed phenomenon. Despite the vanishing χ(2) in glass, the
coupling between the electro-static field Edc and the intrinsic third-order nonlinearity of the
glass resulted in observation of an effective second order nonlinearity (SON) [25,26].
The mechanism that leads to the establishment of the SON in the glass is not yet fully understood. The origin of the electro-static field Edc, responsible for χ(2) has been subject
of debate since 1990s by different research groups. However, two underlying mechanisms for induce SON in silica glass were proposed. Principally, both mechanisms originated from the molcular structure of glass layer as shown in Fig. 1.5 [27]. The glass lattice consists of silicon ions that are the network formers and oxygen ions of two types. Due to the four valence electrons the silicon forms tetrahedral bonds. When two tetrahedron share one oxygen ion between them, the oxygen is called bridging oxygen. On the other hand, when an oxygen ion bonds to only one silicon ion, it is referred to as a non-bridging oxygen (NBO). The
non-bridging oxygen ions have a net negative charge of (-1). The modifier ions, also called impurities, are alkali or alkaline earth metal ions such as Na+, Li+ and K+1. These ions have
a net positive charge of (1+).
Figure 1.5: Silica glass matrix before poling [27].
Fundamentally, a second order nonlinear effect in silica glass is said to occur due to an electric field-induced ion migration [27]. The first mechanism which was called frozen electric field proposed that the high temperature involved in the poling process increases the mobility of the impurities present in the glass, mainly alkali ions such as Na+. Therefore, upon the application
of an electric field, the positively charged sodium ions drift towards the cathode where they are neutralized by injected electrons [27, 28]. Under the hypothesis of zero ionic conductivity at the anode (blocking electrode), during the migration the ions leave a negatively charged depleted region behind themselves. The depleted region is located a few microns (2-14 µm) beneath the anodic surface [26, 29,30]. Due to the lack of mobile charges, the depleted region has a much larger resistivity than the rest of the glass. Like in a voltage divider, the applied voltage tends to mainly drop across the more resistive depleted region. Consequently, a large static electric field is established between the depleted layer and the anode and ultimately contributes in inducing SON in silica glass [31,32]. This process overview is schematically represented in Figure 1.6.
Figure 1.6: Charge migration model for the poling-induced second-order nonlinearity in glasses [Adapted from 32].
In brief, the high temperature increases the mobility of the NBO dipoles, whereas the applied electric field forces them all to orient in the same direction. After cooling, the dipoles would be frozen in one direction, thus breaking the symmetry of the glass and accounting for the observed SON. Nearly the entire applied electric field drops across this depletion region, which ultimately contributes in inducing SON.
On the other hand, other researches [32,33] assumed that the static field is responsible for the ionization of the glass in the anodic region, leading to the creation of a positive charge layer that screens the external field and stops the process. When the sample is cooled down the ions are trapped in their positions. A high static electric field, between the positive layer and the negatively charged region, is then frozen in the glass once again breaking the centrosymmetric structure [34].
Regardless of the poling conditions, when the sample is cooled down to room temperature, the ions are frozen in place, creating a strong frozen electric field. This electric field couples with the third-order nonlinearity of glass, to produce an effective second-order susceptibility (χ(2)). This frozen electric field mechanism is expressed as χ(2)
ef f= 3 χ (3)E
f rozen.
Regarding the second mechanism that described the induced nonlinearity, the elevated tem-perature and high electric field are said to cause hyperpolarizable entities (such as a bond, dipole, defect or nano-crystal) to be oriented in the direction of the applied field [28, 30, 34]. When the sample cools down to room temperature, the dipoles remain frozen in their new orientation, thus breaking the symmetry of the glass and inducing SON.
As a conclusion, thermal poling is the most reliable technique to induce SON susceptibilities of the order of χ(2)
ef f=1 pm/V in amorphous silicate glasses compared to other poling techniques
such as CO2 laser-assisted poling and ultraviolet (UV) poling [28-34].
1.7
Maker fringe measurement
Since its first proposal in 1962, the Maker’s fringe technique (MFT) has been widely used to establish the effective second-order nonlinear optical coefficient (def f) and, when necessary,
the thickness (L) of nonlinear materials, especially thin films [35,36]. This method is based on analysis of variation of SHG magnitude by incidence angle of the fundamental beam and crystal thickness. This technique is experimentally straightforward: a fundamental beam with frequency (ω) is focused onto the sample, and the acquistion of second-harmonic generation (SHG) power is recorded while the nonlinear thickness is varied, e.g., by rotation of the sample. From spacing and position of the SH peaks one can infer L, whereas def f can be estimated by
comparison with a reference sample of known nonlinearity (i. e. lithium niobate (LiNbO3)).
However, acceptable resolution for L is possible only when L ≥ Lc, where Lcis the so called
(proportional to the square of the fundamental field) become out of phase by π. Over that interval, the generated SH waves along the path may constructively interfere with each other producing constructive pattern. In the next interval, the SH waves destructively interfere, in which case the power flows back to the fundamental wave. Lccan be expressed as a function
of fundamental wavelength and the refractive indices of the two waves as follows [17]: Lc=
λω
4 | η2ω− ηω | (1.7)
where λω is the wavelength of the fundamental field, η2ω is the refractive index of the SH
wave, and ηω is the refractive index of the sample. Figure 1.7 shows a simplified ray diagram
depicting a setup for Maker fringe measurements.
Figure 1.7: Propagation of fundamental wave and the corresponding second harmonic wave through a nonlinear medium.
The laser beam goes through a sample as it rotates about the y-axis. The rotation of the sample causes variation of the optical path, which is essentially the length over which the fundamental wave interacts with the material. The angle dependent nonlinear path length is L/Cos θ2ω , where L is the width of the sample as shown in Figure 1.7. In this research project, θω ≈ θ2ω is assumed for the purpose of simplification. This assumption is justified because
the samples under investigation are based on silica. Silica glass exhibits high transmittance and very low dispersion. When the path length is greater than the coherence length of the material, the intensity of the SHG varies. Thus, the Maker fringe patterns produce fringes or periodic oscillations in the measured SH power [35,36].
1.8
Thermal poling and SHG in silica fibres
Optical fiber geometry is different from bulk silica glass and other waveguiding wafers. In optical fibres, the radiation is trapped in the core because of the refractive index difference between the core and the cladding that is realized either by adding dopants to the core that increase the refractive index such as GeO2and P2O5, or by adding dopants to the cladding that
decrease the refractive index such as boron and fluorine [37]. This imposed many challenges in thermal poling experiments for fibers compared to bulk silica glass. For bulk silica glass, electrodes can be easily attached to the two flat surfaces of the glass whereas in optical fibers the electrodes are embedded in holes that run along the fiber on each side of the core [38,39]. For optical fibers with a twin-hole structure, two holes are parallel to the core along the fiber length. Each core can accommodate an electrode, to which high external voltage can be applied [40]. As twin-hole fibres can be easily spliced to single mode fibres, they only add small coupling losses (< 3 dB) to the fibre systems.
Figure 1.8: SEM image of the cross section of a twin-hole for SMF fibre [31].
Inserting electrodes into the holes of the twin-hole fibre is the first step to proceed with poling process. In the literature, two methods have been reported for inserting electrodes. First method is by pumping conductive molten alloys into the twin holes as reported in [39, 40, 41]. The second method where metal wires were inserted manually into the holes [42], and used by Wong et al. [43], and Fleming [44]. The “molten alloys” method was first demonstrated by a research group at the Royal Institute of Technology in Sweden [39]. In this method, a pressure cell is used to pump the molten Au-Sn alloy at 280◦C into the holes of a twin-hole
fibre. Once the fibre is cooled down to room temperature, the molten alloy becomes solid and remains inside the fibre as conductive electrode. The electrodes in the fiber are then bonded to external electrodes through polished side-openings on the fiber, so that an external poling voltage can be applied. Using this method, electrodes over one meter long have been successfully produced inside twin-hole fibres [40, 41]. Margulis et al. [41, 45] successfully poled one meter-long twin-hole fibres with Au-Sn alloy electrodes for all-fibre electro-optical switch applications.
The second method is more straightforward. Fibres are usually fixed under a microscope and metal wires are threaded directly through the side-openings on the fibre into the holes by hand. Typically, the length of the electrodes that can be manually inserted into the fibre is limited to several centimetres. In both methods, the fibres with electrodes inside are spliced to standard single mode fibre (SMF) for future applications [33, 34, 35]. In the work reported in [40, 41, 45], germanium (Ge) doped silica was used, to give a refractive index difference ∆n = 0.025 and corresponding numerical aperture is 0.27. Figure 1.9 illustrates the fiber geometry
and twin hole specifications. The diameter of the core is 3.6 µm and it is single mode at 1550 nm. The edge-to-edge distance between the core and the nearest hole was 4.6 µm and farthest hole was 10.1 µm. The two holes were 29.5 µm in diameter and have a separation (d) is 18.3 µm and final fiber poled length was 20 cm.
Figure 1.9: SEM image of the 125 µm fiber cross section where the anode hole is the closest to the core [40].
Moreover, Wong et al., [43] is the one that has revealed for the first time the existence, in a poled fiber, of the frozen-in electric field Edc using a Mach–Zehnder interferometer. The
technique adopted allowed them to measure both the magnitude and the direction of the frozen-in field. They also measured the third-order non-linearity χ(3) of unpoled and poled
fibers, concluding that the χ(3) has increased by a factor of 2 after the thermal poling process.
In addition, a work of Blazkiewicz et al., published in 2001 [42], shows the effects on the dynamics of the poling process of the inclusion of a deposited doped silicate glass ring or of a borosilicate glass ring inside the anode hole of a poled twin-hole fiber. In particular, they observed that in the case of a doped silicate glass ring there is a rapid saturation of the electro-optic coefficient, while the borosilicate glass ring instead acts as a trap layer that retards the evolution of the growth of the electro-optic coefficient. This work demonstrates that by tailoring the structure of the optical fiber to be poled it is possible to modify significantly the characteristics of the poling process and consequently the properties of the poled fiber. On the other hand, kazansky et al., [46] investigated different glass compositions for the core and clad. They tried to identify the best core and cladding compositions that would produce the higher SON. The types of core and clad composition are illustrated in Table 1.1.
Table 1.1: Summary of fibre preforms tested by thermal poling [46] Preform type Glass tube name Inner cladding Core
A (MCVD) GE-100 P + F doped silica 3.5 mol% GeO2 B (MCVD) Herasil 1 P + F doped silica 18 mol% GeO2+Na
C (MCVD) Herasil 1 - 3.9 mol% GeO2
D (MCVD) Herasil 1 - 4.5mol% GeO2+Na
From each preform a slice of approximately 1 mm thick was taken and thermally poled at 2.5kV applied voltage and 280◦C for 15 min inside an oven. Stainless-steel and Si electrodes
were used. No SH signal was observed in the P+F-doped cladding region. Compared to other compositions in preform B and D, ∼15% stronger SH signal was observed in the Ge doped core (Preform C). Surprisingly, GeO2+Na doping preform (preform D) didn’t produce any
significant effect on the SH signal. The observation of a higher SH power was in the Ge-doped cores which was attributed to the Ge defect sites, which can be relatively more easily ionized by the high electrostatic field in the H+ depletion region near the anode, creating a frozen-in
electric field. The obtained value of effective χ(2) was 0.2 pm/V for preform C. This value may
be increased by improvement of the overlap integral between the nonlinear layer and the fibre modal field. This work [46] showed the possibility of getting SON in Ge doped silica fiber. Apparently, the next step is to realize QPM in the Ge doped silica fibers.
Fleming and Honglin [47], fabricated a fibre containing only 3 mol% Ge doped silica in the core with an Erbium (Er) doped germanium-silicate ring around the anode hole. The Er doped germanosilicate ring was fabricated by first depositing approximately 3.0 mm of germanosili-cate layer (≈3 mol.% in Ge) onto the inner side of the anode hole, followed by solution doping Er in the germanosilicate layer with an Er concentration of about 1500 ppm. The fibre core structure was ∼ 2.2 × 4.0 µm in size (elongated in the hole-to-hole direction) and was ∼ 6.6 µm edge-to-edge from the anode hole (the hole on the right) as shown in Fig. 1.10. The diameters of the overall fibre and the holes were 280 and 100 µm, respectively. The hole-to-hole spacing was 23 µm and an aluminum wire of diameter 50 µm was inserted into the hole-to-holes. The second order nonlinearity (SON) spatial distribution was visualised with second-harmonic microscopy (SHM). It was found that the SON layer was trapped in the Er doped ring under normal poling conditions. Only at higher poling voltages and for much longer poling time could some SON be formed at the core-cladding interface, while most of the SON layer was still firmly confined within the Er doped ring.
Figure 1.10: Twin hole and second harmonic signal in Er doped germano-silicate fibre sample poled at 4.0 kV and 280◦C for 45 minutes [47].
Furthermore, several researchers have proposed various designs for twin hole size, type of wires and their diameters, and distance between holes and core. For instance, Mizunami et al. [48] used Ge-doped fibre (3.8 mol %) with 9.3 µm and 126 µm core and clad diameters respectively. The length of the fiber to poled was 8 cm with twin holes of 35µm in diameter separated by 18 µm. Stainless-steel wires of 20 µm in diameter were inserted and poling was performed with a voltage up to 3 kV using an electric furnace up to 400◦C. To measure SHG from the
poled fiber, they used the following experimental setup.
Figure 1.11: Experimental setup for SHG measurement from poled fiber [48].
This poled fiber was additionally processed through quasi-phase-matching (QPM) for an op-timum effective period of 41.1 µm and the SHG signal was measured before QPM and after QPM as shown in Fig. 1.12. The SHG signal increased by a factor of 15 after implementation of QPM. When this period differed by ±0.1 µm, the increment was not obtained.
QPM is an experimental procedure which allows a net flow of energy from the pump frequency to the signal and idler frequencies of the nonlinear medium through the creation of a periodic structure in the medium. The net flow is obtained as the system momentum is conserved which is known as phase-matching. Normally this condition is never reached without an additional momentum contribution corresponding to a wavevector of the periodic structure. QPM ensures the positive energy flow even though all the frequencies involved are not phase locked with each other under normal circumstances. Empirically this wavevector is created by introducing a periodicity in the real space with consequent reflex in the reciprocal space (wavevector space). For example, in a nonlinear crystal with a c-axis (ex: c-axis of a ferroelectric material) the
crystal is periodically poled in which the positive c axis alternates in orientation within a certain period called coherence length [17].
Figure 1.12: SHG signal dependence on period of QPM [48].
Concerning the nature of dopant in QPM, Corbari et al. [49] fabricated two types of fibers. The first fiber (S1) is an aluminum (Al) doped fiber with numerical aperture (NA) of 0.14. The second fiber (S2) is a Ge doped silica fiber with NA of 0.11. Both fibers have a core diameter of 6 mum. The two holes were 45 µm in diameter and 30 mum apart. The separation between the edge of the core and the side of the hole is 3 µm in the Al-doped fiber and 5 mum in the Ge doped. The S1 doped fiber was poled at temperature of 230◦C, voltage of 7 kV, and for 30
minutes. The S2 fiber was poled at temperature of 215◦C, voltage of 9 kV, and for 30 minutes.
Both poled fibers have a length of 20 cm. QPM was implemented for these fibers and the QPM parameters were described in [49]. They concluded the Ge doped fiber is more efficient than the Al fiber in terms of second order nonlinearity where he obtained χ(2)of 0.1pm/V for
Ge doped fiber and 0.06 pm/V for Al doped fiber. This is in agreement with Kazansky et al. in [46] demonstrated that Ge doped fiber is better than other dopants such as P.
Litvinova et al. [50] fabricated several Ge-doped silica fibres with different concentrations varying between 4, 7 and 13 mol%. The fibres have a core diameter of 4 µm and total diameter of 125 µm. The Fibers were designed with two air holes of 50 µm, gold-coated tungsten wires of 25 µm diameter were inserted inside the holes for thermal poling. In this process, the germanosilicate fibres were heated to 220◦C while applying external electric field of
8 kV across the fibres. The external electric field was removed after 20 min and the fibres were cooled down to room temperature. They demonstrated that higher Ge doped concentration fiber with higher applied voltage will contribute to higher SHG intensity.
In 2014, a new technique was reported for poling fibers instead of cathode- anode or cathode less configuration. At that time, De Lucia et al. introduced a new technique of thermal poling of silica fibers, called “electrostatic induction” [51,52]. The setup used for induction poling process was illustrated in the left side of Figure 1.13. Two samples of a twin-hole fused silica fiber, both equipped with solid electrodes embedded in both the cladding channels, were utilized. One of them (≈5 cm of length) was used as electrostatic inductor, while the other one (≈40 cm of length) was the actual fiber to be poled. The two fibers were positioned
adjacently only along the 2.5 cm of the short side of the slide, while the rest of the longer fiber (the one to be poled) was fixed on top of the Petri dish surface with some Kapton tape to ease its thermalization. The rear surface of the microscope slide was coated with gold and represents the ground plane of the system. The electrodes embedded in the inductor were both connected to the anodic potential, while the two electrodes embedded in the cladding channels of the fiber to be poled by induction were left floating. The depletion regions in the right side of Figure 1.13 were visualized by means of a process of decorative etching in HF acid for 1 min. The depletion region was created all along the whole length of the floating electrodes embedded into the “induced” fiber.
Figure 1.13: The setup to pole twin-hole silica fibers via electrostatic induction and the cross section of a twin-hole silica fiber poled via this technique [50].
Additionally, De Lucia et al. [53] adopted the usage of liquid electrodes (i. e. mercury, HCL solution and tap water) in thermal poling instead of non-metallic internal electrodes which were potentially beneficial to create nonlinear quadratic all-fiber devices exploiting different types of waveguides. It also offers a significant advance toward the implementation of a generalized method for the thermal poling of any complex fiber geometry and length. Similarly, they also used standard Ge doped fiber with (core diameter = 4 µm, clad diameter =125 µm, NA =0.17, electrodes holes diameter = 30 µm) in this approach.
1.9
Multilayered silica structure development
Fleming et al. reported in 2016, a hindering effect of the migration of the nonlinearity layer at the core-cladding interface [54]. The structure was a D-fiber with a Ge doped core as shown in Fig.1.14.
![Table 1.1: Summary of fibre preforms tested by thermal poling [46] Preform type Glass tube name Inner cladding Core](https://thumb-eu.123doks.com/thumbv2/123doknet/3051652.86089/33.918.173.747.933.1058/table-summary-preforms-tested-thermal-poling-preform-cladding.webp)