Robust EGNOS Availability Performances under
Severe Ionospheric Conditions
S. Trilles, T. Authié, C. Renazé, O. Raoul, Thales Alenia Space, Toulouse, France
1. BIOGRAPHIES
Sébastien Trilles holds a PhD in Mathematics (topology and real algebraic geometry) from the Paul Sabatier University and a post-master graduation in space engineering at the École Nationale Supérieure d’Aéronautique (ISAE-SUPAERO), France. He is a specialist in Navigation System Performances, working at Thales Alenia Space on the EGNOS Project.
Thierry Authié graduated from the Institut National des Sciences Appliquées (INSA), France. He has been working in space flight dynamics and precise orbit determination. He currently works as navigation algorithms engineer at Thales Alenia Space on the EGNOS project.
Céline Renazé holds a master in computer science from Paul Sabatier University, France. She worked as a software architect on scientific software. She currently works as software architect and developer at Thales Alenia Space on the EGNOS project.
Olivier Raoul holds a PhD in Electronics from university of western Brittany. He has an experience on projects involving a broad spectrum of scientific fields. He currently works at Thales Alenia Space as a software engineer specialised in the development of scientific software.
2. ABSTRACT
The estimation of ionosphere delay and associated covariance is the key contributor to reach APV1 and LPV200 availability performance level for EGNOS above the ECAC area.
To qualify the future EGNOS system release, ESA has defined a new synthetic data scenario representative of severe ionospheric conditions. In order to be consistent with the real ionosphere behavior, ESA has also defined a new criterion to characterize the dynamics of the gradients, the Along Arc TEC Rate (AATR), that represents the rms over one hour of the particular derivative of the TEC along a path.
Typically the value of AATR that is present into the new synthetic scenario is around 2.5 mm per second for L1 at low latitude.
To be able to follow such a gradient dynamics Thales Alenia Space France has developed a new Ionospheric Grid Computation module (IGC) to compute the EGNOS ionosphere corrections, in the scope of R&D activities. The IGC module is integrated into SPEED platform, the SBAS Operational Test-bed that fully represents EGNOS Performances in terms of accuracy, continuity, availability and integrity for Safety Of Life services. The outputs of this module is the set of GIVD, the vertical delay, and GIVE, the confidence interval of GIVD at 3.29 sigma, for each Ionospheric Grid Point (IGP).
The analyses of the performances of this new ionospheric module have shown a real significant improvement of the APV1 availability performances map (more than 100% of availability performance improvements).
These first results show that the compliance to APV1 and LPV200 availability performances can be reached with this solution under severe ionospheric condition.
3. INTRODUCTION
The Earth ionosphere is a highly variable and complex physical system generated by the interaction of the high atmosphere layer with the solar ionizing radiation and controlled by chemical interactions and transport by diffusion and neutral wind. This layer disturbs the propagation of GNSS signals [1], [2] that degrade the accuracy of the distance measurements performed by GNSS receivers, and thus causes errors in the computed user position. Besides the refraction effects, the ionosphere changes the propagation of GNSS signals. Indeed the carrier wave and its modulation (codes) travel at different effective velocities. The code propagation effective velocity decreases and becomes slightly lower than the speed of light, resulting in a delay in distance measurement. The ionosphere delay depends essentially on the signal frequency and on the density of free electrons in the ionosphere. To address this degradation, the SBASs broadcast ionosphere correction parameters and integrity data to the aviation user, to improve the position computation.
The SBAS Minimum Operational Performance Standard document (MOPS, [3]) specifies the way the augmentation data should be transmitted to the aviation users. This document specifies that the ionosphere shall be considered as a thin layer, located at 350 km altitude in the WGS reference frame. Consequently all ionosphere effects are assumed to be concentrated on a single point, the Ionospheric Pierce Point (IPP) defined as the intersection between the thin layer and the line of sight that connects the aviation user to the GNSS satellite. The MOPS also specifies a discretization of the ionosphere layer by a regular square grid (5 degree per 5 degree except around the pole areas) which vertices are called Ionosphere Grid Point (IGP). The MOPS Message Type 26 of [3] contains the Grid Ionospheric Vertical Delay (GIVD) and the Grid Ionospheric Vertical Error (GIVE, a 1.10-7 confidence interval on the ionosphere residual error) on each IGP defined and identified by the Message Type 18 of [3]. Finally the MOPS defines a mapping function, that converts the vertical ionosphere delay into a slant one, and an interpolation method that allows aviation users to compute the ionosphere delay along the line of sight at the IPP from the surrounding IGPs.
In the SBAS context, the ionosphere correction message (MT26) is the one that has the most impact on the system performance, mainly user availability, for single frequency services.
To compute these corrections, the EGNOS solution is based on the technique developed by Mannucci [4] and known as the TRIN (TRiangular INterpolation) model. This approach consists first of assuming that all ionosphere effects are concentrated in a thin layer, and second of approximating this thin layer by a polyhedron which facets are triangles (triangular grid). The process is largely described in [5], [6], [7].
Since the ionosphere modeling is the main contributor to the single frequency SBAS availability and since the recent past has shown that the ionosphere may be severely disturbed during solar activity cycle peaks, Thales Alenia Space considered that this subject deserves a special effort. In addition to all the activities carried out for EGNOS around ionosphere algorithm improvements, Thales Alenia Space has launched a separate independent and self-funded R&D activity to study alternative solutions. This paper presents the assessment of this alternative solution, the Ionosphere Grid Computation module (IGC), and evaluates it on several service area. The paper presents first a discussion on the ionosphere characterization above the ECAC FIRs (European Civil Aviation Conference Flight Information Regions), second a set of performance indicators reached with the IGC module under different scenarios showing the severe ionosphere conditions.
4. PROBLEM CHARACTERIZATION
The characteristic ionosphere variation scale above ECAC area depends on ionospheric conditions (geomagnetic storms or calm periods). Typically the Ionosphere spatial scales are rather on the order of 200 km to 900 km, in particular with transient ionospheric events such as the Travelling Ionospheric Disturbance (TID). TIDs are irregularities in the electron density of the ionosphere that spread like a wave [8]. These ionosphere wave trains can have an amplitude of some of TEC units (1 TECU represent a delay of about 16 cm for the GPS L1 signal). Besides transient events such as TIDs, the ionosphere presents a global dynamics that implies, for the area of interest (i.e. in the middle latitudes in Europe) spatial gradients on the order of 10-30 TECU over 1000 km of distance. Thus, changes in gradients of less than 1000 km distance are common features of the ionosphere.
At times, the F-region of the ionosphere, that contains the highest concentration of free electrons, may be disturbed, and small-scale plasma irregularities develop with rapid change in the refractive index for radio signals [9]. When sufficiently intense, these irregularities scatter radio waves and generate rapid fluctuations (or scintillation) in the amplitude and/or phase of radio signals. The effect of scintillation on the carrier phase can generate cycle slips and potentially a loss of lock.
Two different kinds of scintillation occur above the ECAC area. First, the polar scintillation is characterized by rapid carrier-phase changes as measured by the receiver phase lock loops (PLL). It can produce cycle slips and sometimes challenge the receiver ability to hold lock on a signal at any moment of the day. This scintillation is linked to the interaction of the Earth magnetic field with the solar wind and the interplanetary magnetic field. It is regularly observed on the EGNOS sites of Jan Mayen Island or Svalbard. Second equatorial scintillation is characterized by amplitude fading that occurs during nighttime. It can be so severe that signal levels drop below typical GPS receiver lock threshold (generally for a C/N0 around 30 dBHz in C/A code), requiring the receiver to attempt reacquisition of the satellite signal. Such a characteristic is particularly well observed on the EGNOS site of Nouakchott in Mauritania. Plasma bubbles are at the origin of the scintillation at these low latitudes.
5. THE THALES IONOSPHERIC GRID COMPUTATION MODULE
The estimation of GIVDs is performed with a set of geometry free observables ( − ), and being the code observables on the GPS frequencies L1 and L2,
between station j and satellite i, that contain multipath (MP) and all dispersive delays as instrumental bias (IB) and the slant ionosphere delay scaled for the L1 frequency:
− − − 1
In these notations, is the noise measurement difference and all other not-modelled components, / is the square frequency ratio.
As mentioned previously the raw observables ( − ) can be affected not only by multipath but also by scintillation. The characteristic figure to measure the scintillation amplitude on carrier-code measurement is defined as the ratio of the standard deviation of the signal intensity and the average signal intensity as:
−
with , being the signal amplitude, and <> represents the averaged value over the interval of interest. Loss of lock is also characterised by a weak signal to noise ratio C/N0, which is computed from the signal
amplitude as C/N0 = 10log10(I). In major case the L2
frequency is the first signal lost in case of signal weak, due first to a higher sensitivity of lower frequencies to ionosphere effects, second a C/N0 globally lower than for
L1 (mostly at low elevation) and also the semi-codeless technique acquisition.
The characteristic figure σϕ to measure the scintillation phase on carrier phase measurement is the standard deviation of the phase signal :
−
where is the carrier-phase of the signal, the average is usually over a period of 60 seconds.
To cope with the issues of perturbation on the signals, Thales has designed a new filter to pre-process the raw geometry free observables ( − ), which formulation is able to, first keep the lock in case of code amplitude fading and phase jitter; and second to be insensitive to non-null average multipath.
The following figures show the behaviour of the Thales filter versus the current one implemented in EGNOS on two stations located in the north (Jan Mayen Island, N70.9° E8.7°), and in the south (Nouakchott, N18.08° W15.95°), both undergoing scintillation effects.
The Jan Mayen receiver behavior is driven by polar scintillation. The main consequence on the signal is a loss of L2 phase measurements and sometimes the loss of L2 code measurements. Figure 1 shows a typical signature of polar scintillation. On 06/17/2012, the signal to noise ratio dropped suddenly by about 15dBHz at two moments, at
around 4pm and the other at 5pm with a very noisy behavior. With such very low values of signal to noise ratio the receiver can lose the L2 phase and/or code signal. When the loss occurs, no C/N0 values are provided
by the receiver.
Figure 1: Jan Mayen signal to noise ratio on 06/17/2012 Figure 2 shows the σϕ profile on both frequencies carrier-phase signal. The carrier-phase scintillation is notable and coincides with the fall of C/N0 on L2. Both frequencies
are affected during this period however the effect on L1 is more important than the one observed on L2. This is a characteristic of polar scintillation producing massive occurrences of phase loss of lock. Such events can severely perturb filters based on both code and phase measurements as it is shown in Figure 3.
Figure 2: Jan Mayen σϕ profile on 06/17/2012
Figure 3 shows the loss of lock of the current filter, that is set arbitrarily to zero (green values), while the smoothing provided by the Thales filter remains valid. Once the EGNOS filter retrieves the lock, both filters provide comparable values. It is notable around 4pm, and proves that the Thales formulation is consistent.
Figure 3: Jan Mayen measurements on 06/17/2012
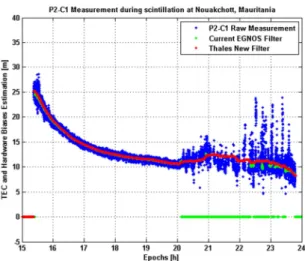
The Nouakchott RIMS behavior is practically located in the most severe scintillation area (around 15° of geographic latitude) and is mainly characterized by a fading on signal amplitude. It is particularly visible on 03/12/2014, at 8pm with a sudden increase of S4 index
(Figure 4) meaning a high ionosphere scintillation event.
Figure 4: Nouakchott S4 index on 03/12/2014
As shown in Figure 5, from 8pm to the remainder of the day the Thales filter continues to calculate smoothed measurements while the EGNOS filter does not. The set of filtered values seems a little more noisy in scintillation period but is coherent with the EGNOS output when it is locked. Note that the TEC evolution is not the usual expected one at the end of the pass: the profile decreases slightly whilst the slant TEC amount is assumed to increase as the satellite is setting.
This new formulation allows to greatly improve the availability of smoothed measurement at RIMS locations affected by scintillation in both polar and equatorial area.
Figure 5: Nouakchott measurements on 03/12/2014
As a consequence, more measurements, not biased, will be available for the IGC module. An expected consequence is a decrease of GIVD error and an improvement of the availability performance.
The IGC module is thus fed by the smoothed geometry free observables ( − ), provided by the new filter, and instrumental bias at stations and satellites level. The core of IGC algorithm is based on an adaptation of TRIN model, with respect to the one currently implemented in EGNOS. The choice of this design is based on a previous work, performed by Thales Alenia Space [6], where a comparison has been done between very different methods applied over the ECAC area. In this paper, no interpolation method was perceived as the best one over the complete ECAC service area. In particular there is no specific and local geographic pattern where one method (among TRIN, Kriging and Adaptative Normalised Convolution) will provide better results in terms of accuracy. While this design is justified at middle latitude the purpose here is to assess the robustness and performances in case of severe ionosphere area. The IGC module contains an augmented resolution so as to adapt the tessellation to the observed spatial gradients. Moreover, as each node of the mesh has a constant solar hour, the temporal gradients are mitigated. Consequently the new implementation aims at reducing the GIVD error. In a second part, the computation of the GIVE is based, as current EGNOS algorithm, on a quadratic sum of covariance built with new approaches. Both precision and integrity are checked with classic tools used for the qualification of EGNOS.
The IGC module is fully integrated into the SPEED (System Platform for EGNOS Evolutions & Demonstrations) platform that is the SBAS Operational Test-bed that fully represents the EGNOS Performances in terms of accuracy, continuity, availability and integrity for Safety Of Life services.
The SPEED platform has been designed to ease the development and tuning of SBAS algorithms thanks to a
hosting structure that enables easy integration of new algorithm functions through a standardized interface. The temporal series of GIVDs and GIVEs on each IGP are injected into the Navigation Overlay Frame (NOF) to provide a MOPS consistent time series of MT26. The NOF is then processed by qualified tools to compute the availability map and integrity performance figures (Safety Index, Availability of each IGP, statistics,…). These analyses have been performed on different scenarios with different networks and different areas, as explained in the next section.
6. RESULTS AND DISCUSSION
This section is focused on the results provided by the IGC module on both synthetic and real data sets, each of them showing severe ionospheric conditions. The results are compared to EGNOS. In a first time, two different areas are considered with synthetic data (IONA scenario) covered by two different RIMS network. In a second time, real data have been processed on the ASECNA (Agency for the Safety on Air Navigation in Africa) thanks to real data based on SAGAIE stations network, and on Brazil thanks to the IBGE and INPE networks. The synthetic scenario “IONA” is the new synthetic data scenario used for EGNOS qualification. At low latitude, the vertical TEC value experiences important variations in time, increasing smoothly up to about 20m (for L1 frequency) at midday, and afterwards decreasing irregularly down to 2m at night. The irregularities account for physical events such as TIDs, gradients instabilities, local variations of TEC, etc ... At mid latitude, the behaviour of the TEC is rather a smooth daily periodical variation with about 10m of amplitude. At high latitude, the TEC variation presents a double peak pattern, the first at midnight around 8m and the second at 10pm around 6m. The spatial gradient of the vertical TEC (VTEC) is oriented SW-NE with a global amplitude of about 22m over the zone and presents notable instabilities between 15 deg-30 deg latitude North during the first part of the night. Finally the temporal gradients of the VTEC can reach 3cm/s over 30s every day.
The performances have been evaluated based on the NOF produced by SPEED. To evaluate the IGC performances we replace the solution produced by the module inside the NOF already obtained with a preliminary run performed with EGNOS algorithms. More precisely the IGC module is fed with raw pre-processed measurements and the temporal series of GIVDs and GIVEs are captured as an output of processing. Next, these temporal series have been injected in the NOF using script shell and analysed. Figure 6 shows the availability map for APV1 performance level (99%) for the current operational EGNOS compared to IGC, for IONA scenario above ECAC area. Blue color indicates the common coverage reached by both algorithms, green color indicates
coverage improvement reached by the IGC and orange indicates the regression.
Figure 6: Global 99% availability (APV1) – ECAC area – Comparison IGC vs EGNOS operational
The IGC solution provides a major increase of APV1 service coverage of about 100% with respect to current algorithms. The gain is notable on the South where all ECAC land masses are now covered. A slight regression is noted at the East due to the refined TRIN mesh. Indeed the surface of the new triangles contain less IGP than the original ones. The integrity of IGC solution is preserved with a safety index max at 2.6, knowing that integrity is guaranteed below 5.33.
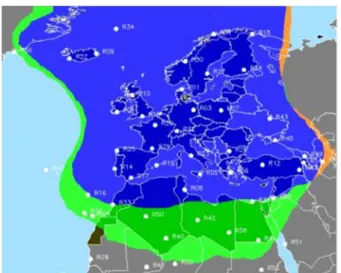
The following map (Figure 7) shows the availability map for the APV1 performance level (80%) for EGNOS as compared to the IGC reached for the “IONA” scenario above ECAC and ENP (European Neighboring Policies) area. The ENP states gather the North of Africa and Eastern countries of Europe. The main difference between the previous synthetic IONA scenario is first the number of RIMS (more numerous than ECAC only) and second the measurement noise that is twice smaller (improved RIMS assumption).
Figure 7: Global 80% availability (APV1) – ECAC + ENP area –Typical improvement reach by ICG vs EGNOS
The IGC module provides again a major increase in APV1 availability, with a service area particularly extended in the South, allowing to cover almost completely the ENP countries. The same little regression is observed in the East.
The next map (Figure 8) shows the compared results between the IGC module and the current EGNOS algorithms on a context with equatorial real measurement data. It involves data from the SAGAIE station network, along with measurements from the southernmost stations from the EGNOS network, on the day 07/23/2015.
Figure 8: Global 99% availability (APV1) – ASECNA area – Comparison operational EGNOS vs IGC
The availability area shown in this figure has been computed over the whole day. It deserves to be highlighted that such a station network is not yet optimized to reach the desired availability while ensuring the required level of integrity (especially with high gradients, scintillation, etc …). Indeed the reachable performance is linked to the observability of the ionosphere that the system can have.
The IGC module computed a solution that vastly expanded the availability compared to the EGNOS solution. An analysis of the availability values over the region shows that it has a minimum around the Mali but increases near the two western stations. If more stations had filled the gap between the SAGAIE stations and the two western ones, it would have been possible to have an availability area spreading until the western border of Africa. The monitoring level of the IGP were also much higher in the IGC solution: over the 104 IGP selected in the mask for this scenario, the IGC solution allows to monitor 51 IGP in average whereas only 34 IGP for EGNOS. The integrity level has also been improved, with a maximum Safety Index of 2.35 in EGNOS, versus 1.5 in IGC.
The two following figures (Figure 9 and Figure 10) show the compared results between the IGC module and the EGNOS algorithms, produced on a context with 29 Brazilian stations, on two days, April the 20th and 21st 2015. The second day is known as having a geomagnetic storm, thus giving a highly perturbed ionosphere.
The results on the first day are shown below:
Figure 9: Global 99% availability (APV1) – Brazil area, day 04/20/2015– Comparison operational EGNOS vs IGC
The figure shows a significant improvement of the APV1 availability for the IGC module. The coverage area extends to most of the country.
The integrity level is better for the IGC solution, with a maximum safety index of 4.3, versus 4.5 for the EGNOS solution.
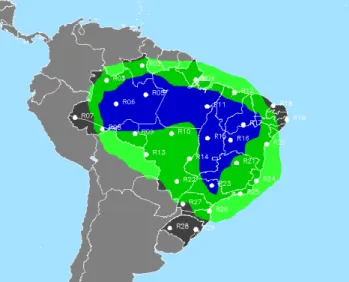
Figure 10 shows the results on the second day, the one with a geomagnetic storm.
Figure 10: Global 99% availability (APV1) on Brazil, day 04/21/2015 – Comparison operational EGNOS vs IGC
For the EGNOS solution, the APV1 availability surface is reduced compared to the previous day with a smoother ionosphere, but the IGC module provides a solution with
a much greater availability, in all directions. In this case of a perturbed ionosphere, the availability area remains almost as large as the one on the previous day.
Both solutions monitor all the IGP above Brazil 100% of the time, but the integrity is improved for the IGC solution: the maximum safety index is 3.1 whereas the EGNOS solution gives a maximum safety index of 4.0. All those results show that both integrity and availability have been improved in the IGC module in severe ionospheric conditions, even in equatorial regions, with a more robust algorithm to high variations in the ionosphere.
7. CONCLUSIONS AND PERSPECTIVES A new module to compute GIVD and GIVE has been presented and tested on several scenarios with strong ionospheric conditions. The module relies both on an improvement of the geometry-free measurements containing the TEC values, thanks to a new preprocessing filter that is more robust to scintillation and loss-of-locks, and an improvement of the underlying algorithms that estimate the GIVD and GIVE from the TEC value measurements.
The geometry-free filter shows an excellent resistance to scintillation, both equatorial and polar, which allows to feed the ionosphere estimation filter with good quality TEC measurements even in strong ionosphere activity. The algorithms in the IGC module that process the TEC value measurements give a GIVD and GIVE estimates that clearly improve the availability of APV1 service on several scenarios, in the ECAC area and equatorial regions, and also improve the integrity level.
Besides allowing a better performance of SBAS in solar activity cycle peaks, these improvements pave the way for the extension of SBAS systems to equatorial regions where scintillation and strong gradients are much more common.
8. ACKNOWLEDGMENTS
The authors would like to thank Franck Haddad at Thales Alenia Space for its contribution regarding scintillation discussion, measurement behaviour at station level and their pre-processing to compute the TEC, and thank Rabab Lembachar at Thales Alenia Space for its development contribution.
The authors would also thank the CNES and ASECNA for the availability of SAGAIE data used for the experimentations.
Finally the author thank the Instituto Brasileiro de Geografia e Estatística and the Instituto Nacional de
Pesquisas Espaciais for the availability of Brazil data used for the experimentations
9. REFERENCES
[1] J.L. GOODMAN, Space Weather & Telecommunications, The Kluwer international series in engineering and computer science, Springer 2005 [2] B. ARBESSER-RASTBURG, N. JAKOWSKI,
Effects on satellite navigation, Space Weather- Physics and Effects, Springer 2007
[3] Minimum operational performance standards for Global positioning system / wide area augmentation system airborne equipment, DO-229D rev 1, Jan. 2013, RTCA ed. Washington, DC.
[4] A.J. MANNUCCI, B.D. WILSON, C.D. EDWARDS, A new method for monitoring the Earth’s Ionospheric Total Electron Content Using the GPS Global Network, ION GPS-93
[5] S. TRILLES, G. de la HAUTIERE, M. Van Den BOSSCHE, Adaptative ionospheric electron content estimation method, ION 2012
[6] P. ALLEAU, G. BUSCARLET, S. TRILLES, M. Van Den BOSSCHE, Comparative Ionosphere Electron Content Estimation Method in SBAS Performances, ION 2013
[7] T. DESERT, T. AUTHIE, S. TRILLES, Modelling of the ionosphere by neural network for equatorial SBAS, ION 2015
[8] K. HOCKE, K. SCHLEGLE, A review of atmospheric gravity waves and travelling ionospheric disturbances: 1982-1995, Annales Geophysicae, 1996, 14 (9), 917–940
[9] P.M. KINTNER, B.M. LEDVINA, E.R. de PAULA GPS and ionospheric scintillations, Space Weather 2007, 5, S09003