OATAO is an open access repository that collects the work of Toulouse
researchers and makes it freely available over the web where possible
Any correspondence concerning this service should be sent
to the repository administrator:
[email protected]
This is an author’s version published in: http://oatao.univ-toulouse.fr/21609
To cite this version:
Delroisse, Henry and Torré, Jean-Philippe
and Dicharry, Christophe Effects of a
Quaternary Ammonium Salt on the Growth, Wettability, and Agglomeration of Structure II
Hydrate Crystals. (2018) Energy & Fuels, 32 (12). 12277-12288. ISSN 0887-0624
Official URL:
https://doi.org/10.1021/acs.energyfuels.8b02980
Effects of a Quaternary Ammonium Salt on the Growth, Wettability,
and Agglomeration of Structure Il Hydrate Crystals
H. Delroisse, J.-P. Torré,
f>and C. Dicharry
*
e
CNRS/TOTAL/UNIV PAU & PAYS ADOUR/E2S UPPA, Laboratoire des Fluides Complexes et Leurs Réservoirs IPRA, UMR5150, 64000, Pau, France
•Supporting Information
ABSTRACT: This work studied the effects of a water soluble quaternary ammonium sait (called DA 50) on the growth, wettability, and agglomeration of cyclopentane (CP) hydrate crystals and methane (CH4)/propane (C3H8) hydrate crystals.
The impact on these properties of adding 4 wt % NaCI to the DA 50 solution was also investigated. The hydrates were formed from water/CP, water/(CP + n octane (n CS)), and water/(CP + n dodecane (n C12)) mixtures at atmospheric pressure and
from a water/n C8/(CH4 + C3H8) mixture under pressure (about 67 bar). Experiments were performed at a subcooling of 6 °C
in the case of the CP hydrates and 9-10 °C in the case of the CH4/C3H8 hydrates. In both hydrate systems, adding NaCI to the
surfactant solution of 0.1 or 1 wt % DA 50 led to the formation of individual oil wettable pyramidal crystals. Without sait, the hydrate formed a water wettable shell that covered the water/ oil interface just as the system without surfactant did. The antiagglomeration performance of the 1 wt % DA 50 solution was evaluated by performing torque measurements in an agitated batch reactor at a water eut of 30 vol %. Without Na Cl, torque increased with the amount of CP hydrates. The system formed a nonflowable jelly like phase, with water as the continuous phase, until a phase inversion occurred. From there on torque significantly decreased and the system became a flowable dispersion of large hydrate particles ( ~700 µm) in the CP phase. With 4 wt % NaCI, the system consisted of small ( ~70 µm) hydrate particles dispersed in the CP phase and the torque signal remained constant throughout the hydrate crystallization process. The torque profiles obtained at concentrations of O or 4 wt % NaCI for the CP hydrates and the CH4/C3H8 hydrates were similar, suggesting analogous states for both systems. For both hydrate systems, adding NaCI to the DA 50 solution led to the formation of oil wettable hydrates and drastically improved the antiagglomeration performance of the surfactant molecules, revealing a correlation between the formation of individual crystals and the antiagglomeration performance of the surfactant The similarity between the growth patterns and shapes of the CP hydra te crystals and the CH4/ C3H8-hydrate crystals confirmed that CP hydrates are an interesting mode! for evaluating the
antiagglomeration performance of surfactants.
1. INTRODUCTION
Gas hydrates are inclusion compounds composed of a network of water molecules (called hosts), forming cavities in which small molecules ( called guests) are encapsulated. The guests are usually light hydrocarbon molecules such as methane, propane, or carbon dioxide. Gas hydrates usually require low temperature (afewdegrees above O °C) and high pressure (a fewdozen bars) conditions to form. Depending on the size of the guest molecules, gas hydrates can crystallize as structures I, II, or H. Structure Il (sll), composed of a unit cell with 136 water molecules forming 16 small pentagonal dodecahedron cavities and 8 large hexakaidecahedron cavities, is one of the most frequently found in oil and gas production. 1
Crude oil production generally goes hand in hand with gas and water production. The presence of the three compounds associated with high pressure and low temperature conditions, as in the deep offshore for e:xample, is generally conducive to hydrate formation. If hydrate crystals form and agglomerate, they can plug pipelines and cause production shutdowns, resulting in economic losses and safety problems.1
Chemical additives can be used to prevent hydrate plug
formation.2 They are divided into two main families: (i)
thermodynamic hydrate inhibitors (THis) (such as methanol or
glycol), which are often used in large concentrations (several
dozen wt % relative to the water phase), and (ii) low dosage hydrate inhibitors (LDHis), of which only small amounts are required ( usually Jess than 1 wt % ) to achieve good protection against the risk of hydrate plug formation. LDHis are subdivided into two groups: kinetic hydrate inhibitors (KHis) and antiagglomerants (AAs). KHis delay hydrate nucleation and/ or reduce hydrate growth rate. AAs do not prevent hydrate formation but limit the agglomeration ofhydrate particles. THis, whose role is to prevent hydrate formation, are still the chemical additives most commonly used in the oil and gas industry for hydrate risk management. However, AAs are increasingly regarded as a robust and economical option for preventing hydrate blockage, especially for systems which are subject to high subcoolings ( difference between the system temperature and the hydrate equilibrium temperature at system pressure), aT,ub (> 10 °C),2 as in deep offshore production, for example, where KHis generally do not work AAs are surface active agents, which, due to their interfacial activity, 3 may promote the
formation of emulsions. Severa! authors have reported that in oil dominated systems the formation of a stable water in oil ( w/
o) emulsion can promote the dispersion of hydrate particles into the oil phase and prevent/limit their agglomeration.4−6 However, York and Firoozabadi (2008) demonstrated that a good antiagglomeration performance could be observed without a stable w/o emulsion.7
Cyclopentane (CP) hydrates have been widely used to evaluate the performance of AAs.8,9When combined with water, CP forms sII hydrates (as natural gas does) but at atmospheric pressure and moderately low temperatures (of less than 7−7.7 °C).1,10,11
CP hydrates have a stoichiometric CP:water molar ratio of 1:17. Because CP is almost insoluble in water (156 ppm at 25°C),12CP−hydrate formation occurs at the water/oil (i.e., water/CP) interface, as is the case for most sII−hydrates involved in blockages. Moreover, when CP is used in large quantities, it can act both as the hydrate former and as the oil phase. Recently, Abojaladi and Kelland9(2016) evaluated the performance of 26 surfactants (cationic, anionic, and nonionic) used as AAs on CP hydrates and natural gas hydrates in the presence of white spirit as the oil phase. They used two different experimental setups: agitated double walled glass beakers for the CP−hydrate system and sapphire rocking cells for the gas− hydrate system. The authors found that the majority of the most efficient additives for both hydrate systems belonged to the cationic family.
One drawback of using CP hydrates as a model system for gas hydrates formed at high pressure is that the maximum subcooling before the possible formation of ice is only around 7 °C. At low subcoolings, hydrate crystallization might be difficult to achieve, particularly if the AAs evaluated also have KHI properties.13To avoid this problem, crystallization is often triggered by seeding the system with preformed CP−hydrate crystals.14
Because AAs are amphiphilic molecules, they position themselves at the water/gas or water/oil interface, where hydrate crystallization generally occurs, and can also be adsorbed onto the hydrate crystals, affecting their morphology. Several authors15−17used CP hydrates to study the influence of surfactants on hydrate morphology. Without surfactants, it has been reported that polygonal hydrate crystals form a polycrystal line hydrate layer at the water/CP interface, while the presence of surfactants usually induces the formation of crystals of different shapes. In some cases, the hydrate crystals were seen to migrate from the water/CP interface to one of the adjacent phases: the aqueous phase if the adsorbed surfactant molecules made the crystals water wettable or the oil phase if the crystals were rendered oil wettable. For instance, Karanjkar et al.16 (2012) observed that the nonionic surfactant Span 80 used at 0.1 vol % in the oil phase triggered the growth of hollow conical crystals at subcoolings of more than 3.2°C and of plate like crystals at lower subcoolings. The hollow conical crystals became detached from the water/CP interface and then sank in the aqueous phase. Mitarai et al.15(2015) studied the effect of Span 80, a naphthenic acid, and a polypropylene glycol (PPG) on the formation of CP hydrates. They reported different crystal growth behaviors depending on the additive and its concen tration at subcoolings between 1.3 and 4.2°C. With 0.001 wt % of naphthenic acid or 0.001 and 0.01 wt % of Span 80, they observed that the hydrate crystals became detached from the interface and sank in the aqueous phase, whereas with 0.001 and 0.01 wt % of PPG, a porous hydrate layer formed at the water/ CP interface. At higher concentrations (0.01 wt %), the naphthenic acid inhibited hydrate formation. Delroisse et al.17 (2017) reported that 0.1−1 wt % of DA 50 (a quaternary
ammonium salt) in the aqueous phase induced the formation of a hydrate shell, composed of an assembly of smooth and/or striated plates, at the water/CP interface at a subcooling of 6°C. With a lower concentration of DA 50 (0.01 wt %), hydrate needles formed at the interface before sinking and aggregating into a thick unconsolidated layer in the aqueous phase.
Some authors studied the influence of surfactants on the morphology of sII gas hydrates. In the case of hydrates formed with a methane (CH4)/propane (C3H8) mixture in a system
without surfactants at a subcooling of 13.1°C, Yoslim et al.18 (2010) reported that a shell formed at the water/gas interface and needles appeared in the aqueous phase. With anionic surfactants (sodium dodecyl, tetradecyl, or hexadecyl sulfates) they observed the formation offibrous crystals at subcoolings between 3.6 and 13.1°C. Karanjkar et al.16(2012) studied the effect of Span 80 (0.1 vol % of the oil phase) on the formation of C3H8hydrates on a water drop immersed in a light mineral oil.
They observed thatfibrous crystals forming a porous structure developed into the drop, whereas without surfactant, a polycrystalline shell formed on the drop surface.
Cationic surfactants and more specifically quaternary ammonium salts are the type of AAs predominantly used in flow assurance to avoid hydrate problems.2
Their effectiveness is generally evaluated in the presence of salt because produced water (i.e., the water that is produced along with the oil and gas) always contains salt. Salt has both a thermodynamic effect (in that it shifts the hydrate equilibrium conditions to lower temperatures and higher pressures) and a kinetic effect (it slows down hydrate growth) on hydrate formation, both of which are intensified with the greater the salt concentration. As an example, the CP−hydrate equilibrium temperature (noted Teq) is about 7.2°C without salt, 5.3 °C with 5 wt % NaCl, and −11.7 °C with 23 wt % NaCl.16
Kishimoto et al.14(2012) found that at ΔTsub= 6 °C, the growth rate of hydrate crystals at the pure
water/CP interface was reduced by factors of 2 and 7 by adding 3.5 and 10 wt % NaCl, respectively. In addition, the presence of salt is known to affect the interfacial properties of ionic surfactants.19−21Consequently, salt can significantly modify the geometrical and physicochemical properties of hydrate crystals (such as morphology, size, and wettability), which may in turn affects the agglomeration of the hydrate particles. It is therefore of practical importance for the effect of a given surfactant on hydrate agglomeration to be studied in the presence and absence of salt. We showed in a previous study17that adding 3 or 4 wt % NaCl to a solution containing 0.1 or 1 wt % of DA 50 has a huge impact on the morphology and wettability of the CP−hydrate crystals formed at a quiescent water/CP interface. Without NaCl, we observed the formation of a hydrate layer composed of large water wettable hydrate plates that progressively covered the interface, whereas with 3 or 4 wt % NaCl a multitude of small (50−500 μm) individual pyramidal and CP wettable crystals formed at the interface, suggesting that this surfactant has interesting antiagglomeration properties in salt water.
The present work is a follow up to our previous study17 investigating the effects of DA 50 and salt (NaCl) on CP− hydrate growth at the water/oil interface. It examines and compares the effects of DA 50 on the morphology and wettability of hydrate crystals formed with CP (at atmospheric pressure) and with a CH4/C3H8gas mixture (at about 67 bar).
The antiagglomeration performance of this surfactant was evaluated for both hydrate systems. The influence of the nature of the oil phase (n octane, n dodecane) on CP−hydrate morphology and the antiagglomeration performance of DA 50
were also studied. The morphology of the hydrate crystals was determined by observing a quiescent water/oil interface under the microscope, and the antiagglomeration performance was studied in an agitated reactor for oil dominated systems containing 30 vol % of the aqueous solution. The effect of NaCl (at 0 and 4 wt % of the aqueous phase) on the hydrate formation pattern, hydrate morphology, and antiagglomeration performance was investigated. Finally, the possible correlations between hydrate morphology, the wettability of the hydrate crystals formed, and the antiagglomeration performance of the surfactant obtained for both hydrate systems were discussed.
2. EXPERIMENTAL METHODS
2.1. Materials. Cyclopentane (reagent grade, 98%), n octane (99% pure, referred to as n C8), and n dodecane (99% pure, referred to as n C12) were supplied by Acros Organics. Deionized water (resistivity of 18.2 MΩ.cm), produced by a Purelab laboratory water purification system, was used to prepare the surfactant solutions. The hydrate forming gas is a binary mixture of 84 mol % (relative uncertainty of ±2%) methane (CH4) and 16 mol % propane (C3H8) supplied by
Linde. The ionic surfactant used in the study is Noramium DA 50 (benzyl dodecyldimethylazanium chloride (C21H38ClN), see the
formula inSupporting Information A), a quaternary ammonium salt that is provided by ARKEMA CECA. DA 50 is water soluble, and its critical micelle concentration (CMC) in pure water is 0.15± 0.05 wt % at 25°C.17DA 50 induces the formation of oil in water emulsions in all of the systems used to evaluate the antiagglomeration performance in the agitated reactor. This observation is in accordance with Bancroft’s rule which states that“the phase in which a surfactant is more soluble (here the water phase) constitutes the continuous phase”.22However, we observed that the stability of the emulsions formed decreased in the presence of NaCl (see Table S1 inSupporting Information B).
2.2. Microscopic Observation of Hydrate Formation. CP
Hydrates. CP−hydrate growth and morphology were studied by
microscopic observation of the interface between the water phase and the CP phase. The CP and water were previously introduced into a cylindrical glass tube placed in a metal jacketed vessel, in which a water−glycol mixture was circulated to control the temperature (Figure 1). The details of the experimental setup are presented in our previous article.17In short, about 5 cm3of the aqueous solution and 3 cm3of CP
were successively introduced into the glass tube at room temperature. The glass tube was then covered with a glass cap to limit CP evaporation. The temperature of the system was decreased to a target temperature within the hydrate stability domain. After stabilization at
the target temperature, crystallization was triggered by seeding the system with a few small CP−hydrate crystals that had been formed in advance. Note that for some experiments (not reported in this work) we induced hydrate formation using the memory effect (after hydrate melting).23−25We observed the same hydrate morphology as when performing seeding with small crystals. All of the microscopic experiments presented in this work were conducted with a surfactant concentration of 1 wt %.
On the basis of the snapshots of the hydrate growth at the planar water/CP interface, the lateral hydrate growth rate, noted v, was evaluated by measuring the position of the hydrate crystallization front using the same method as described by Delroisse et al. (2017).17The growth rate was evaluated only for systems where the hydrates were growing in a continuous layer at the water/CP interface.
The wettability of the hydrate crystals was determined by placing a (1 °C) small cold drop of the aqueous solution on the hydrate layer formed at the water/CP interface. If the drop spread, the hydrate was water wettable, but if it remained spherical, the hydrate was CP wettable.
CH4/C3H8Hydrates. Hydrate formation in the presence of the CH4/
C3H8gas mixture was studied in a jacketed high pressure cell (designed
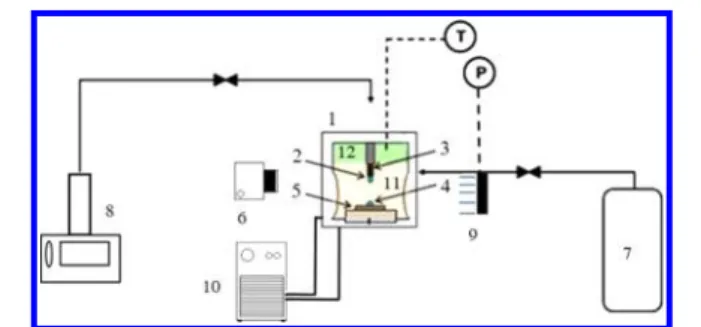
by Top Industrie, France) made of 316 stainless steel with an internal volume of 17 cm3. A schematic diagram of the experimental setup is
given inFigure 2. The cell has two sapphire windows of 18 mm in
diameter and comprises a horizontal tray and a vertically movable capillary, which is connected to a syringe pump (Isco 100DM) used to form a drop of the aqueous phase at the tip of the capillary. The latter can be moved down so that the water drop can be placed on the tray. The cell is connected to a gas storage vessel and a pressure sensor. A chiller (Huber minichiller) regulates the cell temperature, measured with a Pt100 probe with an accuracy of±0.1 °C. The optical and imaging system used to view the inside of the cell is composed of an LED ring light (from Advanced Illumination) and a binocular magnifier
(Wild Heerbrugg) fitted with a CCD camera (IDS UI124xSE C)
connected to a computer.
In a typical experiment, the cell wasfirst filled with 9 cm3of n C8
using a glass syringe, at atmospheric pressure and ambient temperature, before being closed. The system was cooled to 5.4°C, and the cell was then rapidly loaded with the CH4/C3H8gas mixture at 70 bar. In these
conditions, the subcooling was about 10 °C (evaluated using the
CSMGem software program1). The hydrate crystallization was
triggered drawing on the“memory effect” of the water after an ice formation/dissociation cycle.26To achieve this, the surfactant solution in the capillary tube connected to the high pressure cell and the syringe pump was frozen by pouring liquid nitrogen on it. Once the liquid was frozen, the pressure in the syringe pump was increased by a few bars to create an overpressure on the ice plug. As soon as the ice plug had melted (indicated by a pressure decrease in the syringe pump), the pump was used to slowly push the cold water to form a drop at the tip of the capillary. The drop was then deposited on the horizontal tray. Note that for these experiments the tray was covered with Teflon tape to prevent the drop from spreading and keep it as spherical as possible. Figure 1.Schematic diagram of the experimental setup at atmospheric
pressure: (1) metal jacketed vessel; (2) glass tube (diameter 28 mm); (3) glass cap; (4) LED light table; (5) chiller; (6) binocular magnifier with camera; (7) aqueous solution; (8) cyclopentane; (9) hydrate crystal seeds.
Figure 2.Schematic diagram of the experimental setup at high pressure: (1) high pressure cell; (2) pendant drop; (3) capillary; (4) deposited drop; (5) metal tray; (6) binocular magnifier with camera linked to a computer; (7) gas storage tank; (8) Isco pump; (9) LED light table; (10) chiller; (11) n octane; (12) CH4/C3H8gas mixture.
Hydrate formation was usually observed to occur a few seconds after the drop was deposited. Snapshots of the hydrate crystallization and growth were taken and recorded at regular intervals. The experiments were performed with a surfactant concentration of 0.1 wt %, because the interfacial tension between the surfactant solution and the n C8 was too low when concentrations were higher, making it difficult to control the formation of the drop and to deposit it on the tray (seeSupporting
Information C).
2.3. Evaluation of Antiagglomeration Performance. The experimental apparatus used is detailed inFigure 3. The stirred tank
reactor (designed by Parr Instrument Co.) is a jacketed, high pressure reactor made of 316 stainless steel with an internal volume of 360± 3 cm3. For agitation, the reactor is equipped with a homemadeflat blade
turbine (with four blades) driven by an ac motor, which is able to maintain a constant rotational speed throughout the experiment. A Pt100 probe (accurate to within ±0.2 °C) is used to measure the temperature in the liquid phase. The temperature in the reactor is maintained at the required valuewith a stability of ±0.2 °Cby continuous forced circulation of a water−propylene glycol mixture in the reactor jacket using a thermostatic bath (Polystat 37, Fischer Scientific). A torque meter (provided by Kistler, model 4503) is placed on the stirring shaft and allows the agitator torque to be measured up to 2 N·m with an accuracy of 0.2%. Note that the agitation motor can deliver a maximum torque of 0.7 N·m. The reactor contains an extractable cylindrical glass vessel of 300 cm3. The inner surface of this
glass vessel is hydrophobized using 1H,1H,2H,2H perfluorodecyltri chlorosilane to limit the adhesion of hydrate particles on its surface during the crystallization.
CP Hydrates. The cylindrical glass vessel wasfilled with 45 cm3of
pure water or surfactant solution with 1 wt % DA 50 and with 105 cm3
of CP. These proportions correspond to a water:CP ratio of 30:70 (v/v %). The agitation was set to 200 rpm, allowing good homogenization of the phases, and the system was cooled to 1 °C. Once the target temperature was reached and the system temperature stabilized, agitation was stopped and the reactor briefly opened so that the system could be seeded with a few CP−hydrate crystals formed previously. The reactor was then shut again, and agitation was restarted. Because hydrate crystallization is an exothermic reaction, the onset of the hydrate formation was detected owing to an increase in the reactor temperature and the end of the reaction was identified through a decrease in the reactor temperature (as heat is no longer released by the hydrate formation). When the reactor temperature reached the target temperature again, the experiments were stopped and the reactor opened to collect (whenever possible) samples of the oil phase and of the hydrate particles. The oil phase was analyzed by gas chromatog raphy to determine the water to hydrate conversion (as detailed in the
next sectionDetermination of the Water to Hydrate Conversion), and the hydrate particles were observed by microscopy to determine their shape, diameter, agglomeration state, and wettability. The microscopic observations were performed using the experimental setup shown in
Figure 1based on the following protocol: (i) the setup wasfirst cooled
to 0°C; (ii) cold CP (stored at −10 °C) was then loaded into the glass tube; and (iii) the collected sample was quickly incorporated into the CP. Snapshots of the hydrate particles immersed in the CP were taken. The mean value of the particle diameter was evaluated by measuring the diameter of at least 30 particles.
CH4/C3H8Hydrates. The cylindrical glass vessel wasfilled with 36
cm3 of pure water or surfactant solution (at 1 wt % DA 50) and
completed with 84 cm3of n C8 to obtain a water:oil ratio of 30:70 (v:v
%). The reactor was closed, connected to the gas storage tank, and pressurized with the CH4/C3H8gas mixture to an equilibrium pressure
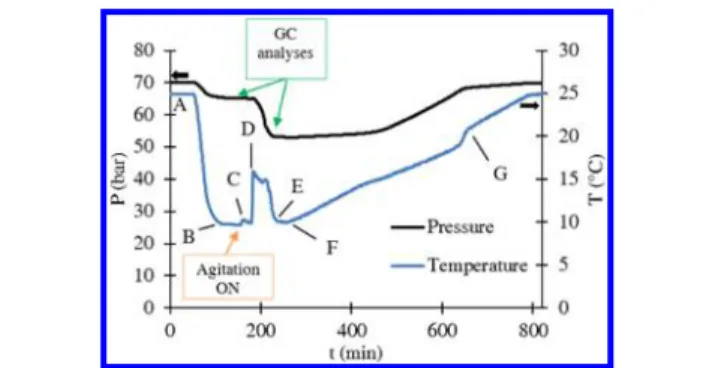
of 70± 1 bar under agitation (200 rpm) at 25 °C. A typical experiment took place in two stages. In thefirst stage, the hydrate formation was forced by rapidly reducing the system temperature to 2°C (which corresponds to a subcooling of about 17°C). Once the hydrate had developed, it was decomposed by raising the temperature at a rate of 2 °C/h to 25 °C (about 6 °C above the hydrate equilibrium temperature). The second stage consisted in using the“memory effect” of water that had previously undergone hydrate formation and decomposition to favor hydrate crystallization. For that purpose, the system was kept under agitation for 2 h at 25°C. The agitation was then stopped, and the system was cooled to 10°C at a rate of 20 °C/h (point A to B inFigure 4). When the system temperature and pressure were
stable, agitation was resumed (200 rpm, point C). Hydrate crystallization was detected owing to an increase in the system temperature (due to the exothermicity of the reaction) and a decrease in the system pressure due to gas being consumed by the forming hydrate phase (point D). Gas chromatography (GC) analyses of the gas phase were performed before and after the hydrate formation (points C and E) in order to determine the CH4:C3H8mole ratio. The hydrate
was then dissociated by heating the system to 25°C at a rate of 2 °C/h (points F to G). The variation in the agitator torque measured during the hydrate formation (between points C and F) was used to quantify the degree of agglomeration of the system.
Figure 5shows the reactor pressure versus temperature curve (also
called hysteresis curve) for the hydrate formation experiment shown in
Figure 4. The equilibrium curves (calculated using the CSMGem
software program1) for the sII−hydrates formed with the CH4/C3H8
(84/16 mol/mol %) gas mixture and for the sI−hydrate formed with pure CH4are also plotted in thisfigure. We can see that the hydrates
formed outside of the CH4hydrate stability domain, proving that only
sII−hydrates developed during the experiments.
2.4. Determination of the Water-to-Hydrate Conversion. CP Hydrates. The water to hydrate conversion was evaluated by determining, by gas chromatography (GC), the variation of the concentration of n C12 used as a chemical marker in the CP phase. n C12 is not soluble in water and does not form gas hydrates. It was used Figure 3.Schematic diagram of the experimental setup: (1) high
pressure reactor; (2) computer control; (3) chiller; (4) picture of the reactor with the agitator and the cylindrical glass vessel.
Figure 4.Typical diagram of the system pressure (P) and temperature (T) versus time (t) obtained for the hydrate formation experiments. System: CH4/C3H8gas mixture/n C8/surfactant solution (1 wt % DA
at a sufficiently low concentration in the CP phase (2 wt %) to prevent a significant shift of the CP−hydrate equilibrium temperature. This temperature was measured at Teq= 7.1± 0.2 °C in the presence of 2 wt
% of n C12 instead of 7.2± 0.2 °C without n C12, as detailed in the following sectionMeasurement of the Hydrate Equilibrium Temper
ature. During hydrate formation, the CP molecules were consumed and
the n C12 molecules therefore concentrated in the oil phase. Analysis of a sample of the remaining oil phase collected at the end of the experiment helped determine its n C12 content. Each sample was analyzed 6 times, and the uncertainty was determined from the standard deviation calculated from the 6 values obtained. The molar ratio of the water to hydrate conversion was calculated using the following equation = − i k jjj y{zzz W n N n . 1 C . C CP h w C12i C12f (1) where nCPis the number of moles of CP, CC12i and CC12f are the mass
fractions of n C12 in the CP before and after hydrate formation, Nhis
the hydration number (Nh= 17), and nwis the total number of moles of
water.
CH4/C3H8 Hydrates. In this case, the water to hydrate conversion
(molar basis) was determined from the pressure decrease measured during hydrate formation (i.e., between the GC analyses of points C and
E inFigures 4and5) = − ·
(
)
W N n . V RT P z P z h w g i i f f (2) where the subscripts i and f refer to the initial andfinal states, P is the reactor pressure, T is the reactor temperature, Vgis the gas volume inthe reactor, R is the gas constant, and nwis the total number of moles of
water. zi and zf are the compressibility factors of the gas mixture
obtained from the Peng−Robinson equation of state. Nh is the
hydration number (Nh= 6.0) calculated by determining the equilibrium
temperature value for a system of CH4/C3H8, water, and n C8 at 70 bar
and at the same molar fractions as used in the experiments using CSMGem.
The volume fraction (Φ) of the hydrate phase formed in both hydrate systems (CP hydrates and CH4/C3H8hydrates) was calculated
from the water conversion
Φ = ϑ + − + V V V V W V . ( . ) h h w w o (3)
where the subscripts h, w, and o refer to the hydrates, water, and oil, respectively, and V is the volume. The volume of the hydrate phase (Vh
= VwWϑ) is calculated taking in account the volume expansion between
the liquid water and the hydrate (notedϑ) equal to 1.18 for CP hydrates and 1.13 for CH4/C3H8hydrates (obtained using CSMGem).
2.5. Measurement of the Hydrate Equilibrium Temperature. CP Hydrates. In the present study, we used the equilibrium temperatures of the CP hydrates determined previously by Delroisse et al. (2017).17Teq= 7.2± 0.2 °C for the CP hydrates formed with pure
water, and Teq= 5.5± 0.2 °C for those formed with 4 wt % NaCl.
CH4/C3H8 Hydrates. The equilibrium pressure (Peq) and temper
ature (Teq), corresponding to the pressure and temperature at which the
last hydrate crystal present in the system dissociates, were estimated from the hysteresis curve at the inflection point of the heating curve (point G inFigure 5). The results obtained for the systems studied are summarized inTable 1. The hydrate equilibrium temperature for the
system without DA 50 and NaCl at Peq = 67 bar calculated using
CSMGem is also given inTable 1. The theoretical Teqis consistent with
the experimental value. We believe that the shift (of about 0.6°C) in the measured hydrate equilibrium temperature observed in the presence of 1 wt % DA 50 was due to a kinetic effect caused by the high heating rate used (2°C/h) to dissociate the hydrate27and the adsorbed DA 50 molecules on the hydrate surface that might slow down hydrate dissociation.
3. RESULTS AND DISCUSSION
3.1. Hydrate Morphology. CP Hydrates. All of the microscopic observations were conducted at ΔTsub = 6.0 ±
0.5°C.Figure 6shows snapshots of the hydrate growth at the
water/CP interface with or without DA 50 and NaCl. The time given was measured from the seeding of the system. Without surfactant (Figure 6.1a and6.1b) and with 1 wt % DA 50 without NaCl (Figure 6.2a), the hydrates formed a shell, composed of smooth and striated plates, at the water/CP interface. The hydrate crystals that developed were water wettable (when a drop of the aqueous solution was deposited on them, it spread).
Figure 5.System pressure (P) versus system temperature (T) for the hydrate formation experiment shown inFigure 4. Equilibrium curves of the gas hydrates (calculated with the CSMGem software program) formed with pure CH4and with the CH4/C3H8gas mixture are also
shown.
Table 1. Equilibrium Temperature and Pressure (TeqandPeq)
for Gas Hydrates without DA 50, with 1 wt % DA 50, and with 1 wt % DA 50 and 4 wt % NaCl
system NaCl (wt %) Teq(°C) Peq(bar)
without DA 50 (calculateda) 0 18.6 67
without DA 50 (experimental) 0 18.9± 0.5 67± 1
1 wt % DA 50 0 19.5± 0.5 67± 1
1 wt % DA 50 and 4 wt % NaCl 4 18.4± 0.5 65± 1
aUsing the CSMGem software program.
Figure 6.Snapshots showing CP−hydrate morphologies with 0 and 4 wt % NaCl, without surfactant, and with 1 wt % DA 50 at a subcooling of 6°C.
With 1 wt % DA 50 and 4 wt % NaCl, a large number of small, individual pyramidal crystals with the vertex pointing to the CP phase formed at the water/CP interface (Figure 6.2b). These crystals were oil wettable (when a drop of the aqueous solution was deposited on them, it did not spread), and their lateral size was about 300 μm. Once the water/CP interface was totally covered, the hydrates stopped growing. Note that the same observations were made with 0.1 wt % DA 50 and 4 wt % NaCl. All of these results are in perfect agreement with those described by Delroisse et al. (2017) for the same systems.17
For the systems with 1 wt % DA 50, hydrate morphology experiments were also performed with oil phases composed of a 50/50 vol % mixture of CP and n C8 or n C12 (alkanes which do not form hydrates). The results of these hydrate morphology experiments are presented in Figure S2 of Supporting Information D. In short, adding the alkanes significantly reduced the hydrate growth rate (seeTable S3). This observation could be correlated with lower mass transfer kinetics of the CP molecules from the oil phase to the hydrate formation front (compared to pure CP), directly related to the concentration of
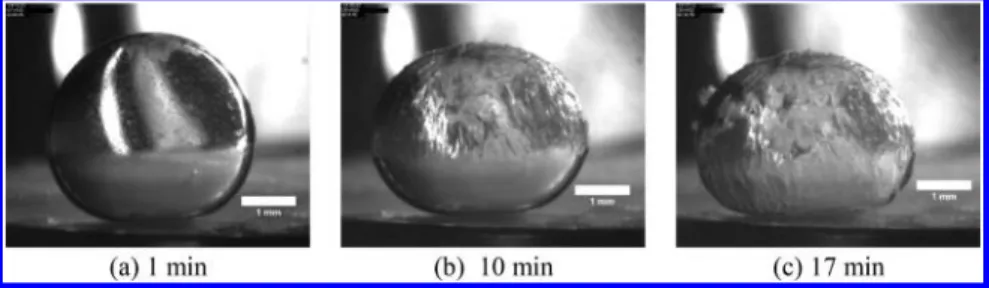
Figure 7.Snapshots of gas hydrate formation with CH4/C3H8on a drop of pure water in n C8 at 66 bar and T = 5.4°C.
Figure 8.Snapshots of gas hydrate formation with CH4/C3H8on an aqueous drop with 0.1 wt % DA 50 without (a) or with 4 wt % NaCl (b) in n C8 at
CP in the oil phase (as CP is diluted with n C8 or n C12 in this case). For example, the lateral hydrate growth rate (v) for the systems without NaCl in the surfactant solution was three times slower in the presence of n C8 (v = 0.033± 0.002 mm/min) or n C12 (v = 0.032± 0.003 mm/min) than in an oil phase made up of 100% CP (v = 0.11 ± 0.02 mm/min). However, the presence of n C8 or n C12 in the oil phase had no significant effect on the hydrate morphology. In contrast, with 4 wt % NaCl in the surfactant solution, both plate and pyramidal hydrate crystals were observed (instead of only pyramidal crystals when the oil phase was pure CP). The wettability of the hydrates formed was similar to the result obtained for the system with pure CP as the oil phase.
CH4/C3H8Hydrates. All of the microscopic observations were
conducted at ΔTsub = 10.0 ± 0.5 °C (calculated using
CSMGem1). Figures 7 and 8 show snapshots of hydrates forming on a sessile aqueous drop (pure water (Figure 7) and a surfactant solution (Figure 8)) immersed in n C8. The gas phase, which is above n C8, cannot be seen in these images. Without surfactant and with 0 or 4 wt % NaCl, a hydrate shell gradually covered the drop surface from top to bottom. An example of the shell formation is presented inFigure 7for the pure system (Figures 7a−c).
With 0.1 wt % DA 50, the same hydrate formation pattern as for the system without surfactant was observed, i.e., a hydrate shell formed and progressively covered the drop from top to bottom (seeFigure 8a). With 0.1 wt % DA 50 and 4 wt % NaCl, the hydrate formation pattern changed drastically. In this case, a multitude of pyramidal crystals appeared at the top of the drop (Figure 8b). The vertex of the pyramids pointed to the n C8 phase, suggesting the crystals were oil wettable. They moved down along the water/n C8 interface before accumulating at the bottom of the drop, where they grew in larger quantities. As the amount of hydrates increased, the accumulation of hydrates covered the remaining liquid part of the drop (Figure 8b and8c).
The drop seemed to be totally converted into hydrates in about 10 min.
One can see clear similarities in the growth and morphology of the hydrate crystals in both hydrate systems (CP and CH4/
C3H8). In fact, with or without DA 50 and without NaCl, the
water/oil interface was progressively covered by a hydrate shell. In the presence of DA 50 and 4 wt % NaCl, individual pyramidal crystals, with their vertex pointing to the oil phase, formed at the interface. Because the CP−hydrate pyramidal crystals that formed at these concentrations of DA 50 and NaCl were oil wettable, it is consequently reasonable to assume that those formed with CH4/C3H8hydrates are also oil wettable.
3.2. Antiagglomeration Performance of DA 50. Observation of hydrate formation at the water/oil interface revealed significant changes in the formation pattern, morphol ogy, and wettability of the hydrate crystals when NaCl was added to the DA 50 solution. Tofind out if these changes might have an effect on hydrate agglomeration, we measured the agitator torque during hydrate formation in the agitated batch reactor for both hydrate systems.
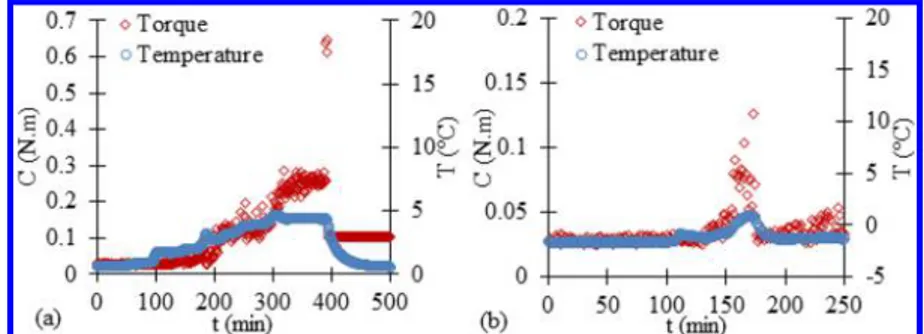
CP Hydrates.Figure 9a shows the variation in the torque (C) and temperature (T) versus time (t) for a pure water/CP system for a period ranging from 100 min before the onset of the hydrate crystallization (detected by a significant increase in the system temperature) to 100 min after the end of the hydrate formation. Once the hydrates started growing, the torque progressively increased to 0.3 N·m until the agitator (at around 0.65 N·m) seized up at 400 min. This sudden blockage caused the agitator to disconnect from the motor, and the torque dropped to a constant value of about 0.1 N·m. This value was above the initial baseline (∼0.025 N·m) because the hydrates agglomerated around the agitator still maintained a residual torsional strength on the stirring shaft. We opened the reactor and saw that the system was composed of a hydrate plugfilling the reactor over the entire height of the agitator (a snapshot of
Figure 9.Torque (C) and temperature (T) versus time (t) during the formation of CP hydrates without surfactant and NaCl (a) and with NaCl (b) at a subcooling of 6°C.
Figure 10.Torque (C) and temperature (T) versus time (t) during the formation of CP hydrates with 1 wt % DA 50, without (a) or with NaCl (b) at a subcooling of 6°C.
the hydrate plug is presented in Supporting Information E), making the agitator and the glass tube interdependent. Due to the lack of supernatant CP, we were unable to determine the water to hydrate conversion. The torque rise observed soon after the beginning of the hydrate growth reflected an increase in the viscosity of the system caused by the formation and agglomeration of the hydrate particles. Agglomeration could be explained by the formation of capillary bridges between adjacent wet hydrate particles.28
With 4 wt % NaCl (Figure 9b), the torque rapidly increased to 0.13 N·m without the agitator seizing up before dropping to the baseline andfluctuating around it. At the end of the experiment, we opened the reactor and saw that hydrate agglomerates were stuck to both the agitator and the inner wall of the glass vessel. The collision of these agglomerates and with the reactor interns (e.g., temperature probe) during agitation caused the erratic torque signal profile (i.e., presence of torque spikes) observed at the end of the experiment. The water to hydrate conversion was not determined because no free CP was visible. The brutal drop in the torque from 0.13 N·m to the baseline was probably caused by large hydrate agglomerates suddenly breaking into smaller ones, which have a lower impact on fluid circulation in the reactor.
The torque and temperature as a function of time measured for the system with 1 wt % DA 50 are shown inFigure 10. The reproducibility of the trends observed was verified (see Figure S5 inSupporting Information F).
Without NaCl, the torque started increasing about 45 min after the beginning of crystallization and reached 0.22 N·m before decreasing rapidly to attain the baseline (Figure 10a). At the end of the experiment, we opened the reactor and saw a large number of hydrate particles dispersed in the CP. The GC analysis of the supernatant CP phase revealed that all of the water present in the system had been converted into hydrates
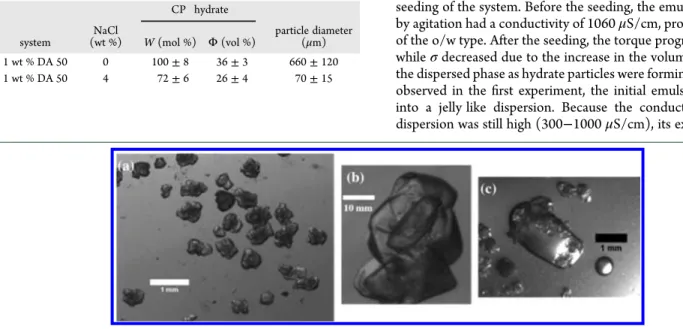
(Table 2). The agglomerated hydrate particles had a mean
diameter of 660± 120 μm (Figure 11). A zoomed in view of a particle (Figure 11b) shows that it is composed of several small pieces of hydrates welded together. A drop of a cold aqueous solution of 1 wt % DA 50 deposited on the particles made them wet (Figure 11c), demonstrating that they were water wettable. In an attempt to obtain more information on the system responsible for the torque variations during the experiment, we conducted two complementary experiments on the system with 1 wt % DA 50. In thefirst, we stopped the agitation and opened the reactor every 15 min to take snapshots of the system (see Figure 12). InFigure 12, the torque vs time curve can be divided into three parts. Thefirst (marked 1) corresponds to the water/ CP/DA 50 system before seeding. Here, a homogeneous emulsion (of the o/w type according to the Bancroft rule) was formed by agitation. The second part (marked 2) corresponds to the stage where the torque increased due to the formation of hydrates. In this part, the reactor was opened six times. Thefirst two times the system consisted of a milky dispersion of hydrate particles and doubtless of CP droplets in the aqueous phase (due to the initial o/w emulsion type). To the naked eye, it was moderately viscous. From the third opening, the system became a jelly like material. This change was caused by the increasing amount of dispersed phase (CP and hydrate particles) in the water phase. The last part (marked 3) corresponds to the drop in torque. Thefirst time the reactor was opened after the maximum torque value was reached we observed a small amount of supernatant CP phase and a large number of hydrate particles forming clusters. The volume of the supernatant CP phase increased until the torque reached the baseline. Here, the system was composed of hydrate particles dispersed in a continuous CP phase (top right hand picture inFigure 12).
The second experiment consisted in measuring the conductivity (σ) of the system as a function of time to determine whether the sudden decrease in the torque signal was caused by the inversion of the continuous phase from water to CP. Note that in this experiment 0.25 wt % NaCl was added to the deionized water so that the water and CP conductivities would be clearly distinguishable. The values ofσ vs time are plotted inFigure 13. The point at t = 0 min corresponds to the seeding of the system. Before the seeding, the emulsion formed by agitation had a conductivity of 1060μS/cm, proof that it was of the o/w type. After the seeding, the torque progressively rose whileσ decreased due to the increase in the volume fraction of the dispersed phase as hydrate particles were forming. As already observed in thefirst experiment, the initial emulsion changed into a jelly like dispersion. Because the conductivity of this dispersion was still high (300−1000 μS/cm), its external phase Table 2. Water to Hydrate Conversion (W), Hydrate Volume
Fraction (Φ), and Particle Diameter for the Systems with DA 50 and without and with 4 wt % NaCl at a Subcooling of 6°C
CP hydrate system NaCl (wt %) W (mol %) Φ (vol %) particle diameter (μm) 1 wt % DA 50 0 100± 8 36± 3 660± 120 1 wt % DA 50 4 72± 6 26± 4 70± 15
Figure 11.Snapshots of agglomerated hydrate particles at the end of the CP−hydrate formation experiments in the batch reactor with 1 wt % DA 50 (a), zoomed in view of a hydrate particle composed of small pieces of hydrates welded together (b), and particles wetted by a drop of cold aqueous solution of 1 wt % DA 50 (c).
was, consequently, the aqueous phase. The torque signal began to drop at t = 80 min, whileσ kept on decreasing until t = 100 min. As mentioned above, the system released a small amount of the CP phase as soon as the torque decreased. However, asσ was not equal to zero, the system was not completely inverted. Here, the system was composed of a sedimented phase, containing a large number of hydrate particles, and a supernatant CP phase. The amount of CP phase released progressively increased as the water was converted into hydrates. At t = 100 min, the zero value ofσ indicated the CP phase was now the continuous phase. As suggested by the GC analyses of the CP released, all of the water was converted into hydrates. With no more free water available in the system, capillary bridges between the hydrate particles could not form (the hydrate particles were “dry”) and their agglomeration was therefore limited.
With 4 wt % NaCl (Figure 10b), the torque value remained almost constant at a very low value (i.e., lower than 0.05 N·m) during the hydrate formation and without any blockage of the agitator. Ten hours after hydrate formation, the reactor was opened. We observed that the system was composed of a dispersion of small hydrate particles with a mean diameter of 70 ± 15 μm. When a drop of a cold aqueous solution of 1 wt % DA 50 and 4 wt % NaCl was deposited on the particles, it did not cover them but was repelled, meaning that the particles were hydrophobic. The water to hydrate conversion was determined to be 72± 6 mol %, which corresponds to a hydrate fraction of 26± 4 vol %. The presence of unconverted water was due to the
presence of NaCl. Although there was still free water in the system, the fact that the particles were hydrophobic prevented the formation of capillary bridges between them, thereby limiting their agglomeration.
To verify that the difference in torque behavior observed between the systems without and with 4 wt % NaCl (Figure 10a and10b) was not caused by the difference in the volume fraction of the hydrate phase (36 vol % without NaCl against 26 vol % with NaCl), we conducted a new experiment. We used the required amount of aqueous phase (containing 1 wt % DA 50 and no salt) to obtainafter total conversion of water into hydratesthe same volume fraction of hydrates as for the system with 1 wt % DA 50 and 4 wt % NaCl (i.e., 26%). As expected, this system formed a jelly like material (visible to the naked eye) responsible for the torque increase (up to 0.06 N·m (see Figure S6 inSupporting Information G)). Then the torque fell rapidly to the baseline as observed in the system with 1 wt % DA 50 and no salt (Figure 10a), and the final system was composed of hydrate particles dispersed in a continuous CP phase. These observations demonstrated that the difference between the torque behaviors observed without and with 4 wt % NaCl was not caused by the difference in the volume fraction of the hydrate phase but by the improved antiagglomeration performance of DA 50 with NaCl.
Antiagglomeration performance experiments were also conducted for the systems with 1 wt % DA 50 and 0 or 4 wt % NaCl and oil phases composed of a 50/50 vol % mixture of CP and n C8 or n C12. Results are presented in Figure S3 in
Supporting Information D. Without surfactant, hydrates
agglomerated and stuck to the agitator and the glass vessel for both oil mixtures. With 1 wt % DA 50, the system formed a jelly like material when no salt was present and aflowable hydrate slurry in the presence of 4 wt % NaCl. These experiments showed that the solution with 1 wt % DA 50 and 4 wt % NaCl effectively prevents hydrate agglomeration for different oil phases.
CH4/C3H8Hydrates. Figure 14shows the torque, pressure,
and temperature variations versus time for the systems without surfactant, with 1 wt % DA 50, and with 1 wt % DA 50 and 4 wt % NaCl at a subcooling of 9°C. The final values of the water to
Figure 12.States of the water/CP/hydrate system in the presence of 1 wt % DA 50 and of the torque as a function of time.
Figure 13.Conductivity (σ) and torque (C) versus time (t) measured during hydrate formation with 1 wt % DA 50 and 0.25 wt % NaCl.
hydrate conversion and the hydrate volume fraction are given in Table 3.
Without surfactant (Figure 14a), the hydrate crystallization caused the torque to increase to about 0.15 N·m. The torque thenfluctuated around this value before suddenly dropping to the baseline (0.025 N·m). Frictions between hydrate agglom erates on the agitator and the glass tube wall might be the reason for the erratic torque signal profile. The rapid drop to the baseline might be due to the hydrate agglomerates breaking into smaller ones. Thefinal hydrate volume fraction was 17 ± 2 vol % (water to hydrate conversion of 49± 5 mol %).
With 1 wt % DA 50 (Figure 14b), the crystallization induced a progressive increase of the torque signal up to 0.10 N·m before it rapidly fell to the baseline. Surprisingly, thefinal hydrate volume fraction (18± 2 vol %) was almost the same as for the system without surfactant (17± 2 vol %). Since the interfacial area between the aqueous and the oil phases should increase in the
presence of a surfactant in agitated systems, one might have expected a higher water to hydrate conversion. In fact, hydrate growth seemed to end when the C3H8was depleted. For both
systems, less than 1 mol % of C3H8remained in the gas phase at
the end of the hydrate formation.
The sudden drop in torque is similar to that observed for CP hydrates with DA 50 (Figure 10a), which was caused by inversion of the continuous phase (from water to CP) induced by the very high (nearly complete) water to hydrate conversion. However, in the present case, the conversion was not complete (52 mol %). In 2011, Moradpour et al.29 showed that the emulsion type could change during gas hydrate formation. With 1 wt % of a quaternary ammonium salt in a system with 60 vol % of water, the authors observed that inversion of the emulsion type (from o/w to w/o) occurred when the volume fraction of hydrates reached 1−11% depending on the oil used (crude oils in their case). As already mentioned, the DA 50 promoted the formation of an o/w emulsion for a water/n C8 system (at atmospheric pressure). We assume the same type of emulsion formed in the presence of the gas phase. Consequently, the viscosity of the system initially increased because the volume of the dispersed phases (n C8 and hydrates) increased. On the basis of the variation in the reactor pressure, measured between the beginning of hydrate crystallization and the onset of the torque drop, we calculated that the hydrate volume fraction was 16 vol %. A phase inversion therefore possibly explains the torque signal behavior.
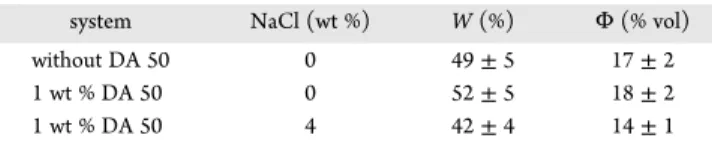
In the presence of 4 wt % NaCl, the torque remained almost constantly at the baseline as the hydrate was forming (Figure 14c). The hydrate volume fraction (14± 1 vol %) was about the same as that for the other systems, for which a large increase in the torque value was observed. Consequently, as already observed for the CP−hydrate systems, the presence of NaCl greatly improved the antiagglomeration performance of DA 50 for gas hydrates.
3.3. Discussion on the Correlation between the Hydrate Morphology and the Antiagglomeration Per-formance of the Surfactant. Microscopic observation of the hydrate crystals formed at a quiescent water/oil interface seems to provide valuable information on the capacity of the surfactant used to prevent hydrate agglomeration. Actually, we saw that DA 50 exhibited good antiagglomeration performance only when it induced the formation of individual oil wettable crystals at the quiescent interface. It is particularly interesting to note that the improvement in the antiagglomeration performance of DA 50 induced by the NaCl coincides with the changes in morphology (from plates to pyramids) and wettability (from water to oil) of the crystals formed. Good antiagglomeration performance of surfactant molecules coupled with the formation of oil wettable crystals is consistent with the results recently published by Brown et al. (2018).30
Whether the oil phase was a mixture of n C8/CP, n C12/CP, or pure CP, the hydrate growth pattern and the morphology of the hydrate crystals formed without or with DA 50 was very similar. Even if some morphological differences were observed when NaCl was added to the DA 50 solution (a mixture of plate and pyramidal crystals for systems with n C8/CP or n C12/CP instead of pyramidal crystals only with pure CP as the oil phase), the presence of NaCl drastically improved the antiagglomera tion performance of DA 50. The differences observed in the hydrate morphology might be explained by changes in the physicochemical environment of the surfactant. The presence of alkane chains in the CP phase and of NaCl in the aqueous phase
Figure 14.Torque (C), pressure (P), and temperature (T) versus time (t) during the gas hydrate formation without surfactant (a), with 1 wt % DA 50 without NaCl (b), and with 1 wt % DA 50 and 4 wt % NaCl (c) at a subcooling of about 9°C.
Table 3. Water to Hydrate Conversion (W) and Hydrate Volume Fraction (Φ) in the Presence of DA 50 without and with 4 wt % NaCl at a Subcooling of 9°C
system NaCl (wt %) W (%) Φ (% vol)
without DA 50 0 49± 5 17± 2
1 wt % DA 50 0 52± 5 18± 2
modified the affinity of the surfactant for both phases3and hence its interactions with the w/o interface and hydrate surface.
It can be noted that the shapes of the CP−hydrate particles formed in the agitated reactor were different from those of the hydrate crystals observed at the quiescent water/CP interface (pyramids for the latter and spherical particles for the former for the systems with 1 wt % DA 50 and 4 wt % NaCl for example). Continuous mixing of the water/CP/hydrate phase, which is conducive to hydrate growth in all directions and causes collisions between the hydrate crystals, is undoubtedly responsible for the difference in the shapes observed.
Finally, the observations (morphology and wettability of the hydrate crystals and the antiagglomeration performance of the surfactant) made with both hydrate systems (CP and CH4/
C3H8) appeared consistent, suggesting that CP hydrates are a good sII−hydrate model. This point is in agreement with conclusions recently given by Abojaladi and Kelland9 (2016), namely, that CP hydrates could be a good analog for sII gas hydrates for a first time screening of the antiagglomeration performance of surfactants.
4. CONCLUSION
The microscopic observations of hydrate growth at a quiescent water/oil interface showed that adding NaCl to a DA 50 solution has a significant effect on the morphology and wettability of the hydrate crystals formed. With 0.1−1 wt % DA 50 and no salt, the hydrates formed water wettable plates, but by adding 4 wt % NaCl to the surfactant solution individual oil wettable pyramidal crystals developed.
The antiagglomeration performance experiments on CP hydrates showed that the system with 1 wt % DA 50 went through a jelly like dispersion phase composed of CP and hydrate particles in a small amount of liquid water, a state definitely incompatible with transportation of the system in a pipeline. However, as hydrates continued to form, inversion of the continuous phase occurred (i.e., the CP became the continuous phase) and the torque (and consequently the system viscosity) fell. The dispersed phase represented more than 70 vol % before the inversion and about 36 vol % afterward. Due to the high (nearly total) water to hydrate conversion, the system was ultimately composed of “dry” hydrate particles dispersed in the CP phase. The absence of free water prevented the formation of capillary bridges between the particles and thus their agglomeration. As a result, the hydrate slurry formed was flowable. The addition of NaCl to the DA 50 solution reduced the size of the CP−hydrate particles by a factor of 10 (from about 700 to 70 μm) and made them oil wettable, which improved the antiagglomeration performance of the DA 50 molecules (no torque increase observed during the hydrate formation). Note that good correlations were found between the wettability of the hydrate crystals formed in the agitated reactor and at the quiescent water/CP interface.
In the case of CH4/C3H8 hydrates, the same trends were
observed. With 1 wt % DA 50 and no salt, hydrates agglomerated (high torque increase observed), but by adding 4 wt % NaCl to the surfactant solution aflowable hydrate slurry formed (no torque increase observed).
Interestingly enough, the addition of 50 vol % of n C8 or n C12 to the CP oil phase had a negligible effect on the morphology and wettability of the CP−hydrate crystals and the antiagglomeration performance of DA 50. It mainly reduced the kinetics of the hydrate formation and the water to hydrate conversion. Therefore, mixing CP with another oil (instead of
using pure CP) to study CP−hydrate formation makes it possible to keep a certain amount of free water throughout the experiment to better mimic the conditions of gas hydrate formation with pressurized gases.
From the experimental results obtained in this study, it seems possible to infer the following correlation between the morphology of the hydrate crystals observed at the w/o interface and the antiagglomeration performance: the systems that form a hydrate shell at the interface exhibit poor antiagglomeration performance, whereas those that form individual oil wettable crystals achieve good antiagglomeration performance. Consequently, microscopic observation of hydrate formation at a quiescent water/oil interface, and more particularly at a water/CP or water/(CP + oil) interface at atmospheric pressure, might be an appropriate solution for obtaining valuable indicators as regards the antiagglomeration capacities of a surfactant. The morphological similarities between the CP−hydrate and CH4/C3H8hydrate crystals in
addition to those observed for the antiagglomeration perform ance of DA 50 on both hydrate systems confirm that the CP hydrates are an interesting analog for sII gas hydrates when performing a quick evaluation of antiagglomeration surfactants.
■
ASSOCIATED CONTENT*
Supporting InformationThe Supporting Information is available free of charge on the
ACS Publications website at DOI: 10.1021/acs.energy
fuels.8b02980.
Representation of a Noramium DA 50 molecule; description of the study of the emulsion formation and stability in the presence of DA 50 with 0 and 4 wt % NaCl for a water:oil ratio of 30:70 (v:v%); table containing the stability and type of emulsions formed is also presented; experimental protocol used to measure the interfacial tension (IFT) between aqueous solutions (pure water and DA 50 solutions without and with NaCl) and n C8 in the presence of the CH4/C3H8gas mixture at 58 bar and
10 °C; table containing the measured IFT values; description of the CP−hydrate morphology and of the antiagglomeration performance of DA 50 evaluated in the agitated batch reactor in the presence of alkanes (n C8 or n C12); snapshots of the CP−hydrate growth at the water/(CP + n C8 or CP +n C12) interface and torque and temperature versus time during the formation of CP hydrates without surfactant with 1 wt % DA 50 and 0 or 4 wt % NaCl at a subcooling of 6°C; table summarizing the lateral growth v of the hydrates for these systems at a subcooling of 6 °C; figure showing snapshots of the system state in the batch reactor after a hydrate formation experiment without surfactant; figure comparing the torque (C) and temperature (T) versus time (t) of a formation experiment of CP hydrates without and with NaCl and 1 wt % DA 50 at a subcooling of 6°C repeated twice; figure showing C and T versus t during the formation of CP hydrates with 1 wt % DA 50 at a subcooling of 6°C for a final volume fraction of hydrates of 26% (PDF)
■
AUTHOR INFORMATIONCorresponding Author
*Phone: +33559407682. E mail: christophe.dicharry@univ pau.fr.
Effects of a Quaternary Ammonium Salt on the Growth,
Wettability, and Agglomeration of Structure II Hydrate
Crystals.
H. Delroisse
1, J.-P. Torré
1, C. Dicharry
1*1
CNRS/TOTAL/UNIV PAU & PAYS ADOUR/E2S UPPA, Laboratoire des Fluides Complexes et
leurs Réservoirs‐IPRA, UMR5150, 64000, PAU, France
* Corresponding author: [email protected]
SUPPORTING INFORMATION
Supporting Information A:
Figure S1. Structure of Noramium® DA 50 molecule.
Supporting Information B: Emulsion formation and stability. Because the systems studied –
composed of water (salted or not salted), oil (CP or n-C8) and a surfactant (DA 50) – are agitated
throughout the evaluation of the anti-agglomeration performance they form an emulsion. We determined
the type (water-in-oil (w/o) or oil-in-water (o/w)) of the emulsions formed and evaluated their stability,
as these properties are likely to have an impact on the anti-agglomeration performance observed
1–3. For
placed in test tubes with 28 cm
3of CP (or n-C8) at room temperature. Then, the tubes were vigorously
shaken by hand for a few seconds and separation of the emulsion was monitored for 180 min.
The
emulsion stability was determined by measuring the time needed to separate 60 vol% of the initial aqueous
phase. The emulsion type was determined by measuring the conductivity (σ) of the system under
mechanical agitation. For the system with pure water, 0.25 wt% of NaCl were added to the aqueous phase
in order to obtain distinct conductivity values for the aqueous and oil phases. If σ ~ 0, the oil phase was
the continuous phase and the emulsion was of the w/o type, and if σ >> 0, the aqueous phase was the
continuous phase and the emulsion was of the o/w type. The results are summarized in Table S1. The
emulsion type and stability were found to be unrelated to the oil (CP or n-C8) used.
Table S1. Stability and type of emulsions formed in the presence of 0 or 4 wt% NaCl and 1 wt% DA 50
for a water:oil ratio of 30:70 (v/v%).
NaCl
(wt%)
Emulsion type
Stability
a(min)
0
Oil-in-water
43 ± 2
4
Oil-in-water
8 ± 1
a
Time for separation of 60 vol% of the initial aqueous phase
Supporting Information C: The interfacial tension (IFT) between aqueous solutions (pure water and DA
50 solutions without and with NaCl) and n-C8 in the presence of the CH
4/C
3H
8gas mixture was measured
in a high-pressure cell with an internal volume of 6.4 cm
3. Except the high-pressure cell, the experimental
setup was the same as the one shown in Figure 2.
The experimental protocol used for the IFT measurements was as follows. The cell was cooled at 10°C
and then filled with 4 cm
3of n-C8. It was quickly loaded with the CH
4
/C
3H
8gas mixture at 72 ± 1 bar.
Because of the gas solubilization into the oil phase, the cell pressure decreased and then stabilized at 58
± 1 bar. The syringe pump was used to form and maintain a small water drop (of a few µL) at the tip of
the vertical capillary, which was immersed in the oil phase. The drop shape was analyzed with a computer
program that solves the Laplace equation describing mechanical equilibrium under capillary and gravity
forces and monitors variations in IFT over time.
To calculate the gravity force, the densities of the water and oil phases at the experiment temperature are
needed. The density of the aqueous solution (pure water or surfactant solution) was assumed the same as
pure water. The oil density was calculated using a pT-flash calculation.
The measured IFT at 58 bar and 10°C (i.e. at a subcooling of about 9°C) are given in Table S2. In the
presence of 1 wt% DA 50 (without and with NaCl) or of 0.1 wt% DA 50 with 4 wt% NaCl, the drop could
not be maintained at the tip of the capillary. This behavior indicates that the equilibrium IFT of these
systems was lower than the lowest IFT that can be measured with our apparatus (~ 1 mN/m). The IFT
values given in Table S2 show that in the presence of NaCl and DA 50, the IFT between water and n-C8
is drastically reduced. Delroisse et al. (2017) found similar effect of DA 50 and NaCl on the IFT between
water and cyclopentane.
4Table S2. Equilibrium interfacial tension (IFT) between water and n-C8 without DA 50, with 0.1 wt%
DA 50, and with 0.1 wt% DA 50 and 4 wt% NaCl.
System (water/n-C8)
IFT (mN/m)
Without DA 50
50 ± 2
0.1 wt% DA 50
9 ± 1
0.1 wt% DA 50, 4 wt% NaCl < 1
1 wt% DA 50
< 1
Supporting Information D:
CP-hydrate morphology in the presence of alkanes. The morphology of the CP hydrates without or
with 1 wt% DA 50 in the presence of 0 or 4 wt% NaCl was observed in presence of C8 or
CP/n-C12 mixtures, at a ratio of 50:50 (v/v%). The snapshots of the hydrates formed are shown in Figure S2.
Figure S2. Snapshots of the CP-hydrate growth at the water/CP/n-C8 or CP/n-C12 interface without
surfactant, with 1 wt% DA 50, and with 1 wt% DA 50 and 4 wt% NaCl at a subcooling of 6°C.
Without surfactant and without NaCl (Figures S2.1a and b) and with 1 wt% DA 50 (Figures S2.2a and b),
the water/oil interface was covered with plates of hydrates growing from the seeds added. A drop of the
aqueous solution deposited on the hydrate shell spread (black arrows in the snapshots in Figures S2.1 and
2), meaning the shell was water-wettable. Note that the hydrate shell formed in the systems with CP/n-C8
Oil phase
50/50 (v/v%)
CP/n-C8
50/50 (v/v%)
CP/n-C12
1- Without additive
(a)
(b)
2- 1 wt% DA 50
(a)
(b)
3- 1 wt% DA 50 and 4 wt%
NaCl
(a)
(b)
or CP/n-C12 grew 3 times more slowly than with pure CP (see Table S3). With (1 wt% DA 50 and 4 wt%
NaCl) and n-C8 or n-C12, pyramidal crystals slowly formed during the first hours after the seeding
(Figures S2.3a and b). They then agglomerated on the sides of the glass tube, and slowly formed a thick
hydrate shell at the interface. The hydrate shell was oil-wettable. Some pyramidal crystals, which
remained present throughout the experiment, can be seen in the snapshots in Figures S2.3a and b (black
arrows).
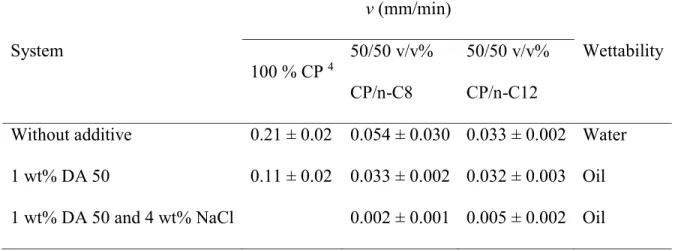
Table S3 Lateral growth rate (v) for the systems with an oil phase composed of CP or C8 or
CP/n-C12, without surfactant, with 1 wt% DA 50, and with 1 wt% DA 50 and 4 wt% NaCl, at a subcooling of
6°C.
System
v (mm/min)
Wettability
100 % CP
450/50 v/v%
CP/n-C8
50/50 v/v%
CP/n-C12
Without additive
0.21 ± 0.02 0.054 ± 0.030 0.033 ± 0.002 Water
1 wt% DA 50
0.11 ± 0.02
0.033 ± 0.002 0.032 ± 0.003 Oil
1 wt% DA 50 and 4 wt% NaCl
0.002 ± 0.001 0.005 ± 0.002 Oil
Anti-agglomeration performance of DA 50 evaluated in the agitated batch reactor in the presence
of n-C8 or n-C12. Figure S3 shows the variation in the torque (C) and temperature (T) versus time (t) for
the system water/CP/n-C8 or n-C12 without additives or with 1 wt% DA 50 and 0 or 4 wt% NaCl. Without
DA 50 or NaCl (Figure S3.1), the hydrate formation process caused a first increase in the torque signal
up to 0.16 N.m, then a second increase up to 0.7 N.m (maximum torque value). The reactor was opened
when the hydrates had finished forming, and we observed that the system was composed of a hydrate plug
filling the entire reactor and no liquid phase.
System
Oil phase
CP/n-C8
CP/n-C12
1- without
additive
(a)
(b)
2- 1 wt% DA
50
(a)
(b)
3- 1 wt% DA
50 and 4 wt%
NaCl
(a)
(b)
Figure S3. Torque (C) ( ) and temperature (T) ( ) versus time (t) during the formation of CP hydrates
without surfactant (1) or with 1 wt% DA 50 (2), or with 1 wt% DA 50 and 4 wt% NaCl (3) with CP/n-C8
(a) or CP/n-C12 (b) as the oil phase at a subcooling of 6°C.
-5 0 5 10 15 20 0 0.1 0.2 0.3 0.4 0.5 0.6 0.7 0 200 400 600 T ( °C) C ( N. m ) t (min) -5 0 5 10 15 20 0 0.05 0.1 0.15 0.2 0 200 T ( °C) C ( N. m ) t (min) 0 5 10 15 20 0 0.05 0.1 0.15 0 200 400 T ( °C) C ( N. m ) t (min) -5 0 5 10 15 20 0 0.05 0.1 0.15 0 200 400 T ( °C) C ( N. m ) t (min) -5 0 5 10 15 20 0 0.05 0.1 0.15 0 200 400 600 800 T ( °C) C ( N. m ) t (min) -5 0 5 10 15 20 0 0.05 0.1 0.15 0 200 400 600 T ( °C) C ( N. m ) t (min)
With DA 50 (Figure S3.2), the torque increased with the hydrate growth up to 0.12 N.m before dropping
to the baseline. The reactor was first opened when the torque signal increased (~0.08 N.m). The system
was composed of a jelly-like material. After the drop in torque, the reactor was opened a second time.
The system was composed of hydrates agglomerated on the agitator and the walls of the reactor. Note that
the hydrate formation was slower than for the system with pure CP and the temperature peak caused by
the hydrate formation was lower. The slower hydrate formation kinetics are consistent with the slower
lateral hydrate growth rates measured in the morphology experiments at the water/oil interface. With 1
wt% DA 50 and 4 wt% NaCl (Figure S3.3), the hydrates grew very slowly causing a slight increase in the
torque (from 0.025 to 0.035 N.m). At the end of the experiment, we opened the reactor and saw that the
system was composed of a mixture of emulsion and hydrate particles. The conversion could not be
determined (no supernatant oil phase recoverable at the end of the experiments) for any systems, but the
water-to-hydrate conversion seemed to be incomplete.
Supporting Information E:
Supporting Information F:
Figure S5. Torque (C) and temperature (T) versus time (t) during the formation of CP hydrates with 1
wt% DA 50, without (a) or with NaCl (b), at a subcooling of 6°C. Each experiment was repeated twice.
t = 0 corresponds to the seeding of the system.
Supporting Information G:
Figure S6. Torque (C) and temperature (T) as a function of time (t) throughout the formation of CP
hydrates with 1 wt% DA 50 at a subcooling of 6°C. The final volume fraction of hydrate is 26 %.
0 5 10 15 20 0 0.05 0.1 0.15 0.2 0.25 0 100 200 300 400 T ( °C) C ( N .m ) t (min) Torque 1 Torque 2 Temperature 1 Temperature 2 (a) -5 0 5 10 15 0 0.05 0.1 0.15 0.2 0 100 200 300 400 T ( °C) C ( N .m ) t (min) Torque 1 Torque 2 Temperature 1 Temperature 2 (b) 0 5 10 15 20 0 0.025 0.05 0.075 0.1 0 100 200 T ( °C) C ( N .m ) t (min)