To cite this version
: Naillon, Antoine and Joseph, Pierre and Prat, Marc
Sodium chloride precipitation reaction coefficient from crystallization
experiment in a microfluidic device. (2017) Journal of Crystal Growth, vol. 463.
pp. 201-210. ISSN 0022-0248
O
pen
A
rchive
T
OULOUSE
A
rchive
O
uverte (
OATAO
)
OATAO is an open access repository that collects the work of Toulouse researchers and
makes it freely available over the web where possible.
This is an author-deposited version published in :
http://oatao.univ-toulouse.fr/
Eprints ID : 19953
To link to this article
: DOI: 10.1016/j.jcrysgro.2017.01.058
URL :
https://dx.doi.org/10.1016/j.jcrysgro.2017.01.058
Any correspondence concerning this service should be sent to the repository
administrator:
[email protected]
Sodium chloride precipitation reaction coefficient from crystallization
experiment in a microfluidic device
A. Naillon
a,b, P. Joseph
b, M. Prat
a,⇑aInstitut de Mécanique des Fluides de Toulouse (IMFT) – Université de Toulouse, CNRS-INPT-UPS, Toulouse, France bLAAS-CNRS, Université de Toulouse, CNRS, Toulouse, France
a b s t r a c t
The crystal growth of sodium chloride from an aqueous solution is studied from evaporation experiments in microfluidic channels in conjunction with analytical and numerical computations. The crystal growth kinetics is recorded using a high speed camera in order to determine the intrinsic precipitation reaction coefficient. The study reveals that the crystal growth rates determined in previous studies are all affected by the ions transport phenomena in the solution and thus not representative of the precipitation reaction. It is suggested that accurate estimate of sodium chloride precipitation reaction coefficient presented here offers new opportunities for a better understanding of important issues involved in the damages of por-ous materials induced by the salt crystallization.
1. Introduction
The crystallization of sodium chloride from an aqueous solution is a key phenomenon in relation with evaporation from porous media[1], the generation of damages in buildings and monuments
[2], or the injection of CO2in underground formations[3], to name
only a few. The crystallization process is generally decomposed into two main steps: the nucleation step and the growth step. In this respect, it is important to distinguish the crystal growth kinet-ics[4]from the nucleation kinetics, which involves the induction time between the application of a supersaturation state and the appearance of the first crystals[5]. In the literature, they can both be found under the expression of ‘‘crystallization kinetics”. In this paper, we focus on the crystal growth kinetics.
The crystal growth is studied within the framework of the diffu-sion reaction theory[6](where other crystal growth theories: sur-face energy theory, adsorption layer theory and kinematic theory, are also presented). Crystal growth starts only once a stable nucleus, large enough to be stable, appears in the metastable solu-tion. It relies on two coupled steps: an ion diffusion process from the solution to the crystal surface, followed by a reaction process where ions fit in the crystal lattice. These processes have been highlighted in Refs.[7,8].
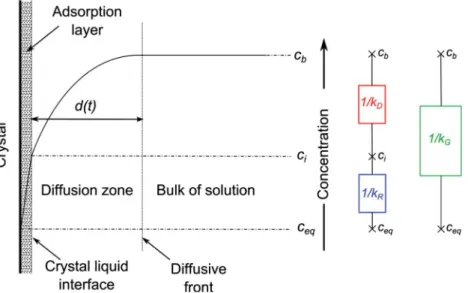
As illustrated inFig. 1, the two steps occur in series and three zones can be defined. The first zone corresponds to a stagnant film (or adsorption layer) at the crystal-liquid interface. Far from the crystal, there is the bulk solution with a constant concentration. The concentration increases following a diffusion law in the inter-mediate zone of size d between the crystal and the bulk.
The crystal growth rate, J (kg/m2
!s) in the adsorption zone and diffusion zone can be modelled as:
JD¼ 1 A dM dt ¼kDðcb$ ciÞ; ð1Þ JR¼ 1 A dM dt ¼kRðci$ ceqÞ n ; ð2Þ
where M (kg) is the mass of the crystal, A is the crystal total surface, cb(kg/m3) is the bulk salt concentration of the solution, ciis the salt
concentration at the liquid crystal interface, and ceqis the ion
con-centration at equilibrium; n is the order of the reaction and kDand
kR(m/s) are the coefficients of mass transfer by diffusion and
reac-tion, respectively. kDcan be seen as the ratio of the salt molecular
diffusion coefficient Dsto the diffusion length d.
Considering the diffusion zone and the adsorption layer as two mass transfer resistances in series (as sketched inFig. 1) and for a first order reaction (n = 1, which is the case for sodium chloride), an equation combining these two steps can be obtained,
JG¼
1 A
dM
dt ¼kGðcb$ ceqÞ ð3Þ
⇑ Corresponding author at: IMFT (Institut de Mécanique des Fluides de Toulouse), Allée Camille Soula, F-31400 Toulouse, France.
with kG¼ 1 1 kDþ 1 kR ¼kkDkR Dþ kR; ð4Þ
where kGis referred to as the overall growth rate parameter. The
equivalent of the mass transfer resistance is equal to the inverse of the growth rate parameter. In order to characterize the phe-nomenon driving the crystallization process, Garside[9]suggests to define the effectiveness factor for crystal growth
g
ras the ratiobetween the overall growth rate and the growth rate obtained when the crystal surface is exposed to the bulk concentration:
g
r¼JG
kRðcb$ ceqÞ ð5Þ
In other words, it is the ratio between the overall growth rate and the growth rate obtained when the crystallization is limited only by reaction, with an infinitely fast diffusion;
g
rcan be expressed as:g
r¼ ð1 $ Dag
rÞ ð6Þwhere Da ¼kR
kD, is the Damkhöler number, which represents the ratio
between the reaction flux and the mass transport flux. Thus
g
r¼1
1 þ Da: ð7Þ
Therefore, the process is controlled by diffusion when Da is large and
g
ris low. On the contrary, it is controlled by reaction (thecon-trolling process is the slowest one) when Da is small and
g
ris large.Moreover, because NaCl crystal has a cubic shape, the mass precip-itation rate can be related to the mean linear velocity of its faces wcr
(m/s) by (seeAppendix A): wcr¼ dr dt ¼ JG
q
c¼ kGq
cðc b$ ceqÞ ð8Þwhere r is the half length of the side of a cubic crystal (m) and
q
cisthe crystal density (kg/m3). In case of a spherical crystal or a growth
in 1 dimension on both sides, Eq.(8)remains valid with r as the sphere radius or the crystal half length.
The above considerations clearly show that the crystal growth kinetics depends on both the local concentration ciat the interface
and coefficients kDand kR. The experiments typically allow
deter-mining wcr (references are given below in the section on the
results). Since both ciand kRare unknowns, it is clearly difficult
to determine kR from the experimental data. Also, as stated in
[9], kRis difficult to measure because it is hard to separate the
reac-tion step from the diffusion one. In this context, the main objective of the paper is precisely to provide an accurate estimate of kR.
It should be mentioned that correct values of kRare of the
utter-most importance for correctly evaluating the crystallization pres-sure, which is the key concept in relation with the damages caused by the salt crystallization in porous materials [10]. As explained in[11], what matters for evaluating the crystallization pressure is the salt concentration at the crystal surface when it becomes confined between the pore walls. This concentration is highly dependent on kR(see[11]for more details).
2. Materials and methods 2.1. Experiments
Experiments are performed in microfluidic chips such as the one sketched inFig. 2. It is composed of a large channel used for supplying the fluids: salt solution or gaseous nitrogen. Holes are drilled at both extremities to connect the chip to the external part of the experimental set-up. Channels of smaller cross section sur-face areas, referred to as pore channels, are designed perpendicu-larly to the supply channel. Two pore channel cross sections are used in order to study its influence on crystal shape: 5 ' 5
l
m2and 20 ' 20
l
m2. For each cross section, three lengths are testedso as to consider different initial amounts of dissolved salt: 100
l
m, 200l
m, 300l
m and 200l
m, 400l
m, 800l
mrespectively.
The chips are made of polydimethylsiloxane (PDMS) and glass. First, a mold is fabricated in a clean room by standard photolithog-raphy using, however, a DF-1000 series dry film instead of a liquid photoresist as SU-8. Then, PDMS Sylgard 184 with a ratio of curing agent 1:10 is degassed under vacuum during 45 min, poured on the mold and cured at 80 !C during 2 h. It is unmolded after at least 20 min of cooling at ambient temperature. After unmolding, holes are made with bio punch and the chips are cut with a scalpel. Then a cover glass is bonded on the channel side thanks to smooth air plasma during 1 min and 30 s. Finally, a second baking at 70 !C during 30 min is done to ensure a good adhesion between glass and PDMS.
Fig. 1. Modelling of crystal growth according to the reaction and diffusion theory. Three zones are defined depending on the evolution of the solute concentration: the stagnant film at the crystal/liquid interface, the bulk solution with a constant concentration far from the crystal, and in between, the diffusion zone of size d(t) where the concentration increases following a diffusion law. Adsorption layer and diffusion zone can be considered as two mass transfer resistances in series.
The experiments are performed at room temperature (between 22 and 24 !C) on an inverted microscope Zeiss Axio observer D1 working in transmission. The protocol is the following: capillary tubes (PTFE, 1/16 in. ' 0.8 mm) link the chip to a pressure con-troller (Fluigent MFCS) managed by computer. One tube passes through a salt solution tank and the other not. The chip is filled from the top hole by salt solution with a known initial concentra-tion. Once the pore channels are filled, nitrogen is injected in the large channel from the bottom hole to push the solution out of this channel, leaving the pore channels filled. The gas flow is main-tained during all the experiment to evaporate the salt solution in the pore channels (RH = 0%).
Salt crystals form within the pore channels after evaporation of a sufficient amount of water for the ion concentration marking the onset of crystallization to be reached. Two video cameras are used: an Andor Zyla SCMos to record the kinetics of evaporation, with a low frame rate (between 1 and 2 s per image) and a large field, and a Photron Fastcam SA3 camera to record the kinetics of crystal growth at 500 or 1000 frames per second.
In order to perform the experiments with different amounts of dissolved salt in excess at nucleation, sodium chloride solution is prepared with two different molalities: 1.89 and 4.25 mol/kg, the saturation being 6.15 mol/kg (corresponding to mass fractions of 10%, 20% and 26.4% respectively). Salt is provided by Sigma Aldrich, with a purity ensured to be higher than 99.5%. It is dissolved in deionized water.
Movies are exploiting thanks to the ImageJ" and Matlab" soft-wares to track the crystal liquid interface so as to determine the kinetics of crystal growth.
More details on the experimental setup are given inAppendix C.
2.2. Numerical simulations
A numerical model is developed and solved using the commer-cial software Comsol multiphysics 5.2" in order to analyze the experimental results. We focus on the beginning of the crystalliza-tion process over a very short period during which evaporacrystalliza-tion is negligible. Thus, this model is used to simulate the crystal growth of an initial nucleus in a solution when the crystal size is small compared to the size of the computational domain (seeFig. 3). For this reason, the problem is actually equivalent to the growth
in an ‘‘infinite” domain. This means that the numerical domain is sufficiently large for the diffusive front of the dissolved salt con-centration not to reach the domain boundary.
At initial time, the solution is supersaturated and a small nucleus is in the solution. Initial supersaturation S0 (see below
for a definition) is set to the mean experimental value (S = 1.72, see below). We checked that the specified initial size of nucleus has not influence on final result. The transport of dissolved salt by diffusion and convection is taken into account as well as the crystal growth due to the precipitation reaction. The coefficient of mass transfer by reaction kR is varied between 10$2 and
10$4m/s so as to study its influence. The ion molecular diffusion
coefficient Dsis taken equal to 1.3 ' 10$9m2/s.
Technical details and equations are presented inAppendix D.
3. Results
3.1. Supersaturation at nucleation
The supersaturation of the solution is defined as
S ¼ m=m0 ð9Þ
where m (mol/kg) is the molality and subscript0refers to the
refer-ence state where the crystal is in equilibrium with the solution. As recalled inAppendix E, the molality can be determined from the solution concentration. A simple method to determine the salt con-centration is to track the position of the receding meniscus in the pore channel at the onset of crystallization and to perform a simple mass balance. Knowing the initial volume V0of the salt solution of
concentration c0, the average concentration when the first crystal is
detected on the images (nucleation), cn, is given by: cn¼ ccr¼
V0
Vn
c0; ð10Þ
where Vnis the volume of solution in the channel when the first
crystal is detected on the images since the total amount of salt remains constant (only pure water evaporates).
An implicit hypothesis when using Eq.(10)is that the concen-tration is about the same everywhere in the solution. To validate this assumption, it is possible to define a Peclet number by the
Fig. 2. Scheme of the PDMS and glass microfluidic chip. The channels are casted on a mold fabricated with laminated photosensitive dry films (DF-series 1000), structured by photolithography. The crystallization is observed in the pore channels. First, salt solution is injected from the top hole through the supply channel and invades the pore channel. Once the device is filled, a N2flux is imposed from the bottom hole to empty the supply channel and isolate salt solution in the pore channel. This flux is maintained
ratio between the ions production rate at the receding meniscus and the diffusion rate[12]:
Pe ¼
dzm dt H
Ds
; ð11Þ
zmrepresents the position of the meniscus (distance to the channel
entrance) and H is the length of the liquid part (see Fig. 2). The assumption of uniform concentration is valid only if the Pe number is much lower than 1 (low evaporation rate in comparison with the diffusion velocity), which is always the case in our experiment. Using Eq.(11)leads to Pe = 0.08 ± 0.07 taking into account all the experiments, indicating that assuming the concentration as uniform is reasonable.
The value of supersaturation is measured in 99 experiments (Fig. 4). The mean value is found to be equal to S = 1.72, which is consistent with previous studies [12–13]. No dependence with pore channel length, depth or initial concentration is noticed. 3.2. Crystallization kinetics
The crystallization kinetics is recorded over very short periods (between 0.1 and 2 s) at 1000 frames per second. Pictures from three experiments of crystal growth are shown in Fig. 5a. The kinetics of crystal growth is extracted by tracking the liquid crystal interface in the main growth direction (black line inFig. 5a). Note that the crystallization kinetics is studied from the images obtained using the high speed camera. The latter has a much smal-ler field of view compared to the low frame rate camera. As result, this is not 99 experiments as for the supersaturation study but only 10 which have been considered for studying the kinetics.
As illustrated inFig. 5b, two steps in the crystal growth can be distinguished: a very fast one over a period of about 10–100 ms, with a quasi-constant kinetics (the crystal surface moves linearly), and a second one characterized by a decreasing kinetics (the liquid-crystal interface slows down).
The shape of the crystal depends on the channel size and on the location of the nucleation. When the crystal appears far from the liquid air interface, a ‘‘cubic” crystal is observed in the 5 ' 5
l
m2channel (Fig. 5a, ‘‘Crystal growth 1”) whereas a ‘‘star” crystal is observed in the 20 ' 20
l
m2channel (Fig. 5a, ‘‘Crystal growth 3”).The latter can be referred to as a Hopper crystal[13]. When the crystal appears on the liquid gas interface, it is directly confined between the channel wall and the liquid-gas interface (Fig. 5a, ‘‘Crystal growth 2”). These cases are discarded to determine the kinetics of growth because we assume that it is influenced by the geometrical confinement. In other terms, we consider that the transport of ions in the wedge formed by the liquid-air interface and the channel wall is different from the situation considered in the theoretical and numerical approaches (see Sections2.2 and 4) where the crystal grows in the middle of a solution.
It appears that the crystal growth is very fast at the onset of crystallization, much faster than the fastest kinetics reported in previous studies. For example, a liquid-crystal interface velocity dr/dt of around 10
l
m/s is reported in[16]. However, the lowcam-era rate acquisition (0.5 frames per second) used in[16]does not allow to measure the beginning of the growth. Here, thanks to the high speed camera, we can focus on the first milliseconds when the kinetics of crystal growth is constant. The crystal growth veloc-ity dr/dt is estimated after 10 ms for all the experiments, when the crystal has still a compact shape. This leads to a mean value equal to dr/dt = 271 ± 62
l
m/s (the mean value and its standarddevia-tion are calculated considering the 10 experiments and the growth on each side of crystal). It is convenient to express the growth kinetics in term of the overall growth parameter kG in order to
compare our data with values from previous experiments. kG is
computed using Eq.(8)with cbcorresponding to the concentration
at the onset of crystallization. This gives kG= 2.33 ' 103± 0.1
-' 103
l
m/s.4. Discussion
As mentioned before, the crystal growth kinetics observed in our experiments is much faster than in previous experiments. In order to compare with our values, we have extracted the kinetics of sodium chloride crystal growth from different previous papers.
Fig. 4. Histogram of supersaturation values at nucleation for the 99 experiments. Two values are non-consistent because they are lower than 1. In the two corresponding experiments, liquid films seem to be trapped in front of the receding meniscus and nucleation occurs in the films. The assumption of uniform concen-tration through the solution is not valid in this case. As shown in[14]and also discussed in[15], evaporation takes place at the film tips and the convective flux within the film is not negligible. Our definition of Peclet number is then non valid anymore. Taking out these 2 values, the mean supersaturation is equal to S = 1.72. Fig. 3. Sketch of the numerical simulation: a spherical crystal grows in a supersaturated solution in a domain of ‘‘infinite” size (only a little part of the domain is shown here).
The kinetics is expressed in term of kG, thanks to Eq.(8). Values are
presented inTable 1(the determination of kGfor each reference is
presented inAppendix F).
The time of measurement corresponds to the time tmused to
calculate the velocity experimentally, i.e. from Eq.(8)
wcr¼ dr dt ( rðtmÞ $ rð0Þ tm ¼ kG
q
cðc b$ ceqÞ ð12ÞAs can be seen fromTable 1, the value of kG= 2.33 mm/s after 10 ms
from our experiments is 20–500 times higher than the values extracted from the literature.Table 1makes clear that the overall growth rate parameter depends on the duration of the experiment. In particular, the lower the time of velocity integration, the higher the growth rate parameter. We can explain this result with the vari-ation of the coefficient of mass transfer by diffusion, kD, with time.
According to the diffusion reaction theory, the coefficient of mass
Fig. 5. (a) Pictures of crystal growth in pore channels. The black lines show the direction along which the kinetics of crystal growth is measured. Red scale bar represents 10lm; Time is in millisecond; (b) and (c) represent the kinetics of crystal growth corresponding to 1 and 3 of (a) respectively. The position of liquid crystal interface as a
function of time is shown in blue in the right direction and in red in the left direction. The insert in (b) focuses on the first 100 ms. In (c), the kinetics of growth is not extracted after 100 ms because the crystal rotates in the channel. (For interpretation of the references to color in this figure legend, the reader is referred to the web version of this article.)
transfer by reaction, kR, is an intrinsic property of the crystal
whereas kD depends on a diffusive length which evolves in time.
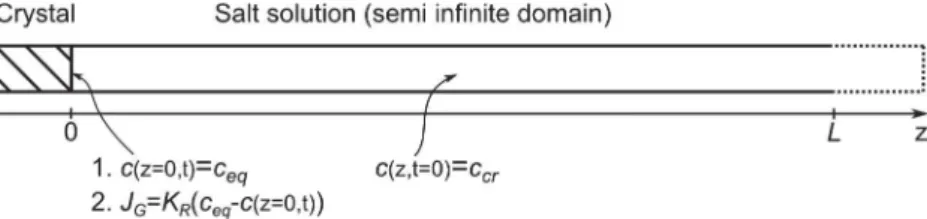
This can be illustrated from a simple model of the crystal growth in one dimension controlled only by diffusion, i.e. assuming a very large kR. The corresponding problem with boundary condition 1 is
sketched inFig. 6.
In this model, the convection induced by the crystal liquid interface motion is not taken into account. The solution for a semi-infinite domain is used because of its simplicity in compar-ison to the case of a finite domain. This approximation is correct if the diffusive front which starts from the crystal has not the time to reach the other boundary (end of pore channels in our experi-ments). In other words, the two solutions are equivalent for times much lower than the diffusive time, tD= L2/Ds, where L is the length
of the considered finite domain (for instance, if L = 1 mm, tD= 769 s). The solution to this problem is given in[19]:
cðz; tÞ $ ceq ccr$ ceq ¼ erf z 2 ffiffiffiffiffiffiffiD st p " # ð13Þ
where ccr= cn= cbis the ion concentration at the onset of
crystalliza-tion (thus corresponding to the supersaturacrystalliza-tion). From Eq.(13)we can express the velocity of crystal growth controlled only by diffu-sion as: wcr;D¼ dr dt ¼ Ds
q
cr @c @z " # z¼0¼ ðccr$ ceqÞq
cr ffiffiffiffiffiffi Dsp
t r ð14ÞThe mean velocity of crystal growth between nucleation (t = 0) and a time tmis then obtained integrating Eq.(14)over the duration tm:
wcr;D;mean¼rðtmÞ tm ¼ 2ðccr$ ceqÞ
q
cr ffiffiffiffiffiffiffiffiffi Dsp
tm s ð15ÞCombining Eqs.(15) and (8)leads to the following theoretical evo-lution of kGas a function of measurement time tm:
kG¼ kD¼ 2
ffiffiffiffiffiffiffiffiffiffiffiffiffiffiffiffi Ds=
p
tmp
ð16Þ
This law is plotted inFig. 7together with the values of kGreported
inTable 1. As can be seen fromFig. 7, the value of kGfound in the
literature varies as t$0.494, which is very close to the theoretical
pre-diction tm$0.5. This is a first indication that the crystal growth in the
aforementioned experiments is controlled by diffusion.
Proceeding similarly, it is interesting to take into account the reaction step. The crystal growth in one dimension controlled by diffusion and reaction is modelled as sketched inFig. 6. This means using boundary condition 2 (Fig. 6). The solution of this problem is again given in[19]: cðz; tÞ $ ccr ceq$ ccr ¼ erfc z 2 ffiffiffiffiffiffiffi Dst p " # $ expðHz þ h2DstÞerfc z 2 ffiffiffiffiffiffiffiD st p þ h ffiffiffiffiffiffiffi Dst p ' ( ð17Þ
where h = kR/Ds. The velocity of crystal growth controlled by
diffu-sion and reaction and its average value are given by: wcr;RD¼ dr dt ¼ Ds
q
cr @c @z " # z¼0¼ k Rðccr$ ceqÞq
cr expðh2DstÞerfcðh ffiffiffiffiffiffiffi Dst p Þ ð18Þ wcr;RD;mean¼ðccrq
$ ceqÞ cr expðh2D stmÞerfcðh ffiffiffiffiffiffiffiffiffiffi Dstm p Þ htm $ 1 htmþ 2 ffiffiffiffiffiffiffiffiffi Dsp
tm s " # ð19Þ Combining Eqs. (8) and (19), the theoretical evolution of kGas afunction of measurement time can be expressed as
kG¼ expðh 2 DstmÞerfcðhpffiffiffiffiffiffiffiffiffiffiDstmÞ htm $ 1 htmþ 2 ffiffiffiffiffiffiffiffiffi Ds
p
tm s ! ð20ÞThis law is plotted in blue dotted line for different values of kRin
Fig. 7. As can be seen, the kinetics of crystal growth follows the dif-fusive law for a measurement time of 10 ms only if the coefficient of mass transfer by reaction is bigger than 10$3m/s.
Since Eq.(20)gives the solution in 1D using a linear Cartesian coordinate and for a fixed crystal – solution interface, numerical simulations are performed to extract the kinetics of growth for dif-ferent values of kR= 10$4, 10$3and 10$2m/s for conditions closer
to the experimental situation (moving crystal – solution interface in a 3D domain). The numerical results for kGare compared with
the experimental and theoretical ones in Fig. 7. As can be seen,
Fig. 7 shows a very good agreement between the experimental and the numerical results. The difference with the theoretical val-ues from the 1D solution is about of a factor 4, which can be explained by the fact that the numerical simulations (and the experiments) correspond to a growth in a 3D domain whereas the theoretical solution is developed only in 1 dimension. In addi-tion, the theoretical solution does not take into account the motion of the crystal solution interface.
Therefore, the conclusion is that the crystal growth is only con-trolled by diffusion in all of the mentioned papers. Thus kG= kDin
those experiments and the data are not sufficient to extract kR.
Consequently, Da is large and
g
ris low in all these experiments.Concerning the dependence of kGon kR, the numerical
simula-tion confirms that the crystal growth is limited by diffusion after 10 ms only if the parameter of crystal growth by reaction kRis
lar-ger than 10$3m/s. This result allows us to propose as a lower
bound kR= 2.3 ' 10$3m/s, which is the kinetics we measure as
reported in Section4.
5. Summary and conclusions
In this study, we present a microfluidic device allowing the accurate observation of sodium chloride crystal growth from a supersaturated solution. A frequency of acquisition as high as 1000 Hz is employed. This gives the possibility of studying the crystal growth in the regime controlled by the reaction. To the best of our knowledge, it is the first time that the kinetics of crystal growth is measured in the early stage of the growth where the growth is not controlled only by the ion transport phenomena toward the crystal but also by the precipitation reaction. This enables us to propose a new order of magnitude for the coefficient of mass transfer by reaction: kR> 2.3 ' 10$3m/s, ten to hundred
times higher than the values used in literature. The comparison with analytical and numerical simulation results highlight that the difference comes from the averaging time of measurement. When it is too long, the crystal growth is controlled by diffusion and not by reaction and the value of the reaction coefficient kR
can-not be deduced from the experimental data.
Similar experiments could be performed with other salts so to make a new data bank of the coefficient of mass transfer by reaction. To mention only one application, correct values of kR
Table 1
Values of the overall growth parameter kGof sodium chloride found in the literature,
and comparison with this study. The time of measurement corresponds to the time at which the mean experimental growth velocity is measured. It is difficult to define this time for ref[17]. It is clear that the lower the time of measurement, the higher the overall growth parameter. Determination of kGfor each reference is presented in
Appendix F.
Ref. Sursaturation – S kG(lm/s) Time of
measurement [17] 1.011–1.044 11.77 ± 1.1 n [12] 1.62 10.3 5 min [18] 1.93–1.98 23.4 ± 2.7 20 s [16] 1.3 126 2 s This study 1.476–2.118 2.33 ' 103± 0.1 ' 103 10 ms
are crucial for determining the crystallization pressure responsible of the generation of damages due to crystallization in porous mate-rials. Accordingly, the variability of kRwith the salt nature could
contribute to explain why some salts cause more damages than others.
Finally, the study illustrates one more time the effectiveness of microfluidic devices for characterizing chemical or physical properties.
Acknowledgements
Financial supports from ANDRA, INSIS-CNRS and CNRS NEEDS-MIPOR program are gratefully acknowledged. This work was partly supported by LAAS-CNRS micro and nano technologies platform member of the French RENATECH network.
Appendix A. Relation between the overall crystal growth rate JG
and the mean linear velocity of its faces wcr(m/s)
Considering a sodium chloride cubic crystal and taking r, the half length of its side as the reference length, the mass variation of the crystal can be expressed as:
dM dt ¼
q
cr dV dt ¼q
cr dð2rÞ3 dt ¼q
cr6ð2rÞ 2dr dt ¼q
crAcr dr dt; ðA1Þwhere Acris the surface of the crystal. Combined with Eq.(3), we
obtain the relationship (Eq.(8)in the text):
wcr¼ dr dt ¼ JG
q
cr¼ kGq
crðc b$ ceqÞ; ðA2ÞAppendix B. Relation between volume ratio and concentration The salt mass conservation during evaporation implies:
cnVn¼ V0c0; ðB1Þ
Index n, refers to the time of nucleation and0the initial time. It
gives:
xs;n
q
l;n¼V0
Vn
xs;0
q
l;0: ðB2ÞUsing the relation between salt mass fraction and salt solution den-sity given in[15]:
q
l¼1$0:7xqw s, we find: xs;nq
w 1 $ 0:7xs;n¼ V0 Vn xs;0q
w 1 $ 0:7xs;0: ðB3ÞAs a result, it is obtained that:
xs;n¼ xs;0 Vn V0þ 0:7xs;0 1 $ Vn V0 , - ; ðB4Þ
Appendix C. Fabrication of experimental devices
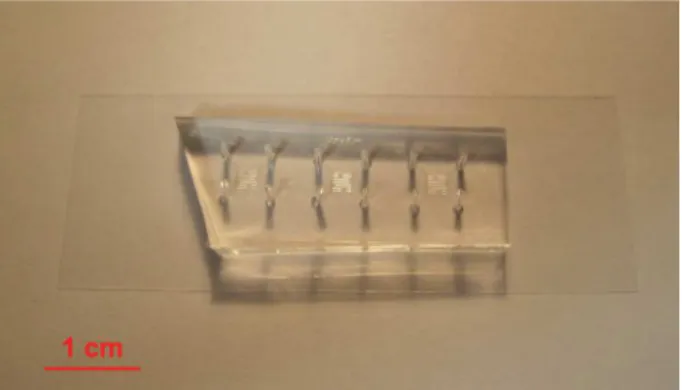
As sketched inFig. 1, experiments are performed on a microflu-idic chip made of glass and PDMS. A picture of a chip is presented inFig. C1.
C.1. Mold fabrication
Molds are made for channel of 5 ' 5
l
m2cross section withDF-1005 and for channel of 20 ' 20
l
m2cross section with DF-1020respectively. They are made in a clean room by standard pho-tolithography, excepted that photoresist is a dry film DF-1000 ser-ies. The silicon wafer surface is first cleaned and activated in an O2
plasma (Tepla 300) during 5 min with a power of 400 W and under a pressure equal to 1.5 mbar.
Then, the dry films are laminated with laminator Shipley 3024 under a pressure of 2.5 bar, a temperature of 100 !C and with a velocity of 0.5 m/min.
DF-1005 and DF-1020 are exposed to an energy density equal to 160 mJ/cm2and 200 mJ/cm2respectively through a quartz mask.
After exposure, the wafer is baked at 100 !C during 3 or 5 min and developed in a solution of cyclohexanone during 3 or 4 min. A hard bake is performed at the end at 125 !C during 2 min.
To avoid the PDMS adhesion on the mold during the casting and curing steps, the mold is rendered hydrophobic. It is immersed in a bath of 50 ml of xylene and 0.5 ml of OTS (using this solution under a nitrogen inert atmosphere is better to avoid the OTS oxidation). C.2. Fabrication of PDMS chip
PDMS Sylgard 184 with a ratio of curing agent 1:10 is degassed under vacuum during 45 min, poured on the mold and cured at 80 !C during 2 h. It is unmolded after at least 20 min of cooling at ambient temperature.
Fig. 7. Variation of the overall coefficient of crystal growth depending on the duration of growth. The blue dotted lines correspond to the theoretical variation of kGfor different kR(see text). The blue solid line is the theoretical value assuming an
infinite value for kR, thus kG= kD. The red circles correspond to values of kGfound in
literature. The dashed lines are numerical computation results for different values of kR. The solid red line corresponds to a power law fit of literature points. The green
square corresponds to our experimental points after 10 ms. (For interpretation of the references to color in this figure legend, the reader is referred to the web version of this article.)
Fig. 6. Sketch of the crystal growth model in 1 dimension. At initial time, the salt concentration is uniform in the solution. Two different cases are modelled depending on the boundary condition at the crystal solution interface. Case 1: fixed concentration at the interface equal to the equilibrium concentration, which corresponds to the case where kRtends to infinity. Case 2: fixed resistance to mass transfer by reaction; ccris the ion concentration at the onset of crystallization (supersaturation).
After unmolding, holes are made with bio punch of 1 mm diam-eter and the chips are cut with a scalpel.
Then a 125
l
m thick cover glass is bonded on the channel sidethanks to smooth air plasma (Diener Pico) during 1 min and 30 s under a pressure of 0.4 mbar and with a power of 200 W.
Finally, a second baking at 70 !C during 30 min is done to ensure a good adhesion between glass and PDMS.
Appendix D. Numerical models
The numerical simulations are performed with Comsol Multi-physics 5.2", a commercial software based on the finite element method. The crystal shape is spherical. In an infinite domain, this leads to consider a 1D problem using spherical coordinates. At ini-tial time, the solution is supersaturated and a small nucleus is in the solution. It is checked after the simulation that initial size of nucleus has not influence on final result.
Before describing the mathematical model, it is useful to define some terms. Indeed, considering the salt solution (subscriptl) as a
binary mixture composed of dissolved salt (subscripts) and water
(subscriptw), and considering that the crystal (subscriptcr)
inter-face moves at the velocity wcr, we can define:
+ In term of species concentration:
- ci(kg!m$3): mass concentration of specie i: ci¼MVli;
-
q
l(kg!m$3): solution density:q
l¼ csþ cw;- xi:mass fraction of specie i: xi¼qci
l;
-
q
cr(kg!m$3): crystal density;+ In term of species transport in the solution:
-
v
i(m!s$1): velocity of specie i. Note that each species has adifferent velocity in the mixture;
-
v
l(m!s$1): velocity of the mixture:v
l¼csvsþcwvwql ;
- Ji (kg!m$2!s$1): mass flux of specie i in the fixed frame:
Ji¼ ci
v
i;- ji(kg!m$2!s$1): relative mass flux of specie i in the relative
frame moving at velocity
v
l: ji¼ ciðv
i$v
lÞ;+ In term of flux through a moving interface: - wj(m!s$1): velocity of interface j.
- /i (kg!m$2!s$1): mass flux of specie i through the moving
interface j: /i¼ cið
v
i$ wjÞ;The problem is modelled mathematically as follows. The continuity equation for the mixture, the momentum equation and the species continuity (NaCl) equation are expressed as:
@
q
l @t þr
:q
lv
l¼ 0 ðD1Þq
l @v
l @t þv
lr
:v
l ' ( ¼ $r
Plþl
lr
2v
l ðD2Þ @q
lxs @t þr
:ðq
lxsv
lÞ ¼r
:ðq
lDsr
xsÞ ðD3ÞEq.(D3)is written considering that the salt flux is composed of a convective contribution and a diffusive one:
Js¼ cs
v
lþ js¼ csv
l$q
lDsr
xs ðD4ÞThe interface conditions at the crystal-liquid interface are expressed as follows. Two conditions can be derived. The first one expresses that water cannot cross this interface:
/w! ncr¼ cwð
v
w$ wcrÞ ! ncr ¼ ½cwv
l$q
lDs
r
xw$ cwwcr. ! ncr¼ 0: ðD5Þ Replacing xwwith 1 $ xsand cwwithq
l$ csgives:½cs
v
l$q
lDsr
xs. ! ncr¼ ½q
lv
l$ ðq
l$ csÞwcr. ! ncr ðD6Þwhere ncris the unitary vector normal to the interface, pointing
toward the liquid. The second condition expresses the mass conser-vation of salt. The mass flux of dissolved salt crossing the interface corresponds to the mass variation of the crystal:
ð/sþ
q
crwcrÞ:ncr¼ ½csðv
s$ wcrÞ þq
crwcr. ! ncr¼ 0: ðD7Þ And the boundary condition for the salt flux is obtained using Eq.
(D4)in Eq.(D6):
½cs
v
l$q
lDsr
xs. ! ncr¼ $ðq
cr$ csÞwcr! ncr¼ Js! ncr: ðD8Þ The condition of salt solution velocity is obtained by adding Eqs.(D6) and (D7). This yields:
v
l:ncr¼ 1 $q
crq
l" #
wcr! ncr ðD9Þ
Finally, wcris given by Eq.(8): wcr¼
kr
q
cðc $ ceqÞ: ðD10Þ
The robustness of the model is done by checking the mass conser-vation of salt in the entire domain (solution + crystal). It can be noted that it is more difficult for the solver to converge for simula-tions performed for the highest value of kR= 10$2m/s because of
the higher kinetics of fluid motion and mesh deformation. Appendix E. Relation between mass fraction, mass concentration and molality
Study of crystal growth involves determining the amount of ions in solutions. The mixture composition can be expressed using var-ious definitions such as mass fraction, mass concentration or molal-ity. The variable choice differs from one paper to the other. The following defines each variable and recalls the link between them. These relations are used in the next section to express of the overall growth rate parameter found in different papers in the same units. Subscriptl, refers to the salt solution, which is a binary mixture
composed of dissolved salt (subscripts) and water (subscriptw).
E.1. Definition + Mass concentration, ci(kg!m$3): ci¼ mass of specie i volume of solution ¼ Mi Vl; ðE1Þ + Mass fraction, xi(£): xi¼ mass of specie i mass of solution ¼ Mi Ml¼ ci
q
l ; ðE2Þ+ Molality, mi(mol![kg of solvent]$1): mi¼
mole of specie i mass of free solvant ¼
ni
Msolvant
; ðE3Þ
Fig. C1. Picture of the PDMS experimental chip. The PDMS is bonded on a glass cover slip.
+ Supersaturation, S (£):
S ¼equilibrium molality ¼molality mm
eq; ðE4Þ
E.2. Useful relationships
+ We use the following relationship between the density of a NaCl solution and the salt mass fraction or mass concentration[15]:
q
l¼q
w ð1 $ 0:7xsÞ¼q
w ð1 $ 0:7cs qlÞ ¼q
wþ 0:7cs; ðE5Þ whereq
wis the density of pure water+ Relationship between solution density and solute mass concentration:
q
l¼ csþ cw; ðE6Þ+ Relationship between salt molality and salt mass concentration:
ms¼ ns Mw¼ cs Mscw¼ cs Msð
q
l$ csÞ¼ cs Msðq
w$ 0:3csÞ ; ðE7Þwhere Msis the molar mass of salt. Conversely: cs¼
msMs
q
w1 þ 0:3msMs; ðE8Þ
Appendix F. Determination of the overall growth rate parameters reported inTable 1
In order to compare values of the overall crystal growth rate parameter from different sources, we have expressed values of crystal growth found in other papers using the same convention as in the present study. Results are presented below: (seeTables F1–F4)
Ref[17]:
ccris obtained noting that mcr¼ xcr=100=Msand using Eq.(E8)
which gives:
ccr¼
xcr
q
w100 þ 0:3 ' xcr ðF1Þ
JGis obtained using Eq.(A2)and kGusing Eq.(3)
Ref[12]:
In this paper the mean kinetics of crystal growth during the first five minutes is equal to 1.6
l
m/s.Ref[18]: Ref[16]:
Authors indicate that the growth rate is about 10
l
m/s and thesupersaturation is about 1.3. With these approximate values, one obtains the values reported inTable F4.
Table F1
Data from[17]used to determine kG.
Article data Result
xcr$ xeq(g/100 g H20) d(2r)/dt (m/s) ccr(kg/m3) JG(kg/m2/s) kG(m/s) 0.4 4.20 ' 10$8 327.7 4.55 ' 10$5 1.40 ' 10$5 0.6 5.60 ' 10$8 329.31 6.06 ' 10$5 1.24 ' 10$5 0.8 7.00 ' 10$8 330.93 7.58 ' 10$5 1.16 ' 10$5 1 8.50 ' 10$8 332.55 9.20 ' 10$5 1.13 ' 10$5 1.2 1.00 ' 10$7 334.17 10.8 ' 10$5 1.11 ' 10$5 1.4 1.16 ' 10$7 335.79 12.6 ' 10$5 1.10 ' 10$5 1.6 1.31 ' 10$7 337.41 14.1 ' 10$5 1.09 ' 10$5 Table F2
Data from[12]used to determine kG.
Article data Result
Sðm=m0Þ d(2r)/dt (m/s) ccr(kg/m3) JG(kg/m2/s) kG(m/s)
1.62 1.60 ' 10$6 492 1.73 ' 10$3 1.03 ' 10$5
Table F3
Data from[19]used to determine kG.
Article data Results
m d(2r)/dt (m/s) ccr(kg/m3) JG(kg/m2/s) kG(m/s) 11.9 5.30 ' 10$6 575 5.74 ' 10$3 2.29 ' 10$5 12.2 5.10 ' 10$6 587 5.52 ' 10$3 2.10 ' 10$5 11.36 5.60 ' 10$6 554 6.06 ' 10$3 2.64 ' 10$5 Table F4
Data from[16]used to determine kG.
Article data Result
Mcr(mol/l) d(2r)/dt (m/s) ccr(kg/m3) JG(kg/m2/s) kG(m/s)
References
[1]S. Veran-Tissoires, M. Prat, Evaporation of a sodium chloride solution from a saturated porous medium with efflorescence formation, J. Fluid Mech. 749 (2014) 701–749.
[2]A.S. Goudies, H.A. Viles, Salt Weathering Hazards, Wiley, Chichester, 1997. [3]M. Kim, A. Sell, D. Sinton, Aquifer-on-a-chip: understanding pore-scale salt
precipitation dynamics during CO2sequestration, Lab Chip 13 (2013) 2421–
2662.
[4]A.E. Nielsen, J.M. Toft, Electrolyte crystal growth kinetics, J. Cryst. Growth 67 (1984) 278–288.
[5]R. Grossier, Z. Hammadi, R. Morin, S. Veesler, Predictive nucleation of crystals in small volumes and its consequences, Phys. Rev. Lett. 107 (2011) 025504. [6]J.W. Mullin, Crystallization, fourth ed., Elsevier, 2001.
[7]A.A. Noyes, W.R. Whitney, Rate of solution in solid substances in their own solution, J. Am. Chem. Soc. 19 (1897) 930–934.
[8]A. Berthoud, Théorie de la formation des faces d ’un cristal, J. Chim. Phys. 10 (1912) 624–635.
[9]J. Garside, The concept of effectiveness factors in crystal growth, Chem. Eng. Sci. 26 (1971) 1425–1431.
[10]G.W. Scherer, Stress from crystallization of salt, Cem. Concr. Res. 34 (2004)
1613–1624.
[13]J. Desarnaud, H. Derluyn, J. Carmeliet, D. Bonn, N. Shahidzadeh, Metastability limit for the nucleation of NaCl crystals in confinement, J. Phys. Chem. Lett. 5 (2014) 890–895.
[14]F. Chauvet, P. Duru, S. Geoffroy, M. Prat, Three periods of drying of a single square capillary tube, Phys. Rev. Lett. 103 (2009) 124502.
[15]B. Camassel, N. Sghaier, M. Prat, S. Ben Nasrallah, Evaporation in a capillary tube of square cross-section: application to ion transport, Chem. Eng. Sci. 60 (2005) 815–826.
[16]R. Grossier, A. Magnaldo, S. Veesler, Ultra-fast crystallization due to
confinement, J. Cryst. Growth 312 (2010) 487–489.
[17]J. Zhao, H. Miao, L. Duan, Q. Kang, L. He, The mass transfer process and the growth rate of NaCl crystal growth by evaporation based on temporal phase evaluation, Opt. Lasers Eng. 50 (2012) 540–546.
[18]N. Shahidzadeh, J. Desarnaud, Damage in porous media: role of the kinetics of salt (re)crystallization, Eur. Phys. J. Appl. Phys. 60 (2012) 24205.
[19]J. Crank, The Mathematics of Diffusion, second ed., Oxford University Press, 1975.