O
pen
A
rchive
T
OULOUSE
A
rchive
O
uverte (
OATAO
)
OATAO is an open access repository that collects the work of Toulouse researchers and
makes it freely available over the web where possible.
This is an author-deposited version published in :
http://oatao.univ-toulouse.fr/
Eprints ID : 16287
To link to this article : DOI : 10.14411/eje.2015.083
URL :
http://dx.doi.org/10.14411/eje.2015.083
To cite this version : Larrieu, Laurent and Cabanettes, Alain and Sarthou, Jean-Pierre
Hoverfly (diptera: syrphidae) richness and abundance vary with forest stand
heterogeneity: preliminary evidence from a case study in a montane beech fir forest.
(2015) European Journal of Entomology, vol. 112 (n° 4). pp. 755-769. ISSN 1210-5759
Any correspondence concerning this service should be sent to the repository
administrator:
[email protected]
IntroductIon
There are 534 species of hoverflies (Diptera: Syrphidae)
recorded in France (Speight et al., 2013). Larvae have a
wide range of feeding habits and are involved in recycling
of deadwood (Speight, 1989) and regulating the abundance
of pests (i.e. Smith et al., 2008; Rotheray & Gilbert, 2011;
Nelson et al., 2012). Adults of all the species are
floricol-ous and pollinate plants (Jarlan et al., 1997; Frank &
Volk-mar, 2006; Gibson et al., 2006), probably even trees and
shrubs (Groot & Bevk, 2012). Given the general
agree-ment on the insurance hypothesis, i.e. a high level of
bio-diversity could insure ecosystems against decline in their
functioning linked to environmental fluctuations (Yachi &
Loreau, 1999; Tscharntke et al., 2012), as the preservation
of the highest possible species richness of such important
biological groups is of the utmost importance in the
cur-rent context of global change. Functional diversity (FD)
measures functional trait diversity within assemblages and
hence is a component of biodiversity (Petchey & Gaston,
2006) and determines ecosystem processes (e.g. Loreau et
al., 2001). FD makes it possible to analyze variations in an
assemblage in terms of alterations in ecosystem properties
(Loreau et al., 2001).
The “Syrph the Net” database (Speight et al., 2013) lists
a wide range of the life history traits of species. However,
despite the popularity of hoverflies among naturalists and
their use as indicator species at the landscape scale
(Som-maggio & Burgio, 2003) and for identifing forests of
con-servation value (Speight, 1989; Good & Speight, 1996),
literature on the environmental requirements of forest
hov-erflies at the stand scale is very rare and our understanding
of the structure of local assemblages weak (Keil &
Kon-vicka, 2005). Nevertheless, notable contributions on this
topic are those of Humphrey et al. (1999), who highlight
a correlation between vertical stand structure and hoverfly
diversity, Fayt et al. (2006), who found that saproxylic
as-semblages may be constrained by the absence of a rich
her-baceous plant layer that provides the floral resources they
require for reproduction and Gittings et al. (2006) and then
Ricarte et al. (2011), who highlight the positive role of the
supply of floral resources in open areas in woodlands in
determining hoverfly diversity at both stand and landscape
scales.
Beech/fir (Fagus silvatica L. – Abies alba Mill.) forest
is a dominant in most European mountain ranges and
cov-ers 380,000 km
2(4% of the total forested area in Europe)
(MCPFE, 2007; EUFORGEN, 2012). These forests are
known for their key role in the conservation of forest
bio-diversity. Müller et al. (2012) show that beech-dominated
forests are an umbrella habitat for central European
sap-roxylic beetles since 70% of these species can be found in
such forests. However, these forests are also of great
eco-Hoverfly (Diptera: Syrphidae) richness and abundance vary with forest stand
heterogeneity: Preliminary evidence from a montane beech fir forest
L
aurentLARRIEU
1,2
, a
LainCABANETTES
1and J
ean-P
ierreSARTHOU
3,4
1 INRA, UMR1201 DYNAFOR, Chemin de Borde Rouge, Auzeville Tolosane, CS 52627, F-31326 Castanet Tolosan Cedex, France; e-mails: [email protected]; [email protected]
² CNPF/ IDF, Antenne de Toulouse, 7 chemin de la Lacade, F-31320 Auzeville Tolosane, France
3 INRA, UMR 1248 AGIR, Chemin de Borde Rouge, Auzeville Tolosane, CS 52627, F-31326 Castanet Tolosan Cedex, France; e-mail: [email protected]
4 University of Toulouse, INP-ENSAT, Avenue de l’Agrobiopôle, F-31326 Castanet Tolosan, France
Key words. Diptera, Syrphidae, Abies alba, deadwood, Fagus silvatica, functional diversity, tree-microhabitats, stand heterogeneity Abstract. Hoverflies (Diptera: Syrphidae) provide crucial ecological services and are increasingly used as bioindicators in
environ-mental assessment studies. Information is available for a wide range of life history traits at the species level for most Syrphidae but little is recorded about the environmental requirements of forest hoverflies at the stand scale. The aim of this study was to explore whether the structural heterogeneity of a stand influences species richness or abundance of hoverflies in a montane beech-fir forest. We used the catches of Malaise traps set in 2004 and 2007 in three stands in the French Pyrenees, selected to represent a wide range of structural heterogeneity in terms of their vertical structure, tree diversity, deadwood and tree-microhabitats. We assessed hoverfly assemblages by recording species richness, abundance and functional diversity. Malaise traps caught 2,374 hoverflies belonging to 104 species. The catches of hoverflies fluctuated both in species richness and abundance between 2004 and 2007. Strictly forest species were only caught in the most heterogeneous stand. Species strictly associated with fir were not recorded in the least heterogeneous stand although fir was present. Although most of the functional groups were recorded in the three stands, species richness, abundance and functional diversity decreased dramatically from the most heterogeneous to the least heterogeneous stand. However, the species assemblages in the less heterogeneous stands were not perfect subsets of that in the most heterogeneous stand, as some additional species not found in the most heterogeneous stand were also present.
mental factors and differences in the biogeographic pool
of species.
MAteriAl AnD MetHoDS
Stands studied and measurement of structural features
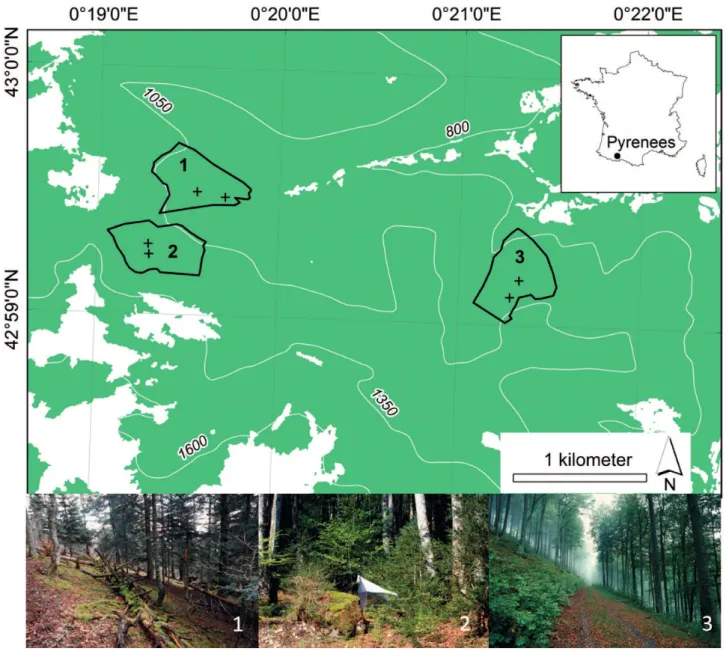
The three stands studied are located in the same area in the foothills of the central Pyrenees (France; WGS 84, Lat/Long: 42°59´N/0°20´E) (Fig. 1). They are natural habitats of montane beech-fir forest (Fagion sylvaticae, Bardat et al., 2004). Since limestone is the dominant substrate, the soils are rich. All the stands studied are in an ancient forest referred to in old maps drawn in the second half of the 19th century, which, in France, was the period when the forested area was lowest (Dupouey et al., 2007).
The three stands differed in terms of their structure, mainly de-termined by management (Table 1). “UnHarv100” was the most mature as no logging has occurred there since 1900. ‘‘UnHarv50” was mostly dominated by beech, in a zone logged using a grav-ity cable technique in 1950 and not managed since. “Harv” was mostly dominated by beech and has been regularly logged over the last 25 years. Information was recorded for 29 plots between
nomic value and most have been managed for a long time,
which has had a major effect on their structural
heterogene-ity. Old management practices reduced their dendrological
diversity by favouring beech at the expense of fir (Metailié,
2001). Furthermore, current management (i) also seriously
upsets the structure and dynamics of the stock of deadwood
by reducing the total amount and number of decay stages
(Larrieu et al., 2012), (ii) reduces the number of
micro-habitat bearing trees (Winter & Möller, 2008; Larrieu et al.,
2014) and (iii) disturbs the tree-microhabitat assemblages
by favouring certain types of microhabitat while others
be-come rare or disappear (Larrieu et al., 2012).
This preliminary study explores whether the species
richness or abundance of hoverflies is associated with the
structural heterogeneity at the stand scale in a montane
beech-fir forest. We compare hoverfly assemblages in three
stands with different management histories, which have
re-sulted in different structural heterogeneities, in the same
forest and so control for both variations in other
environ-Fig. 1. Map showing the geographical location below which are pictures of the stands studied. 1 – UnHarv100; 2 – UnHarv50; 3 – Harv.
2003 and 2005 (Table 1). All the plots were sampled using a Bit-terlich relascope (BitBit-terlich, 1984). In order to more accurately record the variability 9–10 plots were sampled in each stand. Each plot was on average 0.3 ha in area.
The structural heterogeneity of the stands was described in terms of the vertical structure of the vegetation, tree diversity, deadwood and tree-microhabitats (see details of protocols in Table 2). We used the stratiscope method (Blondel & Cuvillier, 1977) to describe the spatial heterogeneity in the distribution of foliage, both vertically and horizontally. Vegetation layers were surveyed at seven points separated from each other by 5 m along horizontal transects centered on each plot. All contacts of the foli-age with a virtual vertical cylinder 50 cm in diameter were noted in 4 strata (< 1 m, 1–3 m, 3–10 m, 10–20 m and ≥ 20 m). All the living trees measured using a relascope were identified to species and their diameters measured at breast height (dbh) on top of the bark. The tree trunks were carefully examined from the ground to the top of the canopy and presence/absence of eight microhabitats on the visible part of the trunk both beneath and within the tree crown were recorded (Table 2). All dead wood greater in diameter
than 20 cm was identified and its length and girth measured, and classified on a decay scale of 1–5 (Table S1).
Heterogeneity of the stands
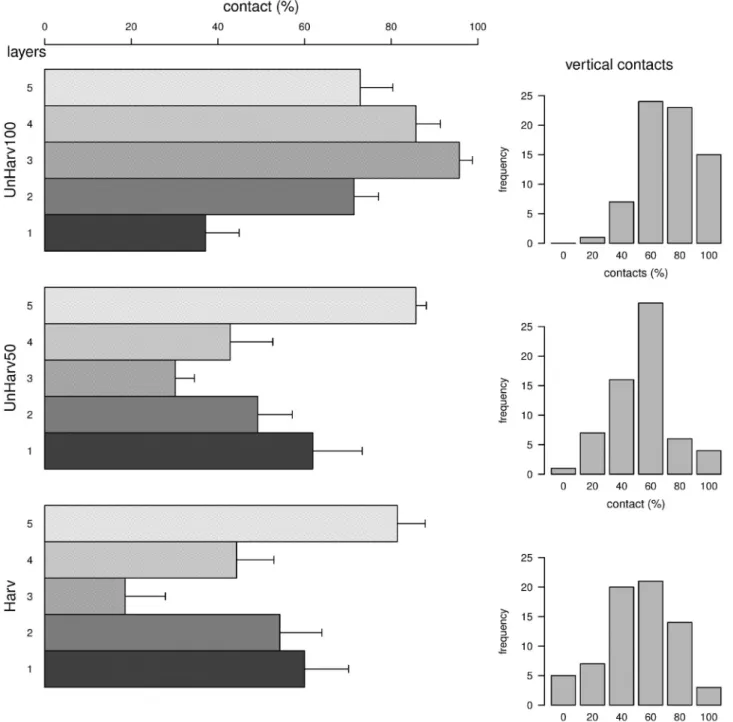
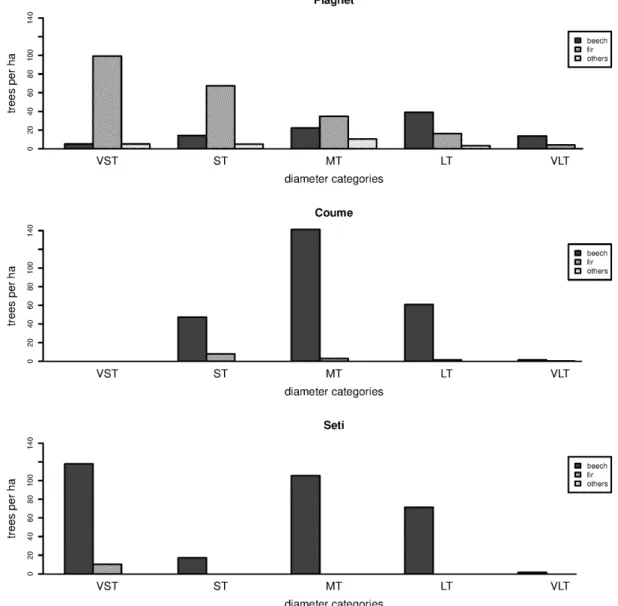
The gradient in heterogeneity from UnHarv100 (the most het-erogeneous stand) to Harv (the least hethet-erogeneous) revealed: (i) a change from an irregular to a regular dendrometric structure (Fig. S1), (ii) a decrease in tree diversity and increase in the rar-ity of fir (Fig. S1), (iii) a decrease in the number of very large trees (dbh > 70 cm) (Fig. S1), (iv) a decrease in the total volume of deadwood and absence of several decay stages (Table S3), (vi) marked differences in numbers of certain tree-microhabitats (Table S3) and finally (vii) a decrease in the complexity of the structure of the foliage associated with the loss of grassy open areas (Fig. 2). UnHarv100 had a vegetation structure (Fig. 2, left part) in which percentage cover of each of the four upper strata was more than 70%, with an alternation of plants and litter in the lower stratum. No vertical transect showed any contact (right part of Fig. 2), since herbaceous species filled clearings. Shrubs occupied part of stratum 2, containing flowers, at least in clear-tabLe 1. Sample design and main characteristics of the stands studied. dbh – diameter at breast height; SE – standard error.
Stand Managementhistory Study area (ha) No. of plots No. of live trees mea-sured Dendrometric structure (see also Fig. S1) Dendrological composition Basal area G (m²/ha) standing deadwood + living trees Mean [CI] No. of items of dead wood mea-sured Diameter at breast height (cm) mean (min–max) No. of very large trees (dbh > 70 cm) per ha Total volume of deadwood (m3/ha) [SE] and decay stages beech fir
UnHarv100 Not loggedsince 1900 23 10 371 Irregular
Dominated by fir and beech + Acer
campestre, A. plat-anoides, Prunus
avium, Taxus baccata and Tilia
platyphyllos 40 [33–48] 84 (15.9–62.9 127.3) 44.4 (8.0– 124.1) 18 32 [8.38] Main decay stage = 4
UnHarv50 Intensively logged in 1950, not logged since 20 9 286 Almostregular beech; scarce firs 36.5 [32–42] 124Dominated by (17.5–42.8 87.5) 43.3 (20.7– 82.8) 2 55 [12.73] Main decay stage = 2 Harv
Logged twice by selec-tive logging in the last 25 years (total logged volume = 50 m3 ha–1)
22 10 280 Regular Almost purebeech stand 35 [31–39] 73 (4.8–45.6 73.2) 11.1 (11.1– 11.1) 1 9 [2.34] Decay stages 1, 2 and 5 missing
tabLe 2. Components of structural heterogeneity, ecological variables and field procedures used to describe the structural heterogeneity of the stands. Components of structural
heterogeneity Ecological variables Field procedure used to record the variable Dendrological
diversity Tree species. Identification of each tree in the plot at species level. Dendrometric
heterogeneity
Distributions of the diameters recorded at breast height for
each species of tree. Measurement of the diameter of each tree in the plot. Vegetation structure Number of verticaland horizontal contacts
with vegetation strata.
All foliage contacts measured with a virtual vertical cylinder (diameter 50 cm) in 5 strata (< 1 m, 1–3 m, 3–10 m, 10–20 m and ≥ 20 m). Variable recorded at seven points separated from each other by 5 m along horizontal transects centered on the plot; 10 plots per stand. Type of contact (herbaceous vs. ligneous plant).
Deadwood
Total volume per hectare. Pattern of distribution of the volume per tree-species and decay stage.
For each deadwood item, we (1) identified the tree species, (2) measured the diameter in the middle of logs and snags of under 4 m, at the cut for high stumps, and at breast height for snags of over 4 m and (3) recorded the stage of decay using a reference scale with 5 levels (Table S1).
Tree microhabitats Density per hectare.Number of microhabitat types.
Set of 8 microhabitat types recorded on the visible part of the trunk both beneath and inside the tree crown: (1) four cavity types on living trees and snags; (2) cracks in the tree trunk, on living trees and snags; (3) dendrothelms on living trees; (4) sporophores of polypores, on living trees, snags and logs. Each tree or wood item recorded was classified with respect to the absence or presence of sporophores, without estimating their numbers; (5) missing bark only on living trees. (See details, such as size thresholds, in Larrieu et al., 2012.)
ings. UnHarv50 and Harv had a less heterogeneous structure than UnHarv100, with less cover in the intermediate stratum (stratum 3). In these stands, the lower stratum mainly consisted of beech seedlings, shrubs were rare and the distribution of vertical con-tacts with vegetation indicates there were many vertical transects with < 20% contacts.
Only the most mature beech-fir stand, UnHarv100, which has not been logged since 1900, had a structural heterogeneity close to that recorded in sub-natural stands, i.e. a complex vegetation structure with grassy clearings, high dendrological diversity,
many very large trees and typical quantities of deadwood and numbers of microhabitats (Greenberg et al., 1997; Nilsson et al., 2002; Christensen et al., 2005; Larrieu et al., 2012, 2014). The vegetation structure at UnHarv50, which has not been logged since 1950, was less complex with a lower dendrological diver-sity and only the occasional coniferous tree. Harv, which has been regularly logged over the last 25 years, had the simplest structure, with marked dominance of beech, a very small quantity of dead-wood and absence of several stages of deaddead-wood decay.
Fig. 2. Foliage distribution in the three beech-fir stands studied (Harv, UnHarv50 and UnHarv100). The mean and standard error of the % of contacts per layer, (layer 1: contacts between ground and 1 m; 2: 1–3 m; 3: 3–10 m; 4: 10–20 m; 5: over 20 m; is indicated on the left for each stand. For details of the procedure, see Table 2). This illustrates the average vertical footprint of vegetation layers at the plot scale (vertical heterogeneity of the vegetation). On the right, the figures shows mean frequencies for 6 levels of % of all the vegetation contacts (all layers pooled). This illustrates the horizontal distribution of the different levels of vertical vegetation footprints (horizontal heterogeneity of vegetation).
Hoverfly sampling and definition of functional groups and guilds
Since a Malaise trap is the most appropriate device for quan-titative studies of hoverflies when few sites are sampled (Som-maggio, 1999) hoverflies were sampled using two Malaise traps per stand. Sampling was carried out at two-weekly intervals from May to October in two non-consecutive years, 2004 and 2007, in order to obtain data for two independent years. All the samples were identified to the species by one of the authors (JPS) who also conserved the insects.
Using the Syrph the Net database (Speight et al., 2013), we defined guilds with respect to (1) forest dependency (strictly, optionally, or strictly not forest species for reproduction), (2) migratory behaviour (strongly, weakly or non migrant) and (3) commensalism (yes or no). In addition functional groups in terms of (4) the feeding behaviour of the larvae (living plants, living animals, saproxylic) and (5) adult feeding behaviour (pollen and nectar gathered from flowers or leaves, Homopteran honeydew) (see details in Table S2). Syrph the Net provides the quality of the relationship between a life history trait and a species based on a
fuzzy coding system, from blank, which means no association, to 3 for a maximum association. In this study, we only used code 3.
In order to characterize the variations in hoverfly assemblages between stands, species richness, abundance and diversity of the whole community, guilds and functional groups were determined for each stand.
Calculations and statistical procedures
In order to highlight differences and similarities in composition of the different samples caught by the six Malaise traps during the two years, a hierarchical clustering analysis (hclust function) was carried out on the abundance data, using a Bray-Curtis distance matrix and the vegdist function (vegan package, Oksanen et al., 2013).
Functional diversity (FD) was estimated using Petchey & Gas-ton’s (2006) method, and a dendrogram produced based on the life history trait distance matrix (Jaccard distance, vegan pack-age; Oksanen et al., 2013), for all the species caught. The total length of the dendrogram branches was calculated in the same way as for “phylogenetic diversity” (picante package, Kembel et al., 2014) for the dendrogram that included all the species re-corded in this study (forest FD) and the assemblages of species recorded in each stand. Results were standardized by expressing them as a percentage of the forest FD. The ratios of FD to species richness (RS) were calculated to express the functional redundan-cy of species belonging to the same group: the higher the ratio, the smaller the functional redundancy.
All analyses were performed using statistical software R 3.0.2 (R Development Core Team, 2014).
reSultS
Species richness and abundance
A total of 2,374 hoverflies was collected from the
Ma-laise interception traps in the three stands in the two years
(Table 3). They were identified as belonging to 46 genera
and 104 species. Since we chose the three stands within a
gradient of structural heterogeneity (attributed mainly to
occurrence and intensity of harvesting) and since we tried
to control environmental parameters such as altitude,
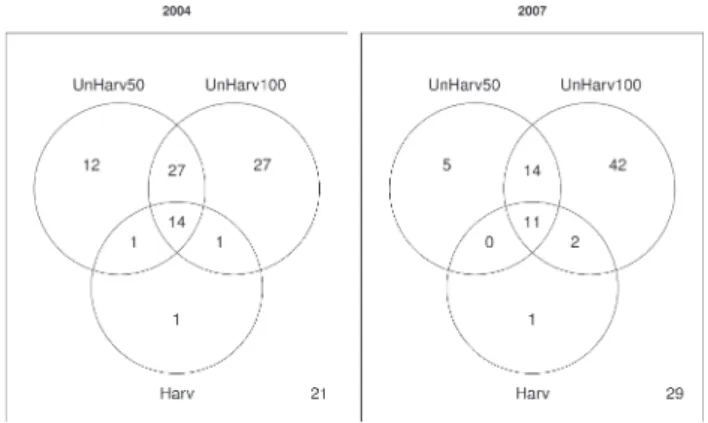
for-Fig. 3. Venn diagrams of the number of hoverfly speciestrapped in Harv, UnHarv50 and UnHarv100 in 2004 and 2007. The number in the bottom-right hand corner indicates the num-ber of species caught during the other year in the set of the three stands sampled, which were not caught during that year.
Fig. 4. Abundance of hoverfly species (ranked in decreasing order) in the three beech-fir stands studied (Harv, UnHarv50 and Un-Harv100) in 2004 and 2007.
tabLe 3. Hoverfly assemblages in the three stands studied, in 2004 and 2007 and per trap (A and B). Numbers indicate the abundance of each species.
Species 2004UnHarv1002007 2004UnHarv502007 2004 Harv 2007
A B A B A B A B A B A B
Baccha elongata (Fabricius), 1775 11 4 6 1 5 0 0 1 0 1 2 3
Blera fallax (Linnaeus), 1758 5 2 2 2 0 0 0 1 0 0 0 0
Brachyopa dorsata Zetterstedt, 1837 3 1 0 0 1 1 0 1 0 0 0 0
Brachyopa pilosa Collin, 1939 0 0 1 1 0 0 0 0 0 0 0 0
Brachyopa scutellaris Robineau-Desvoidy, 1843 1 0 1 0 0 0 0 0 0 0 0 0
Brachyopa vittata Zetterstedt, 1843 1 0 0 0 0 0 0 0 0 0 0 0
Brachypalpoides lentus (Meigen), 1822 11 2 0 1 4 0 0 1 0 0 0 0
Brachypalpus laphriformis (Fallen), 1816 3 1 2 0 1 1 0 0 1 1 1 1
Caliprobola speciosa (Rossi), 1790 1 0 0 2 1 0 0 0 0 0 0 0
Chalcosyrphus nemorum (Fabricius), 1805 1 4 3 19 0 0 0 1 0 1 0 0
Cheilosia aerea Dufour, 1848 0 0 0 4 0 0 0 0 0 0 0 0
Cheilosia albipila Meigen, 1838 1 2 0 0 0 0 0 0 0 0 0 0
Cheilosia albitarsis (Meigen), 1822 9 0 1 5 2 4 0 1 0 0 0 0
Cheilosia carbonaria Egger, 1860 0 0 0 0 0 2 0 0 0 0 0 0
Cheilosia fasciata Schiner &Egger, 1853 0 1 0 0 0 0 0 0 0 0 0 0
Cheilosia flavipes (Panzer), 1798 0 0 0 1 0 0 0 0 0 0 0 0
Cheilosia fraterna (Meigen), 1830 6 4 1 0 9 1 0 0 0 0 0 0
Cheilosia lenis Becker, 1894 0 0 0 0 1 0 0 0 0 0 0 0
Cheilosia proxima (Zetterstedt), 1843 2 1 0 1 0 0 0 0 0 0 0 0
Cheilosia scutellata (Fallen), 1817 1 0 0 1 0 0 0 0 0 0 0 0
Cheilosia soror (Zetterstedt), 1843 1 1 9 11 1 0 0 0 0 0 0 0
Cheilosia urbana (Meigen), 1822 0 1 0 3 0 0 0 0 0 0 0 0
Cheilosia variabilis (Panzer) 1798 0 0 0 0 1 2 1 0 0 1 0 0
Cheilosia vernalis (Fallen), 1817 1 1 0 3 0 0 0 0 0 0 0 0
Cheilosia vicina (Zetterstedt), 1849 0 1 0 0 11 5 0 0 0 0 0 0
Cheilosia vulpina (Meigen), 1822 1 0 0 0 0 0 0 0 0 0 0 0
Chrysotoxum bicinctum (L.), 1758 0 1 3 0 2 0 0 1 0 0 0 0
Chrysotoxum cautum (Harris), 1776 0 0 1 0 0 0 0 0 0 0 0 0
Chrysotoxum elegans Loew, 1841 0 0 1 0 0 0 0 0 0 0 0 0
Chrysotoxum fasciatum(Muller), 1764 0 0 0 0 0 1 0 0 0 0 0 0
Chrysotoxum festivum (L.), 1758 0 0 3 1 0 0 0 0 0 0 0 0
Chrysotoxum vernale Loew, 1841 0 1 0 0 0 0 0 0 0 0 0 0
Criorhina asilica (Fallen), 1816 3 0 2 0 1 0 0 0 0 0 0 0
Criorhina berberina (Fabricius), 1805 101 9 78 23 3 22 0 3 0 16 0 5
Criorhina floccosa (Meigen), 1822 0 0 0 0 0 0 0 0 0 0 0 1
Dasysyrphus albostriatus (Fallen), 1817 0 0 0 1 0 0 0 0 0 0 0 0
Dasysyrphus friuliensis (van der Goot), 1960 0 0 0 0 0 1 0 0 0 0 0 0
Dasysyrphus venustus (Meigen), 1822 0 0 0 1 0 0 1 0 0 0 0 0
Didea fasciata Macquart, 1834 0 1 0 0 0 0 0 0 0 0 0 0
Epistrophe eligans (Harris), 1780 0 1 0 0 0 0 0 0 0 0 0 0
Epistrophe flava Doczkal & Schmid, 1994 0 1 1 0 2 0 0 0 0 0 0 0
Episyrphus balteatus (DeGeer), 1776 61 44 4 3 43 38 0 3 3 1 1 1
Eristalis jugorum Egger, 1858 1 0 0 0 0 0 0 0 0 0 0 0
Eristalis nemorum (L.), 1758 0 0 1 0 0 0 0 0 0 0 0 0
Eristalis pertinax (Scopoli), 1763 1 5 1 0 0 4 0 0 0 0 0 0
Eristalis similis (Fallen), 1817 1 10 0 0 10 11 0 0 0 0 0 0
Eristalis tenax (L.), 1758 0 0 0 2 0 0 0 0 0 0 0 0
Eumerus flavitarsis Zetterstedt, 1843 1 0 0 0 0 0 0 0 0 0 0 0
Eumerus grandis Meigen, 1822 0 0 0 0 1 0 0 0 0 0 0 0
Eumerus ornatus Meigen, 1822 1 0 0 0 0 0 0 0 0 0 0 0
Eupeodes bucculatus (Rondani), 1857 0 1 0 0 0 0 0 0 0 0 0 0
Eupeodes corollae (Fabricius), 1794 17 22 2 24 15 4 1 0 0 3 1 1
Eupeodes latifasciatus (Macquart), 1829 1 1 10 9 1 7 0 0 0 0 0 0
Eupeodes luniger (Meigen), 1822 0 2 0 0 1 4 0 0 0 1 0 0
Ferdinandea cuprea (Scopoli), 1763 3 0 1 0 0 1 0 0 0 0 0 0
Helophilus pendulus (L.), 1758 3 1 3 2 0 2 0 0 0 0 0 0
Lapposyrphus lapponicus (Zetterstedt), 1838 4 11 0 0 26 6 1 0 0 1 0 0
Melangyna lasiophthalma (Zetterstedt), 1843 0 0 0 0 1 0 0 0 0 0 0 0
Melangyna umbellatarum (Fabricius), 1794 0 0 1 0 0 0 0 0 0 0 0 0
Melanogaster hirtella (Loew), 1843 0 0 1 0 0 0 0 0 0 0 0 0
Melanostoma mellinum (L.), 1758 12 9 70 65 2 0 2 4 0 0 0 2
Melanostoma scalare (Fabricius), 1794 72 21 42 44 15 6 4 7 1 3 0 9
Meligramma cincta (Fallen), 1817 0 0 2 2 7 6 3 4 0 0 1 0
Meliscaeva auricollis (Meigen), 1822 33 20 18 15 16 33 2 5 0 3 0 0
Meliscaeva cinctella (Zetterstedt), 1843 9 0 4 2 0 3 0 2 0 0 0 0
Microdon analis (Macquart), 1842 0 0 5 2 0 0 0 0 0 0 0 0
Microdon mutabilis (L.), 1758 4 1 1 0 0 0 0 0 0 0 0 0
Myathropa florea (L.), 1758 12 9 3 4 2 1 0 5 0 0 0 1
Neoascia podagrica (Fabricius), 1775 0 0 0 1 0 0 0 0 0 0 0 0
Paragus haemorrhous Meigen, 1822 1 0 0 1 0 0 0 0 0 0 0 0
Paragus pecchiolii Rondani, 1857 2 4 0 0 0 0 0 0 0 0 0 0
Parasyrphus punctulatus (Verrall), 1873 1 0 10 16 2 4 1 5 0 0 1 2
Pipiza notata Meigen, 1822 0 0 0 0 2 0 0 0 0 0 0 0
Platycheirus albimanus (Fabricius), 1781 30 71 26 33 13 34 0 10 0 5 0 0
Platycheirus ambiguus (Fallen), 1817 0 0 0 1 0 0 0 0 0 0 0 0
Platycheirus europaeus Goeldlin, Maibach & Speight, 1990 0 0 1 0 0 0 0 0 0 0 0 0
Platycheirus scutatus (Meigen), 1822 0 2 1 6 0 1 0 1 0 0 0 0
Rhingia borealis Ringdahl, 1928 28 3 1 3 0 0 0 0 0 0 0 0
Rhingia campestris Meigen, 1822 0 0 0 2 0 0 0 0 0 0 0 0
Rhingia rostrata (L.), 1758 33 7 35 5 4 6 0 1 0 2 0 2
Scaeva pyrastri (L.), 1758 0 0 0 0 0 0 0 1 0 0 0 0
Scaeva selenitica (Meigen), 1822 0 0 0 0 0 2 0 0 0 0 0 0
Sericomyia bombiforme (Fallen), 1810 3 0 4 0 0 0 0 1 0 0 0 0
Sericomyia silentis (Harris), 1776 1 1 0 0 1 1 0 0 0 1 0 0
Sericomyia superbiens (Muller), 1776 1 1 0 0 0 0 0 0 0 0 0 0
Sphaerophoria interrupta (Fabricius), 1805 0 0 0 0 1 0 1 0 0 0 0 0
Sphaerophoria scripta (L.), 1758 12 17 1 16 11 7 0 0 0 5 0 0
Sphegina clunipes (Fallen), 1816 7 2 8 3 6 0 0 1 0 0 0 0
Sphiximorpha subsessilis (Illiger in Rossi), 1807 0 0 0 0 1 0 0 0 0 0 0 0
Syrphus ribesii (L.), 1758 1 1 4 2 3 9 0 2 0 0 1 0
Syrphus torvus Osten-Sacken, 1875 1 1 0 2 1 3 0 0 0 0 0 0
Syrphus vitripennis Meigen, 1822 0 1 0 1 0 0 0 1 0 0 0 0
Temnostoma bombylans (Fabricius), 1805 17 3 12 3 6 6 0 0 0 1 0 0
Temnostoma meridionale Krivosheina & Mamayev, 1962 1 1 0 0 0 1 0 0 0 0 0 0
Temnostoma vespiforme (L.), 1758 16 2 2 1 1 5 0 0 0 0 0 0
Volucella inflata (Fabricius), 1794 0 0 1 0 0 0 0 0 0 1 0 0
Volucella pellucens (L.), 1758 0 0 2 1 0 0 0 0 0 0 0 1
Xanthandrus comtus (Harris), 1780 0 0 0 1 0 0 0 0 0 0 0 0
Xanthogramma citrofasciatum (de Geer), 1776 0 0 0 0 1 0 0 0 0 0 0 0
Xanthogramma laetum (Fabricius), 1794 1 0 0 1 0 0 0 0 0 0 0 0
Xylota florum (Fabricius), 1805 1 0 0 0 0 0 0 0 0 0 0 0
Xylota segnis (L.), 1758 20 7 13 23 4 4 1 1 0 0 0 0
Xylota sylvarum (L.), 1758 10 5 4 11 2 1 0 0 0 0 0 0
Xylota xanthocnema Collin, 1939 1 0 2 2 0 0 0 0 0 0 0 0 TOTAL
est type, etc., we expected nested assemblages. However
12 species: Cheilosia carbonaria Egger, 1860, C. lenis
Becker, 1894, Chrysotoxum fasciatum (Muller), 1764,
Dasysyrphus friuliensis (van der Goot), 1960, Eumerus
grandis Meigen, 1822, Melangyna lasiophthalma
(Zet-terstedt), 1843, Pipiza notata Meigen, 1822 (syn. Pipiza
bimaculata Meigen, 1822), Scaeva pyrastri (L.) 1758, S.
selenitica (Meigen) 1822, Sphaerophoria interrupta
(Fab-ricius), 1805, Sphiximorpha subsessilis (Illiger in Rossi),
1805, Xanthogramma citrofasciatum (de Geer), 1876, and
a subset of five of these species, were only trapped in
Un-Harv50, in 2004 and 2007, respectively (Fig. 3). One
spe-cies, Criorhina floccosa (Meigen) 1822, was only trapped
in Harv in both 2004 and 2007. Twenty-one species were
trapped in 2007 but not in 2004, while 29 species were
trapped in 2004 and not in 2007 (Fig. 3). Species strictly
associated with fir, e.g. Blera fallax (L.), 1758 and Rhingia
borealis (Ringdahl, 1928) were not recorded in Harv
(Ta-ble 3).
Per stand, the highest numbers of both species and
indi-viduals were recorded in UnHarv100 and lowest in Harv,
both in 2004 and 2007 (Fig. 4 and Table 3).
The first node of the cluster dendrogram completely
separated Harv and Unharv100. In contrast, the samples
collected in Unharv50 were split according to the year
col-lected: 2004 close to UnHarv100 and 2007 close to Harv
(Fig. 5). This result indicated a clear response of hoverfly
assemblages to the gradient in stand heterogeneity, by
par-titioning the distributions of hoverfly abundances
accord-ing to the three levels of heterogeneity, based on variation
among years and traps.
Distribution of guilds and functional groups in the
three stands, and functional diversity
The species richness within the guilds and functional
groups was always ranked in the following order:
Un-Harv100 > UnHarv50 > Harv (Table S4 and Fig. 6).
Strict-ly forest species were onStrict-ly caught in UnHarv100. There
was a notable difference in the abundance recorded at the
three sites, with the same rank as above (Fig. 6, S2 and S3).
FD was positively correlated with species richness (RS).
Both FD and SR decreased dramatically from UnHarv100
to Harv but not in the same proportion. The FD:RS ratio
increased from UnHarv100 (1.11) to UnHarv50 (1.31) and
then Harv (1.96) (Table 4).
DiSCuSSion
Hoverfly assemblages
Interestingly, even though the species richness and
abun-dance of hoverflies decreased from the most heterogeneous
(UnHarv100) to the least heterogeneous stand (Harv), we
did not simply record an impoverishment in the syrphid
fauna in parallel with decrease in structural heterogeneity.
Quite a large number of species were only recorded in the
stand of intermediate-heterogeneity (UnHarv50). These
were mainly phytophagous species (such as Cheilosia
spp. and Eumerus grandis) or aphidophagous species that
feed on aphids infesting low growing or small plants (such
as Melangyna lasiophthalma, Scaeva spp., Pipiza spp.,
Sphaerophoria interrupta), tall plants (such as
Dasysyr-phus friuliensis) or even the roots of plants (such as
Chrysotoxum fasciatum, Xanthogramma citrofasciatum).
Although the microhabitats of these larvae were also
pre-sent in the most heterogeneous stand, it is possible that the
stand of intermediate-heterogeneity provided
microhabi-tats of higher quality or a better match for the requirements
of the larvae. Only two microphagous species were trapped
only in the intermediate and least heterogeneous stand:
Sphiximorpha subsessilis and Criorhina floccosa,
respec-tively, but, in both cases, only one specimen was trapped in
the entire study. The larval microhabitat of Sphiximorpha
subsessilis is sap-flows on old Abies alba trees (Speight et
al., 2013), always rare, even in forests that have not been
logged for a very long time (Larrieu et al., 2014). The
lar-vae of Criorhina floccosa are mainly found in the wet
de-caying roots of Fagus stumps (Speight et al., 2013).
Hoverflies differed both in species richness and
abun-dance in 2004 and 2007. We checked that no silvicultural
intervention or wide-scale event (such as windthrow) had
occurred in the stands sampled during the period between
these two years, but cannot be sure that nothing changed
since we did not record the stand descriptors in 2007, which
would have enabled us to measure possible slight changes.
However, changes in deadwood and tree-microhabitat
pat-terns are long-term processes (e.g. Larrieu et al., 2012).
Fig. 5. Cluster dendrogram based on a hierarchical clusteringanalysis of hoverfly samples trapped per stand, year and trap. The first node of the cluster dendrogram completely separated Harv and Unharv100. In contrast, the samples for Unharv50 were split according to the year sampled: 2004 close to UnHarv100 and 2007 close to Harv.
tabLe 4. Specific richness (SR) and functional diversity (FD)
of hoverflies recorded for the three stands studied, expressed as percentages of the total FD of the forest.
Stands SR (%) FD (%)
UnHarv100 86.54 95.96
UnHarv50 57.69 75.30
Guild sensitivity and functional diversity
We recorded a dramatic decrease in species richness and
individual abundance in the guilds and functional groups
in intermediate-heterogeneous stands and the least
hetero-geneous, except for the guild of strongly migrant species.
We assume this is linked to the reduction in stand
hetero-geneity. According to Huston (1994), the last stage of this
process is the reduction in the number of functional groups.
However, members of all the guilds and functional groups
were present in the three stands, except the strictly forest
species, which were only recorded in the most
heterogene-ous stand. Nevertheless, from point of view of the
insur-ance hypothesis (Yachi & Loreau, 1999), this decrease in
species richness and individual abundance might impair
the potential resilience of the intermediate-heterogeneous
stand , and above all in the least heterogeneous stand, when
Fig. 6. Distribution in the different stands of the number of hoverfly species (left) and individuals (right), expressed as a proportion of the total number per guild or functional group. strctF: strictly forest species, facF: optionally forest species, strctNF: strictly non forest species; str.migrant: strongly migrant species, weak.migrant: weakly migrant species, non.migrant: non migrant species; NL.LA: zoophagous larvae, NL.LP: phytophagous larvae, NL.SAP: saproxylic larvae; NA.FLO: adults feed on pollen and nectar gathered from flowers, NA.OTH: adults feed on pollen gathered on upper surface of leaves or adults feed on sap-runs; C.COM: commensal species; C.NONE: non commensal species. See Table S2 for a description of the guilds and functional groups; from left to right, shades of grey distinguish successively the five following categories: forest dependency, migrants, feeding behaviour of larvae, feeding behaviour of adults and commensalism.disturbed. Furthermore, the disappearances of species and
decrease in a stand’s structural heterogeneity could have a
cascade effect since these disappearances could in
them-selves also reduce the structural heterogeneity of the stand
(Therriault & Kolasa, 2000). Ultimately, functional loss
cannot be correctly evaluated by using only a coarse
func-tional diversity measure based on available life history
traits and should be supplemented by determining the
spe-cies richness and abundance within each functional group.
The most heterogeneous stand had the biggest
propor-tion of very large trees, and Reemer (2005) demonstrates
that an increase in the average age and size of trees plus
the conservation of old and dead trees results in the
spa-tial dispersion of hoverfly saproxylic species. Under-storey
tree and shrub species were also more varied in the most
heterogeneous than in the intermediate-heterogeneous
stand and above all in the least heterogeneous stand. This
diversity could explain the higher species richness of
aphi-dophagous and foliage or root-linked hoverflies we
record-ed in the most heterogeneous stand (Speight et al., 2013).
Only the most heterogeneous stand had a species-rich herb
layer. The presence of this layer could account on the one
hand for the richest and most abundant phytophagous and
zoophagous hoverfly communities, and, on the other hand,
for the richest and most abundant flower-visiting
commu-nities (Speight et al., 2013). Similarly, Fayt et al. (2006)
record that a well developed and species-rich herbaceous
plant layer in an open stand with large trees is the main
factor associated with the presence of saproxylic hoverflies
in beech and oak forests.
Functional diversity (FD) proved to be very
representa-tive of the general trend recorded for species richness and
abundance in the stands sampled, but FD decreased more
slowly than species richness. Although species richness
and FD are positively correlated (Petchey & Gaston, 2006)
the least heterogeneous stand had an intermediate FD since
most guilds and functional groups were recorded there.
The method we used to calculate FD does not account for
species abundance, which might partly ensure the
effec-tiveness of ecological services provided by the functional
group.
Perspectives for further research
This pilot study used a relatively small sample to explore
whether the structural heterogeneity of a stand influences
species richness or abundance of hoverflies at the stand
scale, focusing on both montane beech fir forest, which to
our knowledge has not been done in previous studies on
hoverflies, and variables that have rarely been used in
pre-vious studies, such as an accurate description of both
dead-wood items and tree-microhabitats. Unfortunately, the lack
of replication prevented us from fully analyzing the links
between factors that determine heterogeneity and hoverfly
assemblages, thus preventing the generalization of our
re-sults. However, since our results revealed big differences,
further biodiversity studies should be conducted in a larger
sample of stands, which should include replicate stands to
cover as far as possible the gradient of structural
heteroge-neity, as well as in other forest types, e.g. in lowland and/
or fragmented forests. We would recommend conducting
such surveys using emergence traps in addition to Malaise
traps. Since abundance was the most sensitive variable
as-sociated with structural changes recorded in this study, we
recommend that this variable be recorded in future
hover-fly surveys. Furthermore, as flowers appear to be a key
fea-ture, a more precise survey of the diversity of the shrub and
herbaceous plant layers should be conducted during the
pe-riod when hoverflies are sampled. Finally, even though our
sample did not allow us to highlight the role of deadwood
and tree-microhabitats as drivers of hoverfly diversity at
the stand level, we also recommend accurately recording
them in future studies, since the larval stages of many
hov-erfly species depend on them (Speight et al., 2013).
ConCluSion
Although most of the functional groups were recorded
in the three stands, species richness, abundance and
func-tional diversity decreased dramatically from the most
het-erogeneous to the least hethet-erogeneous stand. However, the
species assemblages in the less heterogeneous stands were
not perfect subsets of that in the most heterogeneous stand,
as some additional species not found in the most
heteroge-neous stand were also present. Further research is needed
to clarify which structural factors drive this decrease.
ACKNOWLEDGEMENTS. This study was financed with the help of European funds (FEDER) as well as French grants (Con-seil regional de Midi-Pyrénées, Con(Con-seil général des Hautes-Pyré-nées). We thank the owners of the forests, especially J.-L. Chaire, for their welcome, A. Delarue and B. Carrère for their help in the field, and P. Holder, D. Goodfellow and M. Hewison for checking the English. We wish also to thank C. Bouget, M. Deconchat, J. Beck and the two anonymous reviewers who provided construc-tive comments that helped us improve the manuscript.referenCeS
bardat J., bioret F., botineau M., bouLLet V., deLPech r., Géhu
J.M., haury J., Lacoste a., raMeau J.c., royer J.M., roux
G. & touFFet J. 2004: Prodrome des Végétations de France.
MNHN, Paris, 171 pp.
bitterLich W. 1984: The Relascope Idea: Relative Measurements
in Forestry. Commonwealth Agricultural Bureaux, Slough, 242
pp.
bLondeL J. & cuViLLier r. 1977: Une méthode simple et rapide
pour décrire les habitats d’oiseaux: le stratiscope. — Oikos 29: 326–331.
christensen M., hahn K., MountFord e., odor P., standoVar
t., rozenberGar d., diaci J., WiJdeVen s., Meyer P., Winter
s. & VrsKa t. 2005: Dead wood in European beech (Fagus syl-vatica) forest reserves. — Forest Ecol. Manag. 210: 267–282.
duPouey J.L., bachacou J., cosserat r., aberdaM s., VaLLauri
d., chaPPart G. & corVisierde ViLLèLe M.a. 2007: Vers la
réalisation d’une carte géoréférencée des forêts anciennes de France. — Le Monde des Cartes 191: 85–98.
EUFORGEN 2012: Distribution Map of Silver Fir (Abies alba)
and European Beech (Fagus sylvatica). http://www.euforgen.
org.
Fayt P., duFrene M., branquart e., hastir P., PonteGnie c.,
henin J.M. & Versteirt V. 2006: Contrasting responses of
long-horn beetles and hoverflies in Belgian deciduous forests. — J.
Insect Conserv. 10: 129–150.
FranK J. & VoLKMar W. 2006: Episyrphus balteatus: an example
of pollination efficiency in hoverflies. In: 91st Annual Meeting
of the Ecological Society of America (ESA), Memphis, Tennes-see, August 2006.
Gibson r.h., neLson i.L., hoPKins G.W., haMLett b.J. & MeM -Mott J. 2006: Pollinator webs, plant communities and the
con-servation of rare plants: arable weeds as a case study. — J.
Appl. Ecol. 43: 246–257.
GittinGs t., o’haLLoran J., KeLLy t. & GiLLer P.s. 2006: The
contribution of open spaces to the maintenance of hoverflies (Diptera, Syrphidae) biodiversity in Irish plantation forests. —
Forest Ecol. Manag. 237: 290–300.
Good J. & sPeiGht M.c.d. 1996: Convention relative à la conser-vation de la vie sauvage et du milieu naturel de l’Europe: Les invertébrés saproxyliques et leur protection à travers l’Europe.
Council of Europe, Strasbourg, 58 pp.
GreenberG c.h., McLeod d.e. & LoFtis d.L. 1997: An Old-growth Definition for Western and Mixed Mesophytic Forest.
USDA Forest Service, Asheville, 14 pp.
Groot M. & beVK d. 2012: Ecosystem services and phenology
of hoverflies (Diptera: Syrphidae) in a Slovenian forest stand. — Les (Ljubljana) 64: 123–128.
huMPhrey J.W., haWes c., Peace a.J., Ferris-Kaan r. & JuKes
M.r. 1999: Relationships between insect diversity and habitat characteristics in plantation forests. — Forest Ecol. Manag.
113: 11–21.
huston M.a. 1994: Biological Diversity. The Coexistence of
Spe-cies on Changing Landscapes. Cambridge University Press,
Cambridge, 681 pp.
JarLan a., de oLiVeira d. & GinGras J. 1997: Effects of Eri-stalis tenax (Diptera: Syrphidae) pollination on characteristics
of greenhouse sweet pepper fruits. — J. Econ. Entomol. 90: 1650–1654.
KeiL P. & KonVicKa M. 2005: Local species richness of Central
European hoverflies (Diptera: Syrphidae): a lesson taught by local faunal lists. — Divers. Distrib. 11: 417–426.
KeMbeL s.W., acKerLy d.d., bLoMberG s.P., WiLL K., corn -WeLL W.K., Peter d., coWan P.d., heLMus M.r., MorLon h.
& Webb c.o. 2014: Package ‘picante’. R Tools for Integrat-ing Phylogenies and Ecology Ver. 1.6-2. 56 pp. Available from
http://cran.r project.org/web/packages/picante/picante.pdf Larrieu L., cabanettes a. & deLarue a. 2012: Impact of
sylvi-culture on dead wood and on the distribution and frequency of tree microhabitats in montane beech-fir forests of the Pyrenee. — Eur. J. Forest Res. 131: 773–786.
Larrieu L., cabanettes a., brin a., bouGet c. & deconchat M.
2014: Tree microhabitats at the stand scale in montane beech-fir forests: practical information for taxa conservation in for-estry. — Eur. J. Forest Res. 133: 355–367.
Loreau M., naeeM s., inschausti P., benGtsson J., GriMe J.P.,
hector a., hooPer d.u., huston M.a., raFFaeLLi d., schMid
b., tiLMan d. & WardLe d.a. 2001: Biodiversity and
ecosys-tem functioning: Current knowledge and future challenges. —
Science 294: 804–808.
MCPFE 2007: State of Europe’s Forests. The MCPFE Report on
Sustainable Forest Management in Europe. Ministerial
confer-ence on the protection of forests in Europe, Warsaw, 263 pp.
MétaiLié J.P. 2001: Un patrimoine historico-environnemental:
Les forêts pastorales dans les Pyrénées. In: Paysages,
ter-ritoires et aménagement dans le sud de la France. Actes du 126ème congrés national des sociétés historiques et scienti-fiques, Toulouse. CTHS, Paris, pp. 33–47.
MüLLer J., brunet J., brin a., bouGet c., brusteL h., bussLer
h., Förster b., isacsson G., KöhLer F., Lachat t. & Gossner
M. 2012: Implications from large-scale spatial diversity pat-terns of saproxylic beetles for the conservation of European beech forests. — Insect Conserv. Div. 6: 162–169.
neLson e.h., hoGG b.n., MiLLs n.J. & daane K.M. 2012:
Syr-phid flies suppress lettuce aSyr-phids. — BioControl 57: 819–826.
niLsson s.G., niKLasson M., hedin J., aronsson G., GutoWsKi
J.M., Linder P., LJunGberG h., MiKusinnsKi G. & ranius t.
2002: Densities of large living and dead trees in old-growth temperate and boreal forests. — Forest Ecol. Manag. 161: 189–204.
oKsanen J., bLanchet F.G., Kindt r., LeGendre P., Minchin P.r.,
o’hara r.b., siMPson G.L., soLyMos P.M., steVens h.h. &
WaGner h. 2013: Package ‘vegan’. http://cran.r-project.org/
web/packages/vegan/vegan.pdf.
Petchey o.L. & Gaston K.J. 2006: Functional diversity: back to
basics and looking forward. — Ecol. Lett. 9: 741–758. r core teaM 2014: R: A Language and Environment for
Statisti-cal Computing. R Foundation for StatistiStatisti-cal Computing,
Vi-enna. URL http://www.R-project.org/.
reeMer M. 2005: Saproxylic hoverflies benefit by modern
for-est management (Diptera: Syrphidae). — J. Insect Conserv. 9: 49–59.
ricarte a., Marcos-Garcia M. & Moreno c.e. 2011: Assessing
the effects of vegetation type on hoverfly (Diptera: Syrphidae) diversity in a Mediterranean landscape: implications for con-servation. — J. Insect Conserv. 15: 865–877.
rotheray G.e. & GiLbert F. 2011: The Natural History of Hover-flies. Forrest Text, Ceredigion, 348 pp.
sMith h., chaney W. & bensen t. 2008: Role of syrphid larvae
and other predators in suppressing aphid infestations in organic lettuce on California’s Central Coast. — J. Econ. Entomol.
101: 1526–1532.
soMMaGGio d. 1999: Syrphidae: can they be used as
environmen-tal bioindicators? — Agric. Ecosyst. Environ. 74: 343–356.
soMMaGGio d. & burGio G. 2003: Role of Diptera Syrphidae as
landscape indicators: analysis of some case studies in Northern Italy. — Bull. OILB/SROP 26: 145–150.
sPeiGht M.C.D. 1989: Saproxylic Invertrebrates and their
Con-servation. Nature and Environment No. 42. Council of Europe,
Strasbourg, 79 pp.
sPeiGht M.c.d., casteLLa e. & sarthou J.P. 2013: StN 2013. In
Speight M.C.D., Castella E., Sarthou J.-P. & Vanappelghem C. (eds): Syrph the Net on CD, Issue 9. The database of European
Syrphidae. Syrph the Net Publications, Dublin.
therriauLt t.W. & KoLasa J. 2000: Explicit links among
physi-cal stress, habitat heterogeneity and biodiversity. — Oikos 89: 387–391.
tscharntKe t., cLouGh y., WanGer t.c. JacKson L., MotzKe i.,
PerFecto i., VanderMeer J. & Whitbread a. 2012: Global food
security, biodiversity conservation and the future of agricultur-al intensification. — Biol. Conserv. 151: 53–59.
Winter s. & MöLLer G.c. 2008: Microhabitats in lowland beech
forests as monitoring tool for nature conservation. — Forest
Ecol. Manag. 255: 1251–1261.
yachi s. & Loreau M. 1999: Biodiversity and ecosystem
produc-tivity in a fluctuating environment: The insurance hypothesis. — Proc. Natn. Acad. Sci. U.S.A. 96: 1463–1468.
tabLe S1. Scale of decay stages used to characterize dead wood items.
Decay stages Definitions
I Fresh deadwood (< 1 year), hard and not rotten. Phloem alive or at least perceptible. More than 95% of the bark is still attached to the stem. II 2–3 year old deadwood, still hard. Phloem dead and not perceptible. The knife blade enters maximum 1 or 2 cm, only parallel to the wood fiber. III Deadwood starts to get rotten. The outer wood is soft, the inner wood still not rotten. The bark is partially fallen down. The knife blade enters 3 to 5 cm, at least parallel to the wood fiber. No material loss (current volume = initial volume). IV Deadwood is clearly rotten. The knife blade enters up to hilt. Bark is mainly missing or bark is only soft and unconsoli-dated at stem. Material loss (current volume < initial).
V Wood almost disintegrated, very spongy or powdery, almost incohesive. Large loss of material. Presence in wood of species belonging to soil-dwelling fauna. tabLe S2. Groups of guilds (G) and types of functional groupings (FG) of hoverflies with their ecological significance in relation to
structural heterogeneity of stands. Guilds (G) and functional groupings (FG)
of hoverflies Ecological significance in relation to forest ecosystem characteristics G (1) – Strictly forest species
for the reproduction (strctF) For laying eggs, these species need to find appropriate microhabitats within a forest G (1’) – Optionally forest species
for the reproduction (facF) For laying eggs, these species need to find appropriate microhabitats within or outsidea forest G (1’’) – Strictly non forest species
for the reproduction (strctNF) For laying eggs, these species need to find appropriate microhabitats outside a forest G (2) – Strongly migrant species
(str.migrant) Species repeatedly recorded as undergoing migrational activity, they can look for trophic resources (both for adult and larval stages) far from their larval development place G (2’) – Weakly migrant species
(weak.migrant)
Species occasionally recorded as exhibiting migrational activity, they usually look for trophic resources (both for adult and larval stages) not so far from their larval develop-ment place
G (2’’) – Non migrant species
(non.migrant) Self explanatory, they usually look for trophic resources (both for adult and larval stages) not so far from their larval development place G (3) – Commensal species (C.COM) Species whose larvae are commensal within nests of some species of Aculeate Hymeno-ptera (bumble bees, wasps, ants) G (3’) – Non commensal species
(C.NONE) Self explanatory
FG (4’) – Zoophagous larvae (feeding
on living animals) (NL.LA) Species whose larvae are predatory of soft-bodied insects (mainly aphids and also cater-pillars, mealybugs, psyllids) FG (4) – Phytophagous larvae (feeding
in living plants) (NL.LP) Species whose larvae feed on the tissues of living, non-woody plants FG (4’’) – Saproxylic larvae (feeding on
decaying wood-related material) (NL.SAP)Species dependent upon dead or dying wood or upon the activities of other saproxylic insects. They participate in the organic matter and nutrient recycling. FG (5) – Adults feeding on pollen and
nectar gathered on flowers (NA.FLO) Self explanatory. These species need flowers within or in the close vicinity of their habi-tat, and they participate in the pollination of the plants visited. FG (5’) – Adults feeding on
(wind-trans-ported) pollen gathered on upper surface of leaves, or feeding on sap-runs (NA.OTH)
Self explanatory. These species do not need flowers within or in the close vicinity of their habitat, and they do not participate in the pollination of the plants visited.
tabLe S3. Main characteristics of stand structural heterogeneity; mean frequencies and standard errors into brackets.
Variables UnHarv100 UnHarv50Stands Harv
Base empty cavities ha–1 6.01 (1.06) 33.61 (6.91) 33.07 (13.0)
Trunk empty cavities ha–1 3.55 (2.14) 4.06 (2.16) 1.66 (1.66)
Base cavities with mould ha–1 15.58 (4.91) 3.13 (1.43) 9.47 (3.14) Trunk cavities with mould ha–1 13.45 (4.26) 12.14 (4.21) 8.39 (1.82)
Dendrothelms ha–1 7.7 (3.75) 21.52 (12.7) 60.84 (8.31) Cracks ha–1 3.96 (2.17) 4.32 (2.48) 2.34 (1.19) Saproxylic fungi ha–1 1.47 (0.81) 8.86 (2.19) 0.35 (0.35) Missing bark ha–1 9.69 (4.90) 76.2 (14.2) 82.68 (6.53) Logs (m3 ha–1) 20.6 (6.53) 37.5 (9.33) 3.79 (2.17) Snags (m3 ha–1) 16.5 (3.29) 16.7 (6.23) 0.21 (0.21) High stumps (m3 ha–1) 2.97 (0.70) 3.32 (0.57) 4.72 (0.60)
Deadwood decay stage 1 (m3 ha–1) 4.2 (2.35) 3.33 (2.61) 0 (0) Deadwood decay stage 2 (m3 ha–1) 3.8 (1.56) 19.7 (8.40) 0 (0) Deadwood decay stage 3 (m3 ha–1) 9.92 (4.77) 15.0 (4.03) 6.15 (1.91) Deadwood decay stage 4 (m3 ha–1) 13.41 (4.13) 14.8 (3.38) 2.57 (0.64) Deadwood decay stage 5 (m3 ha–1) 0.63 (0.44) 2.5 (1.85) 0 (0) Deadwood diversity (number of categories) 6 (0.82) 9.2 (1.05) 5 (0.65)
tabLe S4. Sample details per functional groups (FG) and guilds (G).
Category UnHarv100 UnHarv50 Harv Total
FG “Spp. with saproxylic larvae”: species – Both years 18 13 6 20
FG “Spp. with saproxylic larvae”: species – 2004 16 11 5 18
FG “Spp. with saproxylic larvae”: species – 2007 14 5 3 16
FG “Spp. with saproxylic larvae”: individuals – Both years 382 65 29 476
FG “Spp. with saproxylic larvae”: individuals – 2004 207 58 21 286
FG “Spp. with saproxylic larvae”: individuals – 2007 175 7 8 190
FG “Spp. with phytophagous larvae”: species – Both years 13 7 1 16
FG “Spp. with phytophagous larvae”: species – 2004 11 7 1 14
FG “Spp. with phytophagous larvae”: species – 2007 9 2 0 10
FG “Spp. with phytophagous larvae”: individuals – Both years 74 41 1 116
FG “Spp. with phytophagous larvae”: individuals – 2004 34 39 1 74
FG “Spp. with phytophagous larvae”: individuals – 2007 40 2 0 42
FG “Spp. with zoophagous larvae”: species – Both years 36 27 11 44
FG “Spp. with zoophagous larvae”: species – 2004 25 24 8 33
FG “Spp. with zoophagous larvae”: species – 2007 29 16 6 32
FG “Spp. with zoophagous larvae”: individuals – Both years 643 359 37 1039
FG “Spp. with zoophagous larvae”: individuals – 2004 397 313 23 733
FG “Spp. with zoophagous larvae”: individuals – 2007 246 46 14 306
FG “Spp. whose adults feed on flowers”: species – Both years 54 31 9 62
FG “Spp. whose adults feed on flowers”: species – 2004 42 28 8 51
FG “Spp. whose adults feed on flowers”: species – 2007 38 15 5 40
FG “Spp. whose adults feed on flowers”: individuals – Both years 523 207 28 758 FG “Spp. whose adults feed on flowers”: individuals – 2004 292 181 14 487 FG “Spp. whose adults feed on flowers”: individuals – 2007 231 26 14 271 FG “Spp. whose adults feed on others”: species – Both years 33 28 15 38
FG “Spp. whose adults feed on others”: species – 2004 25 25 9 29
FG “Spp. whose adults feed on others”: species – 2007 29 15 9 33
FG “Spp. whose adults feed on others”: individuals – Both years 1175 365 61 1601 FG “Spp. whose adults feed on others”: individuals – 2004 613 309 38 960 FG “Spp. whose adults feed on others”: individuals – 2007 562 56 23 641 G “Strictly forest spp. for reproduction”: species – Both years 3 0 0 3
G “Strictly forest spp. for reproduction”: species – 2004 1 0 0 1
G “Strictly forest spp. for reproduction”: species – 2007 3 0 0 3
G “Strictly forest spp. for reproduction”: individuals – Both years 8 0 0 8 G “Strictly forest spp. for reproduction”: individuals – 2004 1 0 0 1 G “Strictly forest spp. for reproduction”: individuals – 2007 7 0 0 7 G “Facultatively forest spp. for reproduction”: species – Both years 66 46 20 78 G “Facultatively forest spp. for reproduction”: species – 2004 50 42 14 63 G “Facultatively forest spp. for reproduction”: species – 2007 51 24 11 54 G “Facultatively forest spp. for reproduction”: individuals – Both years 1364 491 62 1917 G “Facultatively forest spp. for reproduction”: individuals – 2004 725 417 33 1175 G “Facultatively forest spp. for reproduction”: individuals – 2007 639 74 29 742 G “Strictly non forest spp. for reproduction”: species – Both years 21 14 4 23 G “Strictly non forest spp. for reproduction”: species – 2004 18 12 3 19 G “Strictly non forest spp. for reproduction”: species – 2007 15 6 3 18 G “Strictly non forest spp. for reproduction”: individuals – Both years 340 82 27 449 G “Strictly non forest spp. for reproduction”: individuals – 2004 185 74 19 278 G “Strictly non forest spp. for reproduction”: individuals – 2007 155 8 8 171
G “Strongly migrant spp.”: species – Both years 7 8 5 9
G “Strongly migrant spp.”: species – 2004 6 6 4 7
G “Strongly migrant spp.”: species – 2007 6 5 3 7
G “Strongly migrant spp.”: individuals – Both years 385 139 19 543
G “Strongly migrant spp.”: individuals – 2004 197 127 13 337
G “Strongly migrant spp.”: individuals – 2007 188 12 6 206
G “Weakly migrant spp.”: species – Both years 8 7 4 8
G “Weakly migrant spp.”: species – 2004 7 7 2 8
G “Weakly migrant spp.”: species – 2007 6 5 2 7
G “Weakly migrant spp.”: individuals – Both years 142 134 6 282
G “Weakly migrant spp.”: individuals – 2004 87 115 4 206
G “Weakly migrant spp.”: individuals – 2007 55 19 2 76
G “Non migrant spp.”: species – Both years 70 42 15 81
G “Non migrant spp.”: species – 2004 54 38 11 65
G “Non migrant spp.”: species – 2007 52 20 9 56
G “Non migrant spp.”: individuals – Both years 1131 288 64 1483
G “Non migrant spp.”: individuals – 2004 610 237 35 882
G “Non migrant spp.”: individuals – 2007 521 51 29 601
G “Commensal spp.”: species – Both years 3 1 1 4
G “Commensal spp.”: species – 2004 1 1 0 2
G “Commensal spp.”: species – 2007 3 0 1 3
G “Commensal spp.”: individuals – Both years 16 1 1 18
G “Commensal spp.”: individuals – 2004 5 1 0 6
G “Commensal spp.”: individuals – 2007 11 0 1 12
G “Non commensal spp.”: species – Both years 80 56 23 92
G “Non commensal spp.”: species – 2004 64 50 17 76
G “Non commensal spp.”: species – 2007 60 29 13 66
G “Non commensal spp.”: individuals – Both years 1679 567 88 2234
G “Non commensal spp.”: individuals – 2004 900 486 52 1438
Fig. S1. Dendrometrical structure of the three stands studied. UnHarv100 (= “Plagnet”): unlogged since 1900; UnHarv50 (= “Coume”): logged in 1950 and unlogged since; Harv (= “Seti”): logged regularly during the last 25 years. Dbh categories: 17.5 cm < small tree (ST) < 27.5 cm; medium tree (MT) < 47.5 cm; large tree (LT) < 67.5 cm; very large tree (VLT) ≥ 67.5 cm for broadleaved species, and 17.5 cm < ST < 27.5 cm; MT < 42.5 cm; LT < 62.5 cm; VLT ≥ 62.5 cm for conifers.
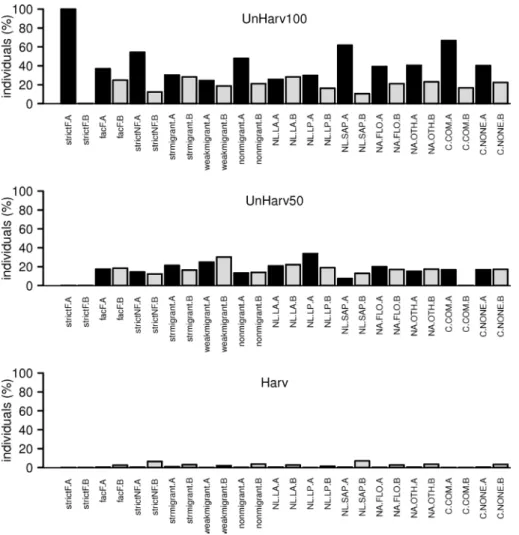
Fig. S2. Distribution per stand of the number of hoverfly individuals caught in 2004, expressed by the proportion of total amount per guild or functional group. strctF: strictly forest species for the reproduction, facF: optionally forest species for the reproduction, strctNF: strictly non forest species for the reproduction; str.migrant: strongly migrant species, weak.migrant: weakly migrant species, non.migrant: non migrant species; NL.LA: zoophagous larvae, NL.LP: phytophagous larvae, NL.SAP: saproxylic larvae; NA.FLO: adults feeding on pollen and nectar gathered on flowers, NA.OTH: adults feeding on pollen gathered on upper surface of leaves or feeding on sap-runs; C.COM: commensal species, C.NONE: non commensal species. See Table S2 for guild and functional group description. A and B indicate the sample split par Malaise.
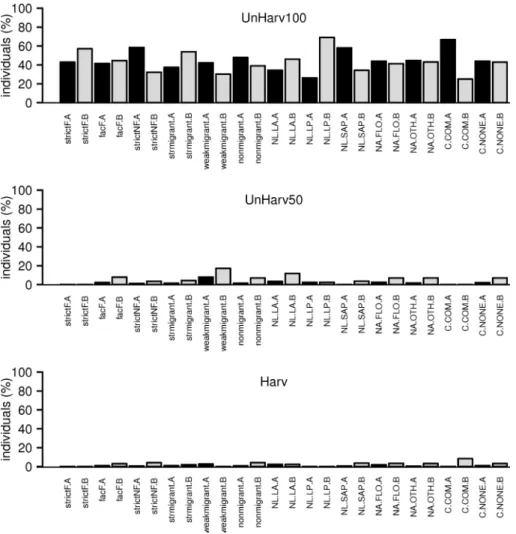
Fig. S3. Distribution per stand of the number of hoverfly individuals caught in 2007, expressed by the proportion of total amount per guild or functional group. strctF: strictly forest species for the reproduction, facF: optionally forest species for the reproduction, strctNF: strictly non forest species for the reproduction; str.migrant: strongly migrant species, weak.migrant: weakly migrant species, non.migrant: non migrant species; NL.LA: zoophagous larvae, NL.LP: phytophagous larvae, NL.SAP: saproxylic larvae; NA.FLO: adults feeding on pollen and nectar gathered on flowers, NA.OTH: adults feeding on pollen gathered on upper surface of leaves or feeding on sap-runs; C.COM: commensal species, C.NONE: non commensal species. See Table S2 for guild and functional group description. A and B indicate the sample split par Malaise.