1
Swimming behaviour and ascent paths of brook trout in a corrugated culvert 2 3 4 Elsa Goerig*1, 5 Normand E. Bergeron1 6 Theodore Castro-Santos2 7 8 1
INRS-Eau, Terre et Environnement, 490 rue de la Couronne, Québec, QC, 9
GlK 9A9, Canada. 10
2
USGS-Leetown Science Center 11
S.O. Conte Anadromous Fish Research Center. 1 Migratory way, Turners Falls, 12
MA, 01376. USA 13
14
*Author to whom correspondence must be addressed 15
Present address: 16
Harvard University, Department of Organismic and Evolutionary Biology, 17
Cambridge, MA, 02138, USA 18
Email: [email protected] 19
20
Keywords : culvert, fish passage, ascent paths, behaviour, Brook trout, 21
hydraulics, velocity preference 22
ABSTRACT 23
Culverts may restrict fish movements under some hydraulic conditions such as 24
shallow flow depths or high velocities. Although swimming capacity imposes limits to 25
passage performance, behaviour also plays an important role in the ability of fish to 26
overcome velocity barriers. Corrugated metal culverts are characterized by unsteady flow 27
and existence of low velocity zones, which can improve passage success. Here we 28
describe swimming behaviour and ascent paths of 148 wild brook trout in a 2 m section 29
of a corrugated metal culvert located in Raquette Stream, Québec, Canada. Five passage 30
trials were conducted in mid-August, corresponding to specific mean cross-sectional flow 31
velocities ranging from 0.30 to 0.63 m s-1. Fish were individually introduced to the 32
culvert and their movements recorded with a camera located above the water. Lateral and 33
longitudinal positions were recorded at a rate of 3 Hz in order to identify ascent paths. 34
These positions were related to the distribution of flow depths and velocities in the 35
culvert. Brook trout selected flow velocities from 0.2 to 0.5 m s-1 during their ascents, 36
which corresponded to the available flow velocities in the culvert at the low flow 37
conditions. This however resulted in the use of low-velocity zones at higher flows, 38
mainly located along the walls of the culvert. Some fish also used the corrugations for 39
sheltering, although the behaviour was marginal and did not occur at the highest flow 40
condition. This study improves knowledge on fish behaviour during culvert ascents, 41
which is an important aspect for developing reliable and accurate estimates of fish 42
passage ability. 43
INTRODUCTION 44
When moving in their natural habitat, fish may encounter challenging hydraulic 45
conditions at waterfalls, riffles, dams or culverts. These elements may act as barriers to 46
fish movements. Thus, culverts are ubiquitous structures that often limit fish upstream 47
movements due to outlet drops, shallow depths or flow velocities that exceed their 48
swimming capacity (Gibson et al. 2005, Goerig et al. 2016). Fish will usually use the 49
sustained swimming powered by their aerobic metabolism to swim against low to 50
moderate flow velocities. However, as velocity increases, they will transition towards 51
prolonged and sprint swimming modes relying on their anaerobic metabolism. These will 52
result in high swimming speeds that could only be maintained for a short period. 53
Passage success through culverts is a dynamic phenomenon influenced by 54
variables that fluctuate over time, and thus is difficult to predict. Because each culvert is 55
unique, relating the hydraulic conditions within the structure with the fish leaping and 56
swimming capabilities (Castro-Santos 2005, Kondratieff and Myrick 2006, Neary 2012) 57
is essential in order to predict passage. 58
However, behaviour and motivation can also be key elements in the ability of a 59
species to overcome a barrier. Under challenging conditions, fish may use various 60
strategies to save energy and avoid relying exclusively on their anaerobic metabolism, 61
which will result in rapid fatigue and eventual failure to pass upstream. They can either 62
use roughness elements such as baffles or corrugations to rest or low velocity zones and 63
vortices to achieve greater ascent distances under aerobic processes (Liao 2007, Liao et 64
al. 2003, Stringham 1924). These behaviours may be particularly important with respect 65
to culvert passage as they can increase the fish ability to pass a given structure (Behlke et 66
al. 1988, Goerig et al. 2016, Powers et al. 1997, Richmond et al. 2007). 67
Models used to predict passage (Furniss et al. 2008, Goerig et al. 2016) are 68
usually based on mean flow velocity, and ignore behavioral aspects of fish passage. If 69
fish select focal velocities lower than the mean cross-sectional velocity, passage success 70
will be underestimated. Accurate and reliable estimates of fish passage at culverts are 71
however of significant importance to the assessment of habitat fragmentation and 72
implementation of cost-effective mitigation measures. 73
Previous studies have attempted to define a correction factor to apply to the mean 74
velocity for swimming performance assessment and passage predictions through velocity 75
barriers (Behlke 1991, Castro-Santos 2005, Sanz-Ronda et al. 2015). Defining such 76
correction factor requires relating the fish ascent paths to the distribution of flow 77
velocities inside the barrier, in order to compare selected to available velocities and to 78
assess if fish select velocities similar to the mean cross-sectional one. By comparison to 79
studies conducted in experimental flumes, knowledge of actual ascent paths in culverts is 80
surprisingly limited, with only a few studies describing movements of individual fish 81
(Johnson et al. 2012, Peterson et al. 2013, Thurman et al. 2007). Such knowledge is 82
however important as experimental flumes, though convenient for studying fish 83
behaviour, do not truly mimic actual conditions prevailing in culverts. 84
Here we describe swimming paths of wild brook trout ascending a 2 m section of 85
a corrugated culvert in a field situation. We then model the effects of hydraulic and 86
biological factors (ex: fish length) on the extent to which fish exhibited energy-saving 87
behaviours. We hypothesize that small fish, as well as fish swimming against faster flow, 88
will select paths located within low-velocity zones. 89
METHODS 90
Study site 91
The studied culvert was located on Raquette stream, in the Saint-Louis River 92
watershed, in Québec (48°38’59’’N 70°55’22’’W). It was a 9 m long and 2.7 m diameter 93
steel culvert with a slope of 1.8% and helical corrugations (amplitude of 0.03 m, 94
wavelength of 0.15 m, and right-handed pitch of 5°, Manning’s n = 0.035). The water 95
temperature remained constant around 12 °C during the trials (mean=11.92, SD = 0.22), 96
which corresponds to the average stream temperature for August. 97
Fish capture 98
Wild brook trout were caught by electrofishing 0-500 m upstream of the studied 99
culvert (Smith-Root model 15-C, DC varying width pulses, voltage range: 800–1100 V, 100
frequency: 45/60 Hz, duty cycle range: 0.9%–72%). Fish were measured (total length, 101
mm) and weighed (wet mass, g) in a graduated container filled with water and previously 102
tared. They were then allowed to rest in an aerated bucket for ~ 5 min. Fish were handled 103
in conformance with the guidelines of the Canadian Council of Animal Care in science 104
(CCPA). 105
Video recordings 106
A single video camera (Gopro HD Hero 2011, 30 fps) was mounted 4 m from the 107
downstream extremity of the culvert, at a right angle above the water surface, in order to 108
record individual ascent paths and swimming behaviour. The camera field of view 109
(monitoring zone) was 1.5 m x 2 m, which encompassed the full wetted width of the 110
culvert (Figure 1). 111
Trout were individually tested in five passage trials conducted in mid-August. Each 112
trial corresponds to a single day when fish were tested under given conditions of flow and 113
water temperature. Trout were introduced 2 m from the downstream extremity by means 114
of a bucket filled with water and gently immersed in the culvert centerline, facing 115
upstream. We observed in preliminary tests that fish introduced in the culvert would 116
either start ascending the structure within one minute or exit downstream. Each fish was 117
thus recorded for a maximum of 3 min, which also allow the testing of 20 to 30 118
individuals during a given trial. After 3 min, if a fish had not ascended the monitoring 119
zone or returned downstream, it was removed from the trial to allow the testing of a new 120
individual. 121
Hydraulic data 122
Variability in hydraulic conditions during the trials was mostly due to natural 123
variation in discharge. However, a gate system was used upstream of the culvert, in order 124
to gain some control over the amount of flow entering the culvert. 125
Flow velocities were measured with a propeller-type velocimeter (Swoffer, model 126
3000) for each trial at three transects inside the culvert: one meter downstream and 127
upstream of the camera location and under the camera (Figure 1). At each transect, flow 128
depth and mean flow velocity were measured at 15%, 30%, 45%, 60%, and 75% of the 129
flow cross-section width. Depth was measured from the surface to the crest of the 130
corrugations, and the corrugation amplitude was considered as the boundary roughness 131
height. Velocity at each location was calculated by averaging instantaneous velocities 132
over a 30 s time interval, at two locations corresponding to 20% and 40% of flow depth 133
from the bottom of the culvert. The latter corresponds to the approximate mean flow 134
velocity on the vertical profile, according to the logarithmic distribution of velocities in 135
turbulent flows for open channels (Chow 1959, Von Karman 1931). 136
Additional points were also interpolated laterally using linear regression in order to 137
obtain a more complete distribution of flow depth and mean velocity in the transects. 138
Mean flow depth and velocity for the culvert were computed by averaging the mean 139
values for each transect. Flow depth and flow velocity distributions in the 2 m monitoring 140
zone were integrated from the measured and interpolated points on a 1 cm grid using 141
kriging interpolation with the octant method (Tecplot 360 2015 R1). For each location on 142
this grid, we obtained a value of flow depth and three values of flow velocity on the 143
vertical profile: surface, mid-depth and bottom (above the corrugations). 144
Video analysis 145
Ascent paths of fish were assessed by using a custom semi-automated digitizing 146
program written in Matlab (R2014a). As the fish was ascending the culvert, a point 147
corresponding to its center of mass was digitized at every 10 frames, corresponding to a 148
rate of 3 Hz. The center of mass of fish varies by species and is located at a rostral 149
distance of 25 % to 45 % of total body length (Xiong and Lauder 2014). For brook trout, 150
it corresponds to 37 ± 1.5 % of total body length (Goerig et al, unpublished data). Pixel 151
values were extracted, corresponding respectively to the longitudinal (x) and lateral (y) 152
position of the fish in the culvert. Due to deformation at the edges of the field of view, 153
ascent path were digitized for a zone of 1.2 m, instead of 1.5. For each trial, the 154
extremities and center of the wetted width at each corrugation crest (spaced 15 cm apart) 155
were used as landmarks to calibrate the field of view of the camera. The fish positions in 156
pixels were then translated to x-y spatial coordinates in cm by using a spatial 157
transformation (Matlab R2014a, image processing toolbox, cpt2form function). By 158
applying an inverse spatial transformation, we were able to infer pixel values for the 159
landmarks and estimate the positioning error inherent to the calibration method. 160
Individual ascent paths were superimposed on the distribution of depths and 161
velocities in the culvert. For each fish x-y position, we associated a value of flow depth 162
and mean flow velocity on the vertical profile. Distribution of available and selected flow 163
velocities were described by boxplots and probability density functions (PDFs). To look 164
for evidence of selection or avoidance of specific flow conditions, we computed the 165
difference between the PDFs of selected and available velocities. Positive values 166
indicated selection while negative values indicated avoidance. The ratios between the 167
flow velocities selected and the actual mean flow velocity in the culvert (‘velocity 168
preference ratio’) were computed and averaged for the ascent path of each fish. Transit 169
time was calculated as the time required to traverse the entire 200 cm-long field of view 170
of the camera. Fish swimming behaviour was also characterized into two gaits 1) 171
continuous swimming or 2) alternating continuous swimming with rest periods. 172
Statistical analysis 173
Ascent paths were analyzed to determine the extent to which fish selected reduced 174
flow velocities while ascending the culvert. A linear mixed model approach (R 3.2.0, 175
lme4 package, lmer function) was used to assess how the velocity preference ratio was 176
affected by the fixed effects mean flow depth, mean flow velocity, and fish length. This 177
modelling approach also included a random effect on trial in order to account for any 178
statistical dependence between the fish tested in the same trial (Quinn and Keough 2002). 179
Flow depth and flow velocity were correlated (R = -0.32), so an interaction term was 180
added when they were used together in the same model. The best-fitting model was 181
chosen among candidate models by minimization of the Akaike Information Criterion 182
(AIC). 183
RESULTS 184
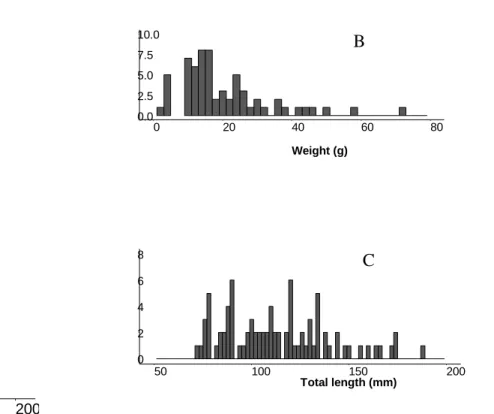
A total of 148 brook trout of total length 70-190 mm (mean = 114, SD = 27) and 185
weight 2-72 g (mean = 17, SD= 13) were tested in the five trials (Figure 2). They had a 186
mean condition factor (k = 105 × mass/length3) of 0.99 (SD =0.13). Among all fish tested, 187
86 trout ascended the monitored section of the culvert. Of these 86, 71 were characterized 188
as swimming continuously and 15 as alternating steady swimming with rest periods 189
involving minimal body motions and no forward progression. 190
The mean velocity conditions in the five trials ranged from 0.30 to 0.63 m s-1 and the 191
mean depth from 0.13 to 0.22 m (Table 1). Flow was always faster in the center of the 192
culvert and slower close to the side walls (Figure 3, upper panel). Due to the angle of the 193
corrugations, the reduced velocity zone was more pronounced along the right wall when 194
looking upstream. This is similar with observations from previous hydraulic studies in 195
corrugated culverts (Barber and Downs 1996, Richmond et al. 2007). However, this also 196
depends of the channel configuration at the inlet. Thus, in the first trial, the reduced 197
velocity zone was located more often along the left side wall. 198
The average positioning error of the fish in the culvert varied among trials, but was < 199
1 cm on both the x and y axis in all trials. Given the fact that flow depths and velocities 200
were integrated on a 1 cm grid, the risk of assigning a wrong depth or velocity to a fish 201
was therefore negligible. The ascent path pattern differed among individuals, but also 202
among trials (Figure 3, lower panels). In trials with the slowest mean velocities (trials A 203
& B; 0.30 and 0.33 m s-1), fish tended to occupy the center and right side of the culvert, 204
while at higher mean velocities (trials C & D; 0.38 and 0.45 m s-1) trout ascent paths were 205
more distributed in the cross-section, with a few fish also occupying the left side of the 206
culvert. In the trial with the highest mean flow velocity (trial E; 0.63 m s-1), trout were 207
ascending the culvert by swimming close to the side walls. In all trials except the latter, 208
some individuals stopped making forward progress and spent time in the lee of the 209
corrugations, as illustrated by aggregations of point perpendicular to the flow (Figure 3, 210
lower panel). The proportion of fish exhibiting this behaviour varied from 0 to 40% of the 211
ascending fish, depending of the trial. They had a significantly lower average body length 212
than fish making steady forward progress (97 mm ± 14 SD vs 117 mm ± 28 SD; t-test: t = 213
3, DF = 40 and p < 0.001). 214
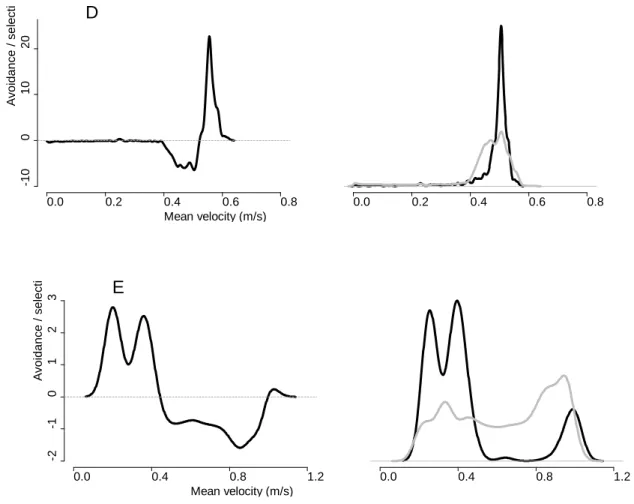
During their ascents, trout selected a median flow velocity of 0.40 m s-1, regardless of 215
the trial, with an interquartile range from 0.38 to 0.48 m s-1. For trials A, C and D, this 216
closely matched the distribution of available flow velocities (Figure 4, left panels). 217
During the 0.33 m s-1 trial (B) about half the fish preferred a reduced velocity zone. 218
During the 0.63 m s-1 trial (E) nearly all the fish selected lower velocities located near the 219
side walls of the culvert. 220
Comparing the probability density functions of selected and available velocities 221
allows identifying preference or avoidance of specific flow velocities (Figure 4, right 222
panels). Brook trout flow preference varied between the trials, with some of them 223
showing a multimodal distribution with more than one preferred flow velocity. Overall, 224
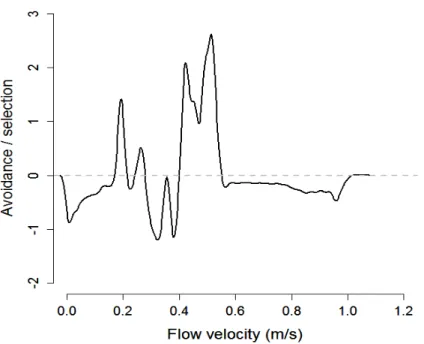
ascending fish selected flow velocities located between 0.2 and- 0.55 m s-1 and avoided 225
slower or faster velocities (Figure 5). 226
Fish selected flow velocities equal to or higher than the mean cross-sectional flow 227
velocity in the culvert for all trials, except the 0.63 m s-1 trial (Figure 5). In this trial, they 228
selected velocities ~ 40% lower than the mean cross-sectional velocity. 229
Among the nine models tested for the velocity preference ratio, only one emerged as 230
providing a good fit to the data (Table 2). This best-fitting model included only mean 231
flow velocity as a predictor, the velocity preference ratio decreasing when the mean water 232
velocity increased (Table 3). Fish were more inclined to select below-average velocities 233
when the mean cross-sectional velocity in the culvert was faster, especially above 0.5 m 234
s-1 (Figure 5). The variance of the random effect on trial was very small (0.004), 235
indicating little unobserved variability between trials. 236
Transit time, or the amount of time spent in the zone covered by the camera was 237
similar among trials and corresponded to a median value of ~ 12 seconds. The 238
distribution was positively skewed, with most individuals having short transit times and a 239
few ones having long transit times, up to 150 s. These individuals were present in every 240
trial, except the 0.63 m s-1 trial (E), and they correspond to trout alternating continuous 241
swimming with rest periods. 242
DISCUSSION 243
This study describes wild fish ascent paths in a corrugated metal culvert located in 244
their natural environment. Other studies have made visual observations of juvenile fish 245
swimming in culverts (Behlke et al. 1988, Blank 2008, Kane et al. 2000), although 246
without detailed descriptions of their ascent paths. This is however necessary to 247
understand fish hydraulic preferences and how these relate to hydraulic metrics 248
commonly used in fish passage models. Thus, despite the limited range of tested flow 249
velocities, we believe the present results bring an interesting insight on fish ascent 250
behaviour in culverts. 251
In the current study, trout exhibited preference for flow velocities located between 0.2 252
and 0.5 m s-1. Locations with flow velocities slower than 0.2 and higher than 0.5 m s-1 253
were rarely selected during the ascents. This may be due to distinct causes. At low flow 254
conditions, velocities > 0.2 m s-1 may be more attractive to trout and increase their 255
motivation to swim upstream. During the trials with mean flow velocities < 0.5 m s-1, fish 256
occupied a larger area of the flow cross-sectional area. At the highest flow, fish selected 257
locations with velocities below the mean cross-sectional velocity in the culvert, which 258
could indicate that the level of challenge was increasing. Movement was also more 259
directed, with no period of reduced activity in the corrugations. This may be a 260
behavioural response to a challenging environment, with fish altering their usual behavior 261
to expedite passage at fast flows. Paths were located close to the walls, in shallow depths. 262
For brook trout, the transition from sustained to prolonged swimming mode, and thus 263
from the aerobic to the anaerobic metabolism, occurs when the flow velocity is between 264
2.5 to 4 body lengths (Peake 2008). The mean fish length being 115 mm in the current 265
study, this transition should have occurred at ~ 0.45 m s-1. The behaviour observed in the 266
trial with the mean velocity of 0.63 m s-1 (E) may correspond to fish selecting locations 267
with slower velocities to avoid the transition to the anaerobic metabolism. Similar 268
behaviour was also observed in studies performed in an experimental culvert, where most 269
fish ascended the culvert by swimming close to the walls at higher discharge (Powers et 270
al. 1997, Thurman et al. 2007) or exit the culvert on the right side of inlet (Behlke et al. 271
1988, Kane et al. 2000), where the reduced velocities are usually located. The current 272
results however differed from Castro-Santos et al. (2013), where trout swam mostly 273
halfway between the center and the walls of a smooth open flume, at velocities close to 274
the mean cross-sectional channel velocity. That study was performed under high flow 275
velocities (1.6 to 2.5 m s-1), where fish used the prolonged or sprint mode, and results are 276
therefore hard to compare with those of the current study. 277
Mean transit time was consistent among trials, despite a twofold range of mean flow 278
velocity. Some individuals however used the lee of the corrugations, either to swim in 279
parallel with the small trough they created, or to hold position, with their body oriented 280
perpendicular to the flow. Similar behaviour was also observed in the study from Kane et 281
al. (2000). In the current study, all fish exhibiting periods with minimal body motions had 282
a total body length < 150 mm, and the spacing between the corrugations was also 150 283
mm, which may suggest a mechanistic influence on behaviour. Diameter of turbulent 284
eddies has been shown to scale with fish body size with regards to its effect on swimming 285
ability (Cotel et al. 2006, Tritico and Cotel 2010). Trout < 150 mm may be displaced by 286
large eddies while ascending the culvert, and thus more likely to seek shelter in the 287
corrugations. 288
A previous study (Goerig et al. 2016) indicated that passage success of brook trout 289
was higher in corrugated culverts (~ 75-90%) than in smooth ones (~30-50%) at flow 290
velocity of 1 m s-1. This could be explained by the higher hydraulic complexity in 291
corrugated culverts and the existence of reduced velocity zones which fish could use 292
during their ascents. The level and structure of turbulence may also be higher in 293
corrugated culverts (Richmond et al. 2007). Future studies on the structure of eddies 294
within and above corrugations would help to understand the biomechanical aspects 295
driving swimming and sheltering behaviours. 296
When modelling the effect of hydraulic or biological factors on the velocity 297
preference ratio, only the mean flow velocity in the culvert was retained as an 298
explanatory variable. Surprisingly, the fish body length was not retained as a predictor, 299
large trout being as likely to select reduced flow velocities as small ones. In the current 300
study, smaller trout were however more likely to use the corrugations as rest areas than 301
large ones. Velocity selection and sheltering are thus two discrete behaviours that may or 302
may not occur concurrently. 303
The current study shows that trout had a preference for velocities between 0.2 and 0.5 304
m s-1 and that they used velocities ~ 40% slower than the mean cross-sectional velocity in 305
the culvert when flow increased. This is similar to the 0.4 to 0.6 correction factor for the 306
mean velocity developed by Behlke (1991) for design and retrofit of culverts for Arctic 307
grayling. However, based on the results from the current study, this factor seems relevant 308
only when flow exceeds the sustained swimming ability of the fish. 309
The study has limitations because it monitored only a small area in the culvert over a 310
limited range of hydraulic conditions. However, the methods used can be applied easily 311
to a larger study, with an emphasis on testing a wider range of velocities, characterizing 312
flow turbulence and fish ascent paths along the entire culvert. The use of more advanced 313
videography methods (Hughes and Kelly 1996, Neuswanger et al. 2016) would also 314
allow describing the position occupied within the water column. Other factors that may 315
have effects on motivation, swimming ability or dispersal patterns, were not included in 316
this study. Recent studies on brook trout passage performance in culverts indicated that 317
spawning time and diel period both influence motivation to ascend culverts, while water 318
temperature has a non-linear effect on passage success, with an optimum in performance 319
around 14°C (Goerig et al. 2016, Goerig and Castro-Santos 2017). This temperature also 320
corresponds to the maximal aerobic capacity for brook trout (Tudorache et al. 2010). 321
Thus, it is possible that more fish would have ascended the culvert if the current study 322
was performed near spawning time, at dusk or during night. Conversely, fish would have 323
been less active or more susceptible to choose low velocity zones in the culvert at 324
temperatures < 14 °C. 325
CONCLUSION 326
Results from the current study apply to brook trout of 70 to 190 mm swimming in 327
corrugated culverts against mean flow velocities ranging from 0.30 to of to 0.65 m s-1. 328
They show that individual fish vary in their ascending behaviours, although they select 329
paths comprising low-velocity zones when the mean cross-sectional velocity in the 330
culvert increases above 0.5 m s-1. This is an important finding as it can help improving 331
accuracy of preference estimates and correction factors for use in predictive fish passage 332
models. Culverts with roughness elements such as corrugations may be favorable to fish 333
passage as they provide both low velocities pathways and sheltering options. 334
ACKNOWLEDGEMENTS 335
Support for this research was provided by INRS–Centre Eau, Terre et 336
Environnement, an NSERC discovery grant to N. Bergeron. the Ministère des Transports 337
du Québec, the Fonds de la Recherche forestière du Saguenay-Lac-Saint-Jean and 338
NSERC research scholarships to E. Goerig. Any use of trade, product, or firm names is 339
for descriptive purposes only and does not imply endorsement by the Canadian or US 340
governments. We thank the research assistants who helped conduct the field work: H. 341
Bouchard, F. Pichon and C. Larouche. We also extend special thanks to P. Marcotte for 342
his hard work with the experimental design and implementation of the study, F. Bérubé 343
and S. Dugdale for the development of a custom digitizing program, J. Noreika for his 344
generous assistance with the hydraulic data processing and S. Bayse and T. Dubreuil for 345
their help with the manuscript. 346
REFERENCES 347
Barber, M.E., and Downs, R.C. 1996. Investigation of culvert hydraulics related to 348
juvenile fish passage. No. WA-RD 388.2.
349
Behlke, C.E. 1991. Power and energy implications of passage structures for fish. 350
American Fisheries Society Symposium 10: 289-298. 351
Behlke, C.E., Kane, D.L., McLean, R.F., Reynolds, J.B., and Travis, M.D. 1988. 352
Spawning migration of Arctic grayling through Poplar Grove Creek culvert, 353
Glennallen, Alaska, 1986. Alaska Department of Transportation and Public 354
Facilities. Final Report No. FHWA-AK-RD-88-09. 355
Blank, M.D. 2008. Advanced studies of fish passage through culverts: 1-d and 3-d 356
hydraulic modeling of velocity, fish energy expenditure, and a new barrier 357
assessment method. PhD thesis. Montana State University. 358
Burham, K., and Anderson, D. 2002. Model Selection and Multivariate Inference: A 359
Practical Information–Theoretical Approach. Springer, New York. 360
Castro-Santos, T. 2005. Optimal swim speeds for traversing velocity barriers: an analysis 361
of volitional high-speed swimming behaviour of migratory fishes. J Exp Biol 362
208(3): 421-432. doi: 10.1242/jeb.01380. 363
Castro-Santos, T., Sanz-Ronda, F.J., and Ruiz-Legazpi, J. 2013. Breaking the speed limit 364
— comparative sprinting performance of brook trout (Salvelinus fontinalis) and 365
brown trout (Salmo trutta). Canadian Journal of Fisheries and Aquatic Sciences 366
70(2): 280-293. doi: doi:10.1139/cjfas-2012-0186. 367
Chow, V.T. 1959. Open-channel hydraulics. McGraw Hill Book Company. 368
Cotel, A.J., Webb, P.W., and Tritico, H. 2006. Do Brown Trout Choose Locations with 369
Reduced Turbulence? Transactions of the American Fisheries Society 135(3): 370
610-619. doi: 10.1577/t04-196.1. 371
Furniss, M., Love, M., Firor, S., Moynan, K., Llanos, A., Guntle, J., and Gubernick, R. 372
2008. FishXing, Version 3.0. US Forest Service, San Dimas Technology and 373
Development Center, San Dimas, CA. Also available at www. stream. fs. fed. 374
us/fishxing. 375
Gibson, R.J., Haedrich, R.L., and Wernerheim, C.M. 2005. Loss of Fish Habitat as a 376
Consequence of Inappropriately Constructed stream Crossings. Fisheries 30(1): 377
10-17. 378
Goerig, E., Castro-Santos, T., and Bergeron, N.E. 2016. Brook trout passage performance 379
through culverts. Canadian Journal of Fisheries and Aquatic Sciences 73(1): 94-380
104. doi: doi:10.1139/cjfas-2015-0089. 381
Goerig E & Castro-Santos T (2017) Is motivation important to brook trout passage 382
through culverts? Canadian Journal of Fisheries and Aquatic Sciences 0(0):1-9. 383
Hughes, N.F., and Kelly, L.H. 1996. New techniques for 3-D video tracking of fish 384
swimming movements in still or flowing water. Canadian Journal of Fisheries 385
and Aquatic Sciences 53(11): 2473-2483. 386
Johnson, G.E., Pearson, W.H., Southard, S.L., and Mueller, R.P. 2012. Upstream 387
Movement of Juvenile Coho Salmon in Relation to Environmental Conditions in a 388
Culvert Test Bed. Transactions of the American Fisheries Society 141(6): 1520-389
1531. doi: 10.1080/00028487.2012.699013. 390
Kane, D.L., Behlke, C.E., Gieck, R.E., and McLean, R.F. 2000. Juvenile fish passage 391
through culverts in Alaska: A field study. Alaska Department of Transportation 392
and Public Facilities. FHWA-AK-RD-00-03. 393
Kondratieff, M.C., and Myrick, C.A. 2006. How High Can Brook Trout Jump? A 394
Laboratory Evaluation of Brook Trout Jumping Performance. Transactions of the 395
American Fisheries Society 135(2): 361-370. doi: 10.1577/t04-210.1. 396
Liao, J.C. 2007. A review of fish swimming mechanics and behaviour in altered flows. 397
Philosophical Transactions of the Royal Society B: Biological Sciences 398
362(1487): 1973-1993. doi: 10.1098/rstb.2007.2082. 399
Liao, J.C., Beal, D.N., Lauder, G.V., and Triantafyllou, M.S. 2003. Fish Exploiting 400
Vortices Decrease Muscle Activity. Science 302(5650): 1566-1569. doi: 401
10.1126/science.1088295. 402
Neary, V.S. 2012. Binary Fish Passage Models for Uniform and Nonuniforms Flows. 403
River Research and Applications 28(4): 418-428. doi: 10.1002/rra.1564. 404
Neuswanger, J.R., Wipfli, M.S., Rosenberger, A.E., and Hughes, N.F. 2016. Measuring 405
fish and their physical habitats: versatile 2D and 3D video techniques with user-406
friendly software. Canadian Journal of Fisheries and Aquatic Sciences 73(12): 407
1861-1873. doi: doi:10.1139/cjfas-2016-0010. 408
Peake, S.J. 2008. Behaviour and passage performance of northern pike, walleyes, and 409
white suckers in an experimental raceway. North American Journal of Fisheries 410
Management 28(1): 321-327. doi: 10.1577/m06-260.1. 411
Peterson, N.P., Simmons, R.K., Cardoso, T., and Light, J.T. 2013. A Probabilistic Model 412
for Assessing Passage Performance of Coastal Cutthroat Trout through 413
Corrugated Metal Culverts. North American Journal of Fisheries Management 414
33(1): 192-199. doi: 10.1080/02755947.2012.750633. 415
Powers, P.D., Bates, K., Burns, T., Gowen, B., and Whitney, R. 1997. Culvert hydraulics 416
related to upstream juvenile salmon passage. Edited by W.D.o.F.a. Wildlife. 417
Quinn, G.P., and Keough, M.J. 2002. Experimental design and data analysis for 418
biologists. Cambridge University Press, New York. 419
Richmond, M.C., Deng, Z.Q., Guensch, G.R., Tritico, H., and Pearson, W.H. 2007. Mean 420
flow and turbulence characteristics of a full-scale spiral corrugated culvert with 421
implications for fish passage. Ecological Engineering 30(4): 333-340. doi: 422
10.1016/j.ecoleng.2007.04.011. 423
Sanz-Ronda, F.J., Ruiz-Legazpi, J., Bravo-Córdoba, F.J., Makrakis, S., and Castro-424
Santos, T. 2015. Sprinting performance of two Iberian fish: Luciobarbus bocagei 425
and Pseudochondrostoma duriense in an open channel flume. Ecological 426
Engineering 83: 61-70. doi: http://dx.doi.org/10.1016/j.ecoleng.2015.05.033. 427
Stringham, E. 1924. The Maximum Speed of Fresh-Water Fishes. The American 428
Naturalist 58(655): 156-161. 429
Thurman, D.R., Horner-Devine, A.R., Morrison, R.R., and Hotchkiss, R.H. 2007. 430
Juvenile Salmon Passage in Sloped-Baffled Culverts. Road Ecology Center. 431
Tritico, H., and Cotel, A. 2010. The effects of turbulent eddies on the stability and critical 432
swimming speed of creek chub (Semotilus atromaculatus). Journal of 433
Experimental Biology 213(13): 2284-2293. 434
Tudorache C, O'Keefe RA & Benfey TJ (2010) The effect of temperature and ammonia 435
exposure on swimming performance of brook charr (Salvelinus fontinalis). 436
Comparative Biochemistry and Physiology Part A: Molecular & Integrative 437
Physiology 156(4):523-528. 438
Von Karman, T. 1931. Mechanical similitude and turbulence. National Advisory 439
Committee on Aeronautics , Washington, DC 440
Xiong, G., and Lauder, G.V. 2014. Center of mass motion in swimming fish: effects of 441
speed and locomotor mode during undulatory propulsion. Zoology 117(4): 269-442
281. 443
TABLES 444
445
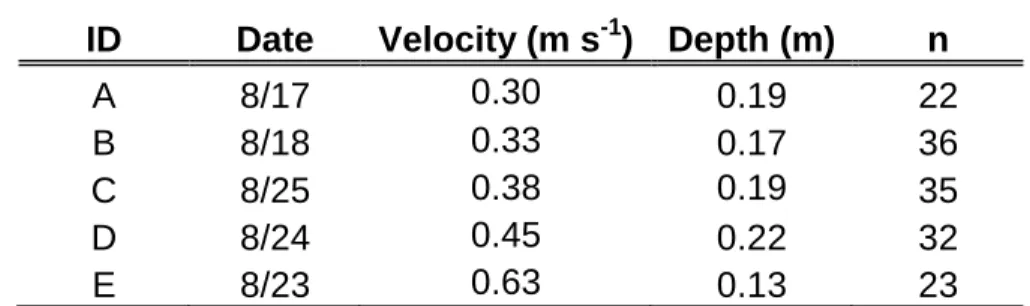
Table 1: Hydraulic conditions during trials 446
ID Date Velocity (m s-1) Depth (m) n
A 8/17 0.30 0.19 22
B 8/18 0.33 0.17 36
C 8/25 0.38 0.19 35
D 8/24 0.45 0.22 32
E 8/23 0.63 0.13 23
Note: Hydraulic conditions prevailing during the five trials. Velocity refers to the mean 447
cross-sectional flow velocity in the culvert, depth to the mean depth and n to the number 448
of fish individually tested during the trial. 449
Table 2: Model selection based on the Akaike information criterion (AIC) 450
451
Note: Subset of tested models (n = 9) showing the four models with the lowest−2 log 452
likelihood (penalized) and AIC values, as well as the null model. Explanatory variables 453
are mean flow velocity (m s-1), mean flow depth (cm) and fish body length (mm). RE 454
represents the random effects structure, K (df) the number of degrees of freedom in the 455
model, Δi AIC is the difference between AIC of modeli and AIC of the best model.
456
Akaike weight of modeli (wi) is interpreted as the probability that modeli is the best model
457
given the data. One model (in bold) emerged as providing the best fit to the data. 458
459
Model i RE -2 log (L) K AIC i Δ i AIC w i
Flow velocity (1 |Trial) -1.643 4 11.29 0.00 1.00
Flow depth (1 |Trial) -6.862 4 21.71 10.43 0.00
Flow velocity + body length (1 |Trial) -7.565 5 25.13 13.85 0.00
Fish length (1 |Trial) -11.146 4 30.29 19.01 0.00
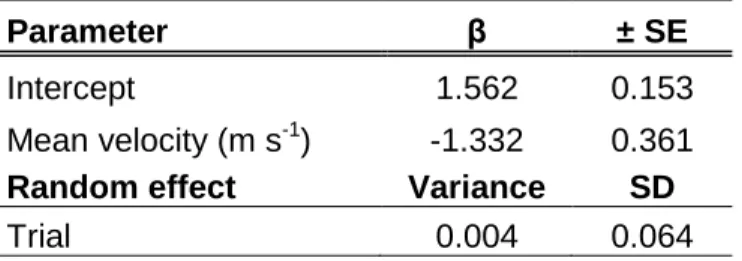
Table 3: Parameter estimates for the best-fitting model 460
Parameter β ± SE
Intercept 1.562 0.153
Mean velocity (m s-1) -1.332 0.361
Random effect Variance SD
Trial 0.004 0.064
Note: Estimates (β) and standard errors (± SE) of parameters for the best-fitting model for 461
the mean velocity preference ratio s estimated for all fish tested in the five trials (n = 87). 462
The velocity preference ratio is the ratio between the mean flow velocity selected by the 463
fish during its ascent and the mean cross-sectional flow velocity in the culvert. 464
0 20 40 60 80 100 150 200 Total length (mm) W ei ght ( g) 0 2 4 6 8 50 100 150 200 Total length (mm) FIGURES 0.0 2.5 5.0 7.5 10.0 0 20 40 60 80 Weight (g) A C B
Figure 2: Relationship between weight and total length (A), as well as distribution of weight (B) and total length (C) for the 86 tested fish.
0 30 60 90 120 0 50 100 150 Width (cm) Lengt h ( c m ) 0 30 60 90 120 0 50 100 150 Width (cm) Lengt h ( c m ) 0 30 60 90 120 0 50 100 150 Width (cm) Lengt h ( c m ) 0 30 60 90 120 0 50 100 150 Width (cm) Lengt h ( c m ) 0 30 60 90 120 0 50 100 150 Width (cm) Lengt h ( c m ) Trial A 0.30 m s-1
/ /
Trial B 0.33 m s-1 Trial C 0.38 m s-1/
Trial D 0.45 m s-1 Trial E 0.63 m s-1/
Figure 3: Distribution of flow velocities and depths (upper panels) and individual fish ascent paths (lower panels) in the zone covered by the camera, for the five trials ordered by increasing mean flow velocity. The boundary of the wetted width is indicated by 0 on the left side and by a grey vertical line on the right side. The number of ascending fish is indicated in the upper panels. Colors in the upper panels go from blue (0-0.4 m s-1) to red (0.8-1.0 m s-1). Colors in the lower panels identify ascent paths of individual fish. Lateral aggregations of points correspond to fish swimming or holding position in the lee of the corrugations, as it was the case for 40% (trial A), 31% (trial B), 16% (trials C & D) and 0% (trial E) of ascending fish.
Mean velocity (m/s) A v oi danc e / s el ec ti -5 15 30 45 60 0.0 0.2 0.4 0.6 A 0.0 0.2 0.4 0.6 Mean velocity (m/s) A v oi danc e / s el ec ti -1 0 1 2 3 4 5 0.0 0.2 0.4 0.6 B 0.0 0.2 0.4 0.6 Mean velocity (m/s) A v oi danc e / s el ec ti -1 .5 0 .0 1 .5 3 .0 4 .5 0.0 0.2 0.4 0.6 C 0.0 0.2 0.4 0.6
Figure 4: Left panels show the difference between the probability density functions (PDFs) of selected velocities and available velocities for the 0.30 m s-1 (A), the 0.33 m s-1 (B), the 0.38 m s-1 (C), the 0.45 m s-1 (D) and the 0.63 m s-1 trial (E). The PDFs of selected velocities are calculated based on velocities selected by ascending fish in each trial while the PDFs of available velocities included all velocities present in the culvert monitoring zone. Positive or negative values indicate selection or avoidance for specific flow conditions, respectively. For reference, right panels show the actual probability density functions of available (in grey) and selected (in black) flow velocities, for the trials A, B, C, D & E. Relative densities on the y-axis are not shown. The probability density function integrates to 1.
Mean velocity (m/s) A v oi danc e / s el ec ti -1 0 0 10 20 0.0 0.2 0.4 0.6 0.8 D 0.0 0.2 0.4 0.6 0.8 Mean velocity (m/s) A v oi danc e / s el ec ti -2 -1 0 1 2 3 0.0 0.4 0.8 1.2 E 0.0 0.4 0.8 1.2
Figure 5: Difference between the probability density functions of selected velocities and
available velocities, summarized for all trials. Positive or negative values indicate selection or avoidance for specific flow conditions, respectively.
Figure 6: Distribution of velocity preference ratios as a function of mean flow velocity in the culvert during the five trials. Box show the median and interquartile range while the whiskers show the 10th and 90th percentiles and points refers to outliers. The velocity preference ratio is the ratio between the mean flow velocity selected by the fish during its ascent and the mean cross-sectional flow velocity in the culvert.
0.0 0.5 1.0 1.5
0.3 0.33 0.38 0.45 0.63
Mean flow velocity (m/s)
V el oc it y p ref e re n