Hot-N-Cold model for energy aware cloud databases
16
0
0
Texte intégral
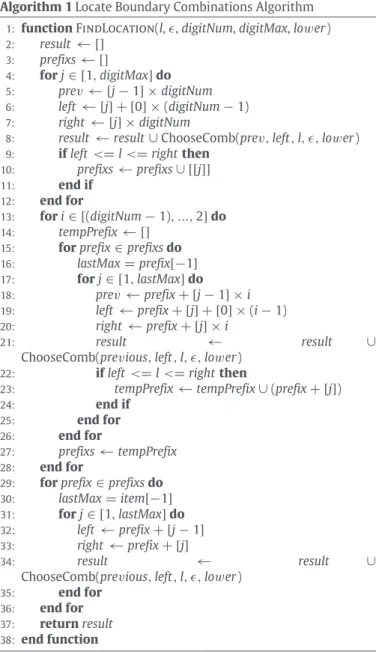
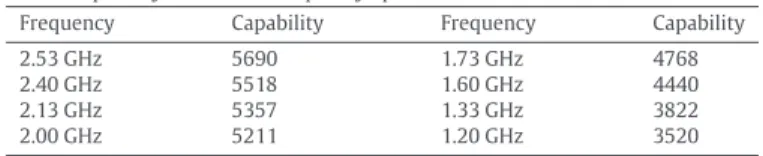
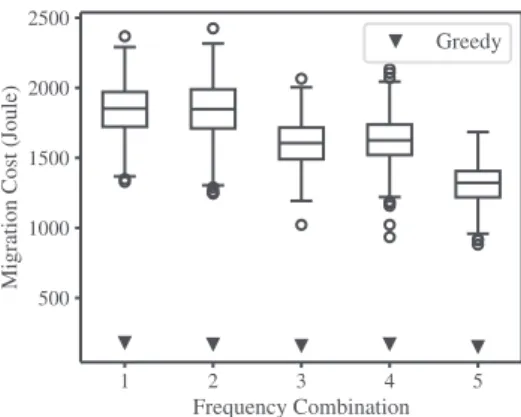
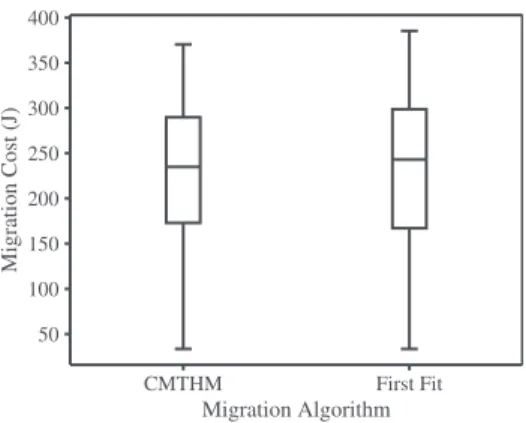
Figure

+3
Documents relatifs