OATAO is an open access repository that collects the work of Toulouse
researchers and makes it freely available over the web where possible
Any correspondence concerning this service should be sent
to the repository administrator:
[email protected]
This is an author’s version published in:
http://oatao.univ-toulouse.fr/21098
To cite this version:
Villeneuve, Kévin and Roizard, Denis and Remigy, Jean-Christophe
and Iacono, Marcello
and Rode, Sabine CO 2 capture by aqueous
ammonia with hollow fiber membrane contactors: Gas phase reactions
and performance stability. (2018) Separation and Purification
Technology, 199. 189-197. ISSN 1383-5866
CO
2
capture by aqueous ammonia with hollow fiber membrane contactors:
Gas phase reactions and performance stability
Kévin Villeneuve
a, Denis Roizard
a, Jean-Christophe Remigy
b, Marcello Iacono
b, Sabine Rode
a,⁎ aLaboratoire Réactions et Génie des Procédés (LRGP) (UMR 7274), Université de Lorraine, ENSIC, 1, rue Grandville – BP 20451, 54001 Nancy Cedex, France
bLaboratoire de Génie Chimique (LGC) (UMR 5503) INPT, UPS, Université de Toulouse, 118 route de Narbonne, 31062 Toulouse, France
A R T I C L E I N F O
Keywords: Membrane contactor CO2capture
Aqueous ammonia Ammonium salts precipitation Gas phase
A B S T R A C T
A critical challenge involved in developing membrane contactor technology for CO2capture by aqueous
am-monia is ensuring long-term performance stability in industrial application. When working at low temperatures and with dry inlet gas, this study demonstrates precipitation fouling due to crystallization of ammonium salts using a commercially produced composite membrane contactor (Oxyplus®). The fouling occurred on the lumen side of the membrane where the gas circulated. Experiments performed using a CO2/N2mixture saturated with
water vapor to mimic real flue gas, interestingly, showed stable performance and no fouling. Experiments were performed at different operating temperature. Under all conditions, with and without solid salt formation leading to fiber fouling, an aqueous solution formed inside the fiber lumen. In this solution, 76% of the ammonia leaking from the shell side and 12% of CO2feed was captured. The aqueous solution formed in the lumen can be
easily separated to recover the ammonia content, which under the tested conditions, resulted in lower ammonia loss than what would be expected in a packed column.
1. Introduction and literature survey
Global warming is mainly due to anthropogenic greenhouse gas emissions, mostly carbon dioxide [1]. Carbon Capture and Storage (CCS) is one of the solution accounted by the International Energy Agency in order to reduce the impact of human activities on the world climate. Using this technology may represent from 14% to 17% of CO2 emission reduction[2].
To date, the most mature technology for carbon capture relies on the absorption of CO2 into aqueous amine based chemical solvents. Monoethanolamine (MEA) is currently the leading industrial standard solvent for the CO2capture process. Once the carbon dioxide has been fully absorbed, the solvent is then regenerated by heat and the carbon dioxide gas is released. The minimum parasitic load to capture 90% of the CO2from a typical coal-fired power plant is about 4–4.5% of the net electrical output as measured from the same plant without capture. Capture by MEA without compression requires about five times this minimum energy with careful thermal integration into the power plant
[3]. The energy penalty is based primarily on the thermal energy re-quirements for solvent regeneration. Other solvents are currently being studied to reduce this energy penalty; ammonia is a promising alter-native and has started to be used by the chemicals industry in pilot plants and demonstration projects (Powerspan[4], Alstom[5]). Alstom
has launched plans to commercialize the Chilled Ammonia Process (CAP) by 2020[7]. Indeed, ammonia offers clear advantages: it requires less energy to regenerate than MEA, is relatively inexpensive, non-corrosive and chemically stable. Additionally, using ammonia allows for simultaneous absorption of multiple acid pollutants[6]. Drawbacks in developing the ammonia process, however, stem from its high vo-latility causing a high NH3slip within the treated gas and the fact that its kinetic absorption rate is lower than MEA. Performing CO2 absorp-tion with the chilled aqueous soluabsorp-tion in CAP can mitigate this volatility and reduce costs associated with ammonia make-up and gas treatment. The low operating temperature, however, leads to higher energy con-sumption.
Classical gas-liquid absorption technology based on packed columns promotes direct contact between flue gases and the solvent. A pro-mising alternative to packed columns is using hollow fiber membrane contactors (HFMC) which effectively reduce the size of the absorber unit due to the larger gas-liquid interfacial area (from 5000 to 20,000 m2/m3) compared with conventional packing (500 m2/m3), even if the presence of the membrane leads to an additional mass transfer resistance [8]. As the membrane acts to separate the two phases, there is no risk of flooding or foaming[9].
Typically, microporous membranes are used for the gas-liquid ab-sorption in membrane contactors but this type of membrane is
⁎Corresponding author.
E-mail address:[email protected](S. Rode).
susceptible to wetting phenomena. Long time scale experiments have shown that mass transfer resistance of the membrane will increase over time as the solvent gradually penetrates the membrane pores [10]. Given that the diffusion rate of carbon dioxide is lower in solvent-filled pores than in empty pores, one suggestion has been to use a dense thin-film composite membrane consisting of a dense layer supported by a microporous membrane. Thin, high CO2permeable dense layers should be used to obtain close values of the mass transfer coefficients of the coated and non-coated membranes. It has been reported that no wetting occurs for composite membranes exposed to MEA aqueous solutions
[11].
Up to now, only a handful of investigations have explored the po-tential of using membrane contactors for the ammonia based CO2 capture process[12–17]. The key findings of these investigations are listed in Table 1. Two of these investigations estimate the effect of membrane contactors on volume reduction ratio (i.e. intensification factor) compared to packed columns[16,13]. Accordingly, membrane contactor technology can be used to reduce the size of the absorption device by a factor of 3.5 with a HFMC made of polypropylene micro-porous membranes [16], up to 4× for commercial composite mem-branes and by a factor of 5 for composite memmem-branes fabricated in-house[13].
It has been reported that ammonia slip when using membrane contactors can be two orders of magnitude below that of ammonia slip in packed columns[16]. One investigation reported that ammonia slip was observed for between 28 and 55 kgNH3/ton of CO2removed using a fresh ammonia solution [13]. In contrast, a second study[18] re-ported a value of 58 kgNH3/tons of CO2for a packed column using a 0.31 molCO2/molNH3loaded 5% wt aqueous ammonia solution. Am-monia slip from a fresh solution will generally be higher than from a loaded solution which suggested that the membrane had effectively mitigated ammonia loss. For both of these works, two composite membrane contactors were used of which one had a dense layer se-lectively less permeable to NH3than to CO2[19]. This selective mem-brane did not reveal any improvement with regards to mitigating the ammonia slip.
The experimental studies conducted on membrane contactors for CO2 absorption in aqueous ammonia have revealed that a rapid de-crease of the CO2flux occurs only after a short operation time. When using a microporous membrane contactor, several experiments revealed that reaching steady state conditions proved difficult during the ab-sorption process itself[12–15]. This may be related to the precipitation of ammonium salts at the pore-mouth of the membrane. When using a composite or dense membrane, the CO2flux was stable during a short period but then decreased after less than one hour[12,14]. The authors suspected that lumen side crystallization of ammonium salts had oc-curred in the gas phase. These reports of unstable performance have, to date, prevented ammonia based CO2capture technology using hollow fiber membrane contactors from being scaled up and commercialized. The present work aims to explain the mechanism behind rapid de-creases in CO2flux reported in experimental data and literature. Most of the experimental studies performed thus far investigating membrane
contactors for CO2absorption in a chemical solvent have been per-formed using a dry mixture of CO2and an inert gas, whereas, within the context of industrial application, the flue gas entering the membrane contactor would be saturated with water vapor. We have therefore fo-cused on describing experiments performed with vapor saturated inlet gas, which highlight the impact of water content in the gas mixture on the overall CO2capture efficiency.
2. Chemistry of the NH3-CO2-H2O system 2.1. Liquid phase
In aqueous solution, NH3, H2O and CO2dissociate as follows[20]:
⇔ ++ − 2H O2 H O OH K 3 1 (2.1) + ⇔ ++ − NH3 H O2 NH OH K 4 2 (2.2) + ⇔ −+ + CO2 2H O2 HCO H O K 3 3 3 (2.3) + ⇔ + − − + HCO3 H O2 CO H O K 3 2 3 4 (2.4) Ammonia and bicarbonate ions form carbamate ion and water:
+ −⇔ −+ NH3 HCO3 NH COO H O K 2 2 5 (2.5) Precipitates may be formed from these ionic species such as am-monium carbamate, amam-monium bicarbonate, amam-monium carbonate monohydrate or ammonium sesquicarbonate:
+ ⇔ − + NH COO2 NH4 NH COONH (s) K 2 4 6 (2.6) + ⇔ + − s NH4 HCO3 K NH HCO ( )4 3 7 (2.7) + + ⇔ + − 2NH4 CO32 H O (NH ) CO . H O(s) 2 K 4 2 3 2 8 (2.8) + + ⇔ + − − 4NH4 CO32 2HCO (NH ) CO . 2NH HCO (s) 3 K 4 2 3 4 3 9 (2.9) 2.2. Gas phase
In the gas phase, CO2and NH3can react to form carbamate which can then be hydrolyzed to form bicarbonate as described hereafter[21]:
+ ⇐⇒ CO2 (g) 2NH3 (g) NH COONH (s) K 2 4 10 (2.10) ⇔ + +
( )
NH COONH CO 2H O 2NH HCO (s) l 2 4(s) 2(g) 2 g K11 4 3 (2.11) The equilibrium of ammonium bicarbonate solid salts with the three gas compounds can be written as:+ + ⇐⇒ NH3 (g) CO2 (g) H O2 (g) NH HCO (s) K 4 3 12 (2.12) The formation of ammonium salts in the gas phase has been ex-perimentally proven[21]. Indeed, these authors demonstrated that the Nomenclature
d diameter (m) F molar flow (mol/s) H Henry constant (atm)
K reaction equilibrium or solid salt formation constant (-) L fiber length (m)
Leak ammonia leak (kgNH3/ton of CO2captured) P pressure (bar)
T temperature (K) y gas molar fraction (-)
η CO2capture efficiency (%) v gas interstitial velocity (m/s) µ dynamic viscosity (Pa.s) Subscript
G gas
in entrance of the membrane contactor L liquid
M-int internal surface of the hollow fiber out outlet of the membrane contactor
Table 1
Review of ammonia based CO2 capture studies using membrane contactors. Membrane - type
(Furnisher)
Gas Mixture Ammonia concentration – Initial loading – flow configuration
G/L
(mass superficial flows)
Salts precipitation Liquid /gas side
Main findings Year Ref.
PP – microporous (3 M Membrana GmbH), PP + PMP – composite (3M Membrana GmbH), PP + Teflon AF 2400 - composite (In house) 15% molar of CO2in N2 1-3-5 wt% NH3solution– unloaded – counter-current 50–140 Gas side
Lumen side precipitation of ammonium salts
Stable performance (for roughly one hour) was obtained with composite HFMC but not with microporous HFMC. High intensification potential and NH3slip mitigation was
observed for HFMC compared to packed columns.
2014 [13,12] PP – microporous (3M Membrana GmbH) 40% molar of CO2in CH4 0.1 à 5 wt% NH3solution – unloaded – co-current 200–1100 Liquid side Ammonium bicarbonate crystallization mostly on the membrane surface
The authors report a volume reduction factor of 3.5 compared to a packed column. The ammonia slip measured is two orders of magnitude below that estimated in packed columns. 2014 [16] PP – microporous 20% molar of CO2in N2 3 à 8 wt% NH3solution– unloaded – counter-current
110–500 Not applicable Modeling only
2D isothermal model developed.
Modeling validated with DEA experiments. Comparison made between two solvents NH3and DEA.
2014 [17]
PTFE – microporous (Markel), PDMS – dense 50% molar of CO2in CH4 3 à 12 wt% NH3solution– unloaded – counter-current 10 – 500 Liquid side Ammonium bicarbonate crystallization Gas side
Lumen side precipitation of ammonium salts until lumen blockage (room temperature)
Lumen side crystallization with PTFE leads to the blockage of the lumen after less than one minute for 8.5 and 5%wt NH3solutions and the CO2flux is divided by 2 for 3%wt
NH3solutions.
Lumen side crystallization also observed with non-porous PDMS HFMC (CO2flux reduced after 800 s).
2015 [14]
PTFE (In house) 10, 15 or 20%
molar of CO2in
air
1 to 5 wt% NH3solution – 0.1
to 0.3 molCO2/molNH3–
counter-current
10–65 Gas side
Ammonium salt precipitation observed on the outer surface of the membrane (shell side)
Similar performances obtained with NH3or MEA as solvent
Performances are stable for one hour, followed by a sharp decrease in CO2 flows, measured as 45% of the initial flow after 10 h. This important drop is attributed to ammonium salt precipitation on the membrane surface.
CO2from a synthetic flue gas (15/85 CO2/N2mixture saturated with water vapor) could be removed via the formation of solid NH4HCO3 through ammonia carbonation in the gas-phase reaction. They used a semi-continuous flow reactor which allowed for direct contact between the flue gas and gaseous ammonia at room temperature and atmo-spheric pressure[21].
Solid carbamate and bicarbonate ammonium equilibrium constants are given as follows:
= K P P P 10 CO NH2 0 3 2 3 (2.13) = K P P P P 12 CO NH H O 0 3 2 3 2 (2.14) where PCO2, PNH3and PH2Orepresent partial pressures of the indicated components and P0the standard pressure (equal to 1 bar).
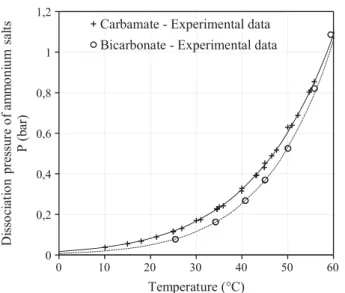
Several experiments have been conducted aimed at measuring the pressure of dissociation of ammonium carbamate Pcarbamate and bi-carbonate Pbicarbonate as a function of the temperature, as shown in
Fig. 1 [22–25]. The following expressions of the pressure of dissociation were obtained according to regressions with the corresponding ex-perimental data: = − logP 8.25 2737 T carbamate (2.15) = − logP 9.75 3241 T bicarbonate (2.16)
Experiments were performed without inert gas so that the pressure measured corresponded to the sum of the partial pressures of the re-active species. Thus, ammonium salt solid equilibrium constants can be obtained as a function of the pressure P measured:
= K 4 27 P P 10 carbamate 3 0 3 (2.17) = K 1 9 P P 12 bicarbonate 3 0 3 (2.18)
The dissociation constants are obtained from the dissociation pres-sure values and presented inFig. 2.
In the case of a gas mixture containing CO2and NH3, solid ammo-nium carbamate salts appear when the product of the partial pressure of the two gases exceeds or equals the dissociation constant K10 at the temperature of the reacting mixture. If water is present, the ammonium
carbamate can be hydrolyzed in ammonium bicarbonate according to Eq.(2.11).
Ammonium carbamate or bicarbonate dissociate when the products of the partial pressures of NH3, CO2and H2O are below their respective dissociation constant K10or K12.
3. Materials and methods 3.1. Membrane contactor
A membrane contactor with a commercially produced composite membrane (Oxyplus®) was used for the experimental study. The membrane is made of a thin dense layer of poly (4-methyl-1-pentene) supported by a microporous support of polypropylene. Modules were made of PVC and were filled with fibers. The geometrical character-istics of the modules used in this work are provided inTable 2. 3.2. Experimental setup
The experimental setup used is represented inFig. 3. Two Mass Flow Controllers (MFC, Bronkorst El-Flow Select) controlled theflow rate of nitrogen and carbon dioxide respectively in order to obtain a gas mixture with 15% of CO2and to set the gas flow inside the lumen of the fibers. The molar fraction of CO2was verified before each experiment using an infrared analyzer MGA 3000 (Gruter and Marchand). A peri-staltic pump (Watson and Marlow 314D) was used to circulate a fresh (unloaded) 5 wt% aqueous ammonia solution (prepared from a dilution of a 25 wt% ammonia solution from Sigma-Aldrich). We used a ther-mostatic chamber to fix the temperature throughout the experiment. The liquid temperature was measured using thermocouples at the inlet and the outlet of the contactor, and the gauge pressure at the gas inlet was measured with a manometer. No temperature differences were noticed between the inlet and the outlet.
We were able to humidify the gas stream before it entered the
0 0,2 0,4 0,6 0,8 1 1,2 0 10 20 30 40 50 60
Di
ss
o
ci
at
io
n
pr
es
sur
e
o
f
am
m
o
ni
u
m
s
al
ts
P
(
b
ar
)
Temperature (°C)
Carbamate - Experimental data
Bicarbonate - Experimental data
Fig. 1. Dissociation pressure of ammonium carbamate and bicarbonate as a function of the temperature. Dot represent experimental data[22–25]and lines are regressions.
0,0000001 0,000001 0,00001 0,0001 0,001 0,01 0,1 1 0 20 40 60
E
qui
li
b
ri
u
m
c
o
n
st
an
t
K
(
-)
Temperature (°C)
Carbamate - K_10 Bicarbonate - K_12 Carbamate - K_10 Bicarbonate - K_12Carbamate and
bicarbonate ammonium
solid salts
No solid salts
Bicarbonate
ammonium solid salts
Fig. 2. Equilibrium constant of ammonium carbamate and bicarbonate as a function of temperature calculated from Eqs.(2.17) and (2.18).
Table 2
Membrane modules characteristics.
Membrane material Oxyplus® Module internal diameter, cm 1.3 External fiber diameter, µm 380 Internal fiber diameter, µm 200 Dense layer thickness, µm 0.1 Active fiber length, cm 25 Total fiber length, cm 27 Number of fibers 54 Packing fraction, % 4.6
membrane contactor as illustrated inFig. 3. In this scenario, the gas mixture of CO2/N2flowed through the lumen of the fibers of a first membrane contactor with high gas residence time, effectively facil-itating full saturation. Hot water was circulated on the shell side with a membrane pump. The temperature of the water was set higher than the thermostatic chamber temperature to ensure that saturation of the gas occurred before it entered the absorption contactor. The excess water vapor collected in a condensation trap is not represented inFig. 3. We verified relative humidity of the gas before it entered the absorption contactor using a thermo-hygrometer T3511P (Comet). The error range of the hygrometer was lower than 5%, relative humidity was measured as between 98 and 100%.
3.3. Experimental conditions
The conditions tested are summarized in theTable 3.
A summary of the experiments performed together with thermo-static chamber temperatures and flow rates are shown inTable 4.
The liquid flow rate was fixed in order to obtain liquid to gas mass flow rate ratios higher than 50. A resulting excess of ammonia causes only scarce variation of the liquid side composition. In addition, the overall behavior of the system is isothermal. While these conditions would be counterproductive in industrial applications where the ob-jective is to increase ammonia conversion at lower temperatures to reduce costs of the energy intensive regeneration step, for our purposes they facilitate analysis.
3.4. Analysis of the outlet gas composition
Molar fractions of CO2and NH3contained in the gas phase were measured using an infrared analyzer, the error range of these mea-surements was of about 5%. We then neutralized the gas in sulfuric acid. The capture efficiency ηCO2,total (%) was determined using the following formula: = ∗ − − − − η 100 F F F CO2,total
CO2,G in CO2,lumen outG
CO2,G in (2.19)
where FCO2G-inis the molar flow rate of CO2entering the contactor and FCO2,lumen-outGis the molar flow rate of CO2 at the gas-phase outlet calculated with the molar fractions yCO2 and yNH3 measured by the infrared analyzer. = − − − − F F y 1 y y y
CO2,lumen outG N2 CO2
CO2 NH3 H2O (2.20)
An aqueous solution was formed in the gas phase, which could be saturated with ammonium salts. We placed a glass trap at the gas outlet to capture this solution containing ammonia and carbon dioxide under different forms. Depending on operating conditions, aqueous solutions with or without solid salts were obtained. The solutions were trapped at the gas outlet and collected at the end of each experiment. To perform mass balance on these two species during the absorption process, we determined the respective quantities of CO2and NH3. The solution was weighed and stored at 4 °C before being analyzed. When visible pre-cipitates formed inside the solution, we diluted the entire solution 10 times before preparing the samples for analysis.
200–1000 µL of the solution was collected with a micropipette and added to a volumetric flask previously weighed and partially filled with milliQ-water to limit ammonia evaporation, which we then filled. The prepared solution was then filtered with a 0.45 µm syringe filter (Acrodisc® 25 mm) before analysis using a TOC-TN Shimadzu analyzer. This device provided us with the content levels of carbon and nitrogen in the sample allowing us to calculate specific concentrations of CO2 and NH3.
4. Results and discussion 4.1. Dry inlet gas experiments
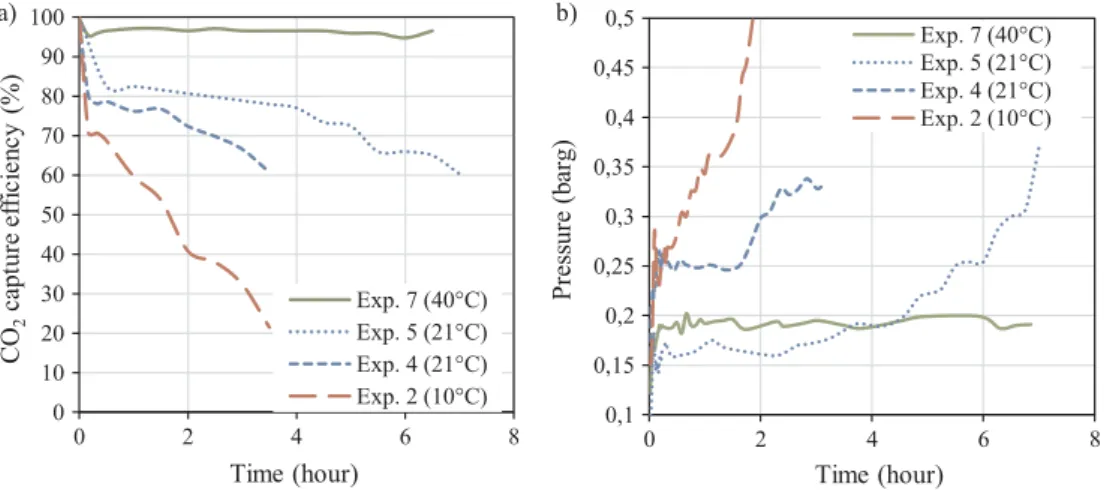
Fig. 4illustrates the time variation of the CO2capture efficiency (Fig. 4a)) and of the lumen side pressure drop (Fig. 4b)) for dry inlet gas experiments. For Experiments 2, 4 and 5, the CO2capture efficiency decreased during the first hours (Fig. 4a)). During this time, the pres-sure in the gas line increased (Fig. 4b)). The capture efficiency de-creased from 70 to 20% at 10 °C (Experiment 2) and from 82 to 60% at 21 °C (Experiment 5) while at the same time an increase in pressure occurred from 0.25 to 3 bars at 10 °C and from 0.17 to 0.37 bars at 21 °C. No drop in capture efficiency was observed at 40 °C (an average of 96.5%) and the pressure in the gas line remained stable.
Membrane contactor Humidifier 15 % CO2 85 % N2 TOC-TN analyzer IR analyzer By-pass N2 H2O CO2 NH3 Rich solution Poor solution T %RH T T Thermostatic chamber P Gas Liquid from the gas line
Fig. 3. Experimental setup. P, T and %RH stand for the manometer, the temperature sensor and the hygrometer respectively.
Table 3
Summary of the experimental conditions tested. Temperature of the thermostated chamber,
°C
10, 21, 40 Inlet gas velocity, m/s 1.3 – 1.6 – 2 Molar fraction of CO2 at the gas inlet (dry
basis),%
15
Mass fraction of ammonia in the solvent,% 5 (unloaded solution, i.e. 0 molCO2/molNH3)
Inlet gas relative humidity,% 0–100
Table 4
Detailed experimental conditions. Experiment label T Inlet gas flow
rate (dry basis)
Inlet liquid flow rate
Humidity content of the gas inlet – °C NmL/min mL/min Dry/saturated (relative
humidity,%) 1 10 200 12 Saturated (100) 2 10 200 Dry (0) 3 21 200 Saturated (100) 4 21 200 Dry (0) 5 21 133 Dry (0) 6 21 133 Saturated (100) 7 40 133 Dry (0)
Experiments 4 and 5 were carried out under the same conditions with the exception of changes to gas flow rate. For Experiment 5, capture efficiency was higher due to the lower gas flow rate whereas the pressure drop was lower. This outcome was consistent with the fact that lower flow generally corresponds to lower interstitial velocity and effectively cause the contact time between liquid and gas to increase.
The pressure variation in the gas stream corresponded to the var-iation of the pressure drop observed in the lumen side of the membrane contactor. Internal (or lumen) pressure drop for HFMC systems can be determined using the Hagen-Poiseuille equation:
= − µvL ∆ P 32 d total M int 2 (2.21)
The increase in pressure drop ΔP can be explained by a decrease of the available gas-flow section. As discussed in Section 2.2, ammonia, carbon dioxide and water can react in the gas phase to form ammonium salts. It is therefore possible that the growth of these salts may likewise cause partial obstruction of the lumen in the fibers and lead to an in-crease in interstitial gas velocities v. As such, the contact time between the liquid and gas will decrease and lead to a drop in capture efficiency. Temperature influences stability in the rate of both, capture effi-ciency and corresponding drops in pressure. Higher temperature result in greater stability. This is related to the dissociation constant K10of ammonium bicarbonate and K12of carbamate in the gas (Section2.2) which significantly increase between 10 and 40 °C, from 8.5 ∗ 10−6to 5.15 ∗ 10−3(seeFig. 2).
4.2. Reversibility of the fouling
The fouling which lead to a gradual decrease of the capture effi-ciency presented in the previous section is reversible. To unclog the fiber lumen between each experiment, pure nitrogen was fed into the lumen side of the fibers while water at 30 °C was fed into the shell side until the gas pressure returned to its initial value. This is illustrated in
Fig. 5where fouling which occurred in Experiment 2, during which the pressure increased to 3 bars in the gas line, had totally reversed in less than an hour as shown in the pressure drop decrease from 3 to 0.15 bar. Ammonium salts decomposed when in contact with pure nitrogen and maintained the gas-solid equilibrium described in Section2.2. The flow of nitrogen consistently removed the ammonia and carbon di-oxide, which allowed the salts to decompose until they had disappeared completely. The high temperature, i.e. 30 °C, led to high decomposition kinetics and high dissociation constants, which both facilitated the unclogging process.
4.3. Saturated inlet gas experiments
Fig. 6illustrates the time variation of the CO2 capture efficiency
(Fig. 6a)) and of the lumen side pressure drop (Fig. 6b)) for saturated inlet gas experiments. In conditions where the gas was saturated with water at the inlet, the CO2 capture efficiency remained stable throughout the duration of the experiments; for 5.5 h during Experi-ments 3 (79%) and 1 (67%), and for 7 h in Experiment 6 (83%). The inlet pressure remained stable at 0.18 barg for Experiment 6 for all 7 h. The inlet pressure dropped slightly for Experiments 1 and 3 in the two first hours before stabilizing at 0.25 barg.
Initial measurements of capture efficiency for both types of ex-periments testing saturated and dry inlet gas streams were quite similar. The main difference between the two scenarios was the stability of the capture performance over time. This suggests that moisture content of the gas impacted the crystallization process of ammonium salts over the course of the experiments. Setting aside the influence of water vapor, as the gas phase composition was the same for both the humid and dry inlet gas experiments, solid precipitation would be expected to occur for both. It is possible that either small amounts of water condense and dissolve the newly formed salts or that deliquescence of the ammonium salts occurs due to their hygroscopic behavior. To date, however, there is no experimental evidence in the literature to support these assump-tions. What our results showed, regardless of the mechanism, was that inlet gas humidity leads to stable operating conditions. Thus, in the context of industrial applications where the moisture content of the flue gas is high (the gas is nearly saturated), ammonium salts should not disturb the overall stability of the CO2capture efficiency in the mem-brane contactor.
4.4. Carbon and ammonia capture in the lumen phase: Analysis
An aqueous solution containing ammonia and carbon dioxide with
0 0,5 1 1,5 2 2,5 3 3,5 0 1 2 3 4
P
re
ss
ur
e
(b
ar
g)
Time (hour)
Fig. 5. Reversibility of the fouling from the precipitation of ammonium salts after Experiment 2. 170 NmL/min of nitrogen was fed into the lumen whereas 10 mL/min of water circulated in the shell side at 30 °C.
0 10 20 30 40 50 60 70 80 90 100 0 2 4 6 8
C
O
2ca
p
tu
re
e
ff
ic
ie
n
c
y
(
%
)
Time (hour)
Exp. 7 (40°C) Exp. 5 (21°C) Exp. 4 (21°C) Exp. 2 (10°C) 0,1 0,15 0,2 0,25 0,3 0,35 0,4 0,45 0,5 0 2 4 6 8P
re
ss
ur
e
(b
ar
g
)
Time (hour)
Exp. 7 (40°C) Exp. 5 (21°C) Exp. 4 (21°C) Exp. 2 (10°C)a) b) Fig. 4. Experiments with dry inlet gas: (a) CO2
capture efficiency variation with time (Experiments 2 and 4 performed with a gas flow of 200 NmL/min and Experiments 5 and 7 with 133 NmL/min), (b) Pressure measured at the gas inlet as a function of time.
precipitates of ammonia salts was recovered from the membrane con-tactor gas outlet. In this solution, concentrations of 12.5–18.9% of ammonia in weight and an average of 0.54 molCO2/molNH3 were measured. These values were integrated in the mass balance as shown schematically inFig. 7.
The total CO2 capture efficiency is the result of two contributing factors. The first being the absorption of CO2in the liquid absorbent flowing in the shell side of the membrane contactor, which can be calculated as: = ∗ − − − + − − η 100 F (F F ) F CO2,L
CO2,G in CO2,lumen outG CO2,lumen outL
CO2,G in (2.22)
The second factor contributing to the CO2capture efficiency is the CO2capture in the gas phase within the solution obtained at the gas contactor outlet, which can be obtained as:
= ∗ − − η 100 F F CO2,G CO2,lumen outL CO2,G in (2.23)
The total capture efficiency, considering both contributions, can be calculated as follows:
= +
ηCO2,total ηCO2,G ηCO2,L (2.24)
The ammonia slipping from the liquid absorbent relative to the total CO2captured can be calculated according to:
= + − − − − − Leak 17(F F ) 0.044(F F )
NH3,L NH3,lumen outL NH3,lumen outG
CO2,G in CO2,lumen outG (2.25) As we explained earlier, part of the leaked ammonia was detected at the lumen outlet in an aqueous solution. This ammonia leakage could thus be recovered. Consequently, it is important to distinguish between the leaked ammonia which could be recovered and the leaked ammonia which stayed in gas form which subsequently would need to be treated. As such, we calculated the leaked ammonia which remained in gas form
using the following formula:
= − − − − Leak 17(F ) 0.044(F F ) NH3,G NH3,lumen outG
CO2,G in CO2,lumen outG (2.26) The ammonia leak which could be recovered was calculated as follows:
= −
LeakNH3,recover LeakNH3,L LeakNH3,G (2.27) The results of these calculations are presented in Table 5. An average of 11.8% of the contactor inlet carbon dioxide content was trapped in the gas phase within the aqueous solution, ηCO2,G. The am-monia leak measured according to the infrared analysis performed on the gas phase LeakNH3,Gwas between 24 and 34 kgNH3/ton CO2 at 21 °C, and 58 kgNH3/ton CO2at 40 °C. These values are close to those found previously under the same conditions and with the same mem-brane contactor (32 kgNH3/ton CO2at 21 °C and 52 kgNH3/ton CO2at 45 °C[13,12]). However, the ammonia leak calculated from the liquid LeakNH3,L while taking into account the ammonia content inside the aqueous solution formed in the lumen side, was more than four times higher.
We estimated the ammonia leak under the same conditions for a packed column. The mass transfer of ammonia from the liquid to the gas phase in a packed column can rapidly lead to an equilibrium be-tween ammonia content in the gas phase and corresponding ammonia concentrations found in the liquid[26]. Thus, the ammonia slip in a packed column was estimated by considering the gas-liquid equilibrium at the gas outlet. The equilibrium relationship of ammonia (the pressure of ammonia in contact with the solution) was calculated using Henry’s law and by considering an unloaded 5% wt ammonia solution. The Henry constant H (in atm) was calculated as follows[27]:
=− + lnH 4200 T 3.133 (2.28) 0 10 20 30 40 50 60 70 80 90 100 0 2 4 6 8
C
O2
ca
pt
ur
e
ef
fi
c
ie
nc
y
(
%
)
Time (hour)
Exp. 6 (21°C) Exp. 3 (21°C) Exp. 1 (10°C) 0,1 0,15 0,2 0,25 0,3 0,35 0,4 0,45 0,5 0 2 4 6 8P
re
ss
ur
e
(b
ar
g)
Time (hour)
Exp. 6 (21°C) Exp. 3 (21°C) Exp. 1 (10°C)a)
b)
Fig. 6. Experiments with saturated inlet gas: (a)CO2capture efficiency variation over time for the
same conditions presented in Experiments 2, 4 and 5, (b) pressure measured at the gas inlet as a function of time.
F
i,G_inF
i,lumen_outGF
i,lumen_outLF
i,L_inF
i,L_outGas side
(lumen)
Liquid side
(shell)
N
CO2N
NH3a)
b)
(IR analyzer) (COT analyzer)i=CO2, NH3 Fig. 7. Schematic representation of the molar
flows in the membrane contactor: (a) Flows of CO2and NH3in the lumen and shell sides. At the
contactor outlet, the lumen side flow separates into a gas phase and a liquid phase, eventually becoming saturated; (b) Aqueous solution formed during the experiment.
The ammonia leak estimated in the packed column was in the same order of magnitude as the ammonia leak from the liquid side LeakNH3,L in the membrane contactor. This showed us that that it is not ne-cessarily the membrane itself which mitigates the ammonia leak as it has been previously assumed [16,13]. Nevertheless, in terms of the process itself, what is essential is the ammonia leak which remains in the gas phase. And effectively, this is from 3 to 5 times lower than the packed column leak due to the liquid formation in the gas phase, where the ammonia can be partially recaptured. In a packed column, ammo-nium salts may also form in the gas phase, but in this context the liquid and gas phases are in direct contact which can lead to the solid salts being dissolved. Ammonia leaked from the liquid remains in the gas.
The formation mechanism of the aqueous solution recovered in the gas phase at the lumen-side outlet, is yet not understood. It is even more astonishing as, due to the high liquid flow rate, the operation mode is isothermal. We propose that it may be explained as follows.
In the vicinity of the gas-inlet section, the product of activities be-tween NH3and CO2is higher than the dissociation constant defined in Eq.(2.13). This may lead to the formation of solid carbamate, which can then be hydrolyzed with H2O to form bicarbonate. The carbon di-oxide depletion will in turn decrease the product of partial pressures between reacting species below the dissociation constants (Eqs.(2.13) and (2.14)) to the point where ammonium salts sublime, releasing CO2, NH3and H2O. Around the gas-outlet section, the water vapor content of the gas is close to saturation. At this point, water produced from the sublimation of the salts could condense. This formed liquid could ab-sorb ammonia and CO2, and dissolve the remaining solid ammonium salts. The resulting solution has high concentrations of ammonia and carbon dioxide. Consequently, the water vapor pressure at equilibrium with this solution is lower than the water vapor pressure at equilibrium with the shell-side absorbent solution. The difference between these equilibrium pressures could thus act to maintain a driving force, leading to water-vapor transfer between the two compartments. The transferred water could then condense and enhance the formation of the lumen-side aqueous solution. This possible mechanism of water formation in the gas under isothermal conditions could not be con-firmed, as the quantitative evaluation of equilibrium constants and equilibrium water vapor pressures characterizing the lumen-side formed aqueous solutions was beyond the scope of the present in-vestigations.
5. Conclusion
The objective of this study was to investigate the behavior of the aqueous ammonia based CO2 capture process using membrane con-tactors. We paid particular attention to the formation of ammonium salts and an aqueous solution in the lumen of a membrane contactor for CO2absorption by a chemical solvent as being a distinctive character-istic linked to using aqueous ammonia.
The results of our experiments performed at different temperatures,
with dry inlet gas, show a correlation between decreased capture effi-ciency and pressure drop. Further, it appears that CO2and NH3react in the gas phase where ammonium salts crystallize and form obstructions in the lumen, contribute to an increase in gas velocity and finally, de-crease the gas-liquid contact time. The end result is a dede-crease in CO2 capture efficiency.
Interestingly, when the gas is saturated with water vapor, as is the case for flue gas, CO2capture efficiency remains constant over time. This may be related to what merits further investigation beyond what we were able to confirm, which is the effect of decreased salt pre-cipitation kinetic rates or micro-condensation and dissolution of the ammonium salts. Nevertheless, the significance of this result is that it opens up the possibilities for a scaling up process where it can be tested under real flue gas conditions.
Gas-side reactions always lead to the formation of an aqueous so-lution in the gas phase where a certain amount of carbon dioxide and a much higher amount of ammonia slip from the shell side can be cap-tured. Our analysis of this solution revealed that it contains some 75% of the ammonia leakage from the absorbent solution in the shell. Comparing estimated ammonia leak from a packed column versus that for the membrane contactor, showed that the membrane itself does not prevent the ammonia from escaping the absorbent solution. Given that a portion of the ammonia is captured in an aqueous solution formed in the gas phase, it is however possible to reduce the ammonia slip if this solution is reintegrated into the solvent loop. What remains unclear is whether this same solution would form under conditions for industrial applications.
Acknowledgment
This research was supported by the Agence Nationale de la Recherche, France (ANR) [Grant ANR C2B ANR-13-SEED-0003]. References
[1] World Meteorological Organization, The state of greenhouse gases in the atomo-sphere based on global observations, Greenh. Gas Bull. (2014) 1–17 doi:ISSN 2078-0796.
[2] International Energy Agency, Technology Roadmap, SpringerReference. (2013) 59,
http://dx.doi.org/10.1007/SpringerReference_7300.
[3] A.S. Bhown, B.C. Freeman, Analysis and status of post-combustion carbon dioxide capture technologies, Environ. Sci. Technol. 45 (2011) 8624–8632,http://dx.doi. org/10.1021/es104291d.
[4] P. Corp, P. Corp, I. Drive, Testing of Ammonia Based CO2 Capture with Multi-Pollutant Control Technology, 2008.
[5] G. Lombardo, R. Agarwal, J. Askander, Chilled ammonia process at technology center mongstad – first results, Energy Proce. 51 (2014) 31–39,http://dx.doi.org/ 10.1016/j.egypro.2014.07.004.
[6] K. Han, C.K. Ahn, M.S. Lee, C.H. Rhee, J.Y. Kim, H.D. Chun, Current status and challenges of the ammonia-based CO2capture technologies toward
commerciali-zation, Int. J. Greenh. Gas Control. 14 (2013) 270–281,http://dx.doi.org/10.1016/ j.ijggc.2013.01.007.
[7] General Elecric, Improvement of GE Power’s Chilled Ammonia Process using Membrane Technology, 2016.
Table 5
CO2capture efficiency and ammonia leak calculated according to analyses performed in the gas phase.
Exp.a CO
2capture efficiency NH3slip from the liquid solution
Shell liquid ηCO2,L Lumen liquid ηCO2,G Total ηCO2,total Gas LeakNH3,G Lumen liquid LeakNH3,recover Shell to lumen LeakNH3,L
Estimation packed column
% kgNH3/tons of CO2 1 57.9 9.3 67.2 24 98 122 88 2 48 6.6 54.6 53 107 160 198 3 67.1 12.7 79.8 24 119 143 123 5 67 16.8 83.8 34 148 182 115 6 75.4 13.6 89 34 115 149 110 7 84.7 11.8 96.5 58 104 162 240
[8] E. Favre, H.F. Svendsen, Membrane contactors for intensified post-combustion carbon dioxide capture by gas-liquid absorption processes, J. Memb. Sci. 407–408 (2012) 1–7,http://dx.doi.org/10.1016/j.memsci.2012.03.019.
[9] A. Gabelman, S.-T. Hwang, Hollow fiber membrane contactors, J. Memb. Sci. 159 (1999) 61–106,http://dx.doi.org/10.1016/S0376-7388(99)00040-X.
[10] R. Wang, H.Y. Zhang, P.H.M. Feron, D.T. Liang, Influence of membrane wetting on CO2capture in microporous hollow fiber membrane contactors, Sep. Purif. Technol.
46 (2005) 33–40,http://dx.doi.org/10.1016/j.seppur.2005.04.007.
[11] E. Chabanon, D. Roizard, E. Favre, Membrane contactors for postcombustion carbon dioxide capture: a comparative study of wetting resistance on long time scales, Ind. Eng. Chem. Res. 50 (2011) 8237–8244,http://dx.doi.org/10.1021/ie200704h. [12] C. Makhloufi, Etude expérimentale et modélisation d’un procédé de captage du CO2
en postcombustion par l’ammoniaque à l’aide de contacteurs membranaires : du matériau à l’évaluation de l’intensification de l’absorption., 2013.
[13] C. Makhloufi, E. Lasseuguette, J.C. Remigy, B. Belaissaoui, D. Roizard, E. Favre, Ammonia based CO2capture process using hollow fiber membrane contactors, J.
Memb. Sci. 455 (2014) 236–246,http://dx.doi.org/10.1016/j.memsci.2013.12. 063.
[14] A. McLeod, P. Buzatu, O. Autin, B. Jefferson, E. McAdam, Controlling shell-side crystal nucleation in a gas-liquid membrane contactor for simultaneous ammonium bicarbonate recovery and biogas upgrading, J. Memb. Sci. 473 (2015) 146–156,
http://dx.doi.org/10.1016/j.memsci.2014.07.063.
[15] Z. Cui, D. deMontigny, Experimental study of carbon dioxide absorption into aqu-eous ammonia with a hollow fiber membrane contactor, J. Memb. Sci. 540 (2017) 297–306.http://doi.org/10.1016/j.memsci.2017.06.013.
[16] A. McLeod, B. Jefferson, E.J. McAdam, Biogas upgrading by chemical absorption using ammonia rich absorbents derived from wastewater, Water Res. 67 (2014) 175–186,http://dx.doi.org/10.1016/j.watres.2014.09.010.
[17] M. Mehdipour, P. Keshavarz, A. Seraji, S. Masoumi, Performance analysis of am-monia solution for CO2capture using microporous membrane contactors, Int. J.
Greenh. Gas Control. 31 (2014) 16–24,http://dx.doi.org/10.1016/j.ijggc.2014.09. 017.
[18] H. Yu, S. Morgan, A. Allport, A. Cottrell, T. Do, J. McGregor, L. Wardhaugh, P. Feron, Results from trialling aqueous NH3based post-combustion capture in a
pilot plant at Munmorah power station: absorption, Chem. Eng. Res. Des. 89 (2011) 1204–1215,http://dx.doi.org/10.1016/j.cherd.2011.02.036.
[19] C. Makhloufi, D. Roizard, E. Favre, Reverse selective NH3/CO2permeation in
fluorinated polymers using membrane gas separation, J. Memb. Sci. 441 (2013) 63–72,http://dx.doi.org/10.1016/j.memsci.2013.03.048.
[20] V. Darde, K. Thomsen, W.J.M. van Well, E.H. Stenby, Chilled ammonia process for CO2capture, Int. J. Greenh. Gas Control. 4 (2010) 131–136,http://dx.doi.org/10. 1016/j.ijggc.2009.10.005.
[21] X. Li, E. Hagaman, C. Tsouris, J.W. Lee, Removal of carbon dioxide from flue gas by ammonia carbonation in the gas phase, Energy and Fuels. 17 (2003) 69–74,http:// dx.doi.org/10.1021/ef020120n.
[22] Kirk_Othmer, Kirk_Othmer encyclopedia of chemical Engineering – Fourth edition, 1992.
[23] Ullmann, Ullman’s encyclopedia of industrial chemistry, 1985.
[24] E.P. Egan, J.E. Potts, G.D. Potts, Dissociation pressure of ammonium carbamate, Ind. Eng. Chem. 38 (1946) 454–456,http://dx.doi.org/10.1021/ie50436a027. [25]M.J. Joncich, B.H. Solka, J.E. Bower, Thermodynamic properties of ammonium
carbamate, J. Chem. Ed. 44 (1967) 598.
[26] G. Qi, S. Wang, H. Yu, L. Wardhaugh, P. Feron, C. Chen, Development of a rate-based model for CO2absorption using aqueous NH3in a packed column, Int. J.
Greenh. Gas Control. 17 (2013) 450–461,http://dx.doi.org/10.1016/j.ijggc.2013. 05.027.
[27] A. Hasanoĝlu, J. Romero, B. Pérez, A. Plaza, Ammonia removal from wastewater streams through membrane contactors: experimental and theoretical analysis of operation parameters and configuration, Chem. Eng. J. 160 (2010) 530–537,