AVIS
Ce document a été numérisé par la Division de la gestion des documents et des archives de l’Université de Montréal.
L’auteur a autorisé l’Université de Montréal à reproduire et diffuser, en totalité ou en partie, par quelque moyen que ce soit et sur quelque support que ce soit, et exclusivement à des fins non lucratives d’enseignement et de recherche, des copies de ce mémoire ou de cette thèse.
L’auteur et les coauteurs le cas échéant conservent la propriété du droit d’auteur et des droits moraux qui protègent ce document. Ni la thèse ou le mémoire, ni des extraits substantiels de ce document, ne doivent être imprimés ou autrement reproduits sans l’autorisation de l’auteur.
Afin de se conformer à la Loi canadienne sur la protection des renseignements personnels, quelques formulaires secondaires, coordonnées ou signatures intégrées au texte ont pu être enlevés de ce document. Bien que cela ait pu affecter la pagination, il n’y a aucun contenu manquant.
NOTICE
This document was digitized by the Records Management & Archives Division of Université de Montréal.
The author of this thesis or dissertation has granted a nonexclusive license allowing Université de Montréal to reproduce and publish the document, in part or in whole, and in any format, solely for noncommercial educational and research purposes.
The author and co-authors if applicable retain copyright ownership and moral rights in this document. Neither the whole thesis or dissertation, nor substantial extracts from it, may be printed or otherwise reproduced without the author’s permission.
In compliance with the Canadian Privacy Act some supporting forms, contact information or signatures may have been removed from the document. While this may affect the document page count, it does not represent any loss of content from the document.
1
Identification and isolation of plant promoters induced by thiocyanate
par
Zeina Nasr
Département de sciences biologiques
Faculté des arts et des sciences
Mémoire présenté à la Faculté des études supérieures en vue de l'obtention du grade de Maîtrise en sciences (M.Sc.) en sciences biologiques
Janvier, 2007
© Zeina Nasr, 2007
o
5 JUIÀ 2008Ce mémoire de maîtrise intitulé:
Identification and isolation ofplant promoters induced by thiocyanate
présenté par:
Zeina Nasr
a été évalué par un jury composé des personnes suivantes:
Président-rapporteur Mohamed Hijri
Directeur de recherche Hargurdeep S. Saini
Codirecteur Daniel P. Maton
Thiol methyl transferase (TMT) is an enzyme capable of methylating thiol compounds, such as thiocyanate ("SCN), into their corresponding volatile methylated products. TMT1 gene codes for TMT. Recently, TMT1 was developed as a selectable marker. It was shown that TMTl is more efficient as a marker compared to the most used marker gene nptII. With the aim of developing TMT1 as an inducible selectable marker that can be induced by one of the TMT substrates, -SCN, a promo ter was identified in Arabidopsis thaliana that might be able to induce TMTl expression only in the presence of -SCN. The study was done on rice and A. thaliana. Plants were grown in the presence or-SCN. In order to fmd the promoter, genes induced by -SCN were identified by differential display analysis. Northem blot analysis confirmed that two genes were induced by the ion; the gene Os09g0442300 on chromosome 9 of rice that encodes a cysteine proteinase called oryzain y, and the gene Atlg03350 on chromosome 1 of A. thaliana that encodes a BSD domain-containing protein. For the rice gene, trials to isolate the upstream sequence that might contain the promoter region failed. In A. tha/iana, a 502 bp sequence upstream of Atlg03350 start codon was isolated and amplified. This region is expected to contain the -SCN-inducible promoter. This region was introduced upstream of the reporter gene gusA. Further work is needed to , measure the promoter activity in the presence and absence of -SCN, and the
promoter's ability to induce TMT1 expression only in the presence oCSCN.
Keywords: Thiol methyltransferase, thiocyanate, selectable marker, inducible promoter, differential display.
La thiol méthyle transférase (TMT) est une enzyme capable de méthyler et détoxifier des ions toxiques, comme le thiocyanate ("SCN). TMTI est un gène qui code pour la TMT. Récemment, TMT 1 a été utilisé comme un marqueur de sélection. TMTI a été montré d'être un marqueur plus efficace comparé à nptII, un marqueur le plus utilisé. Dans le but d'améliorer TMTI comme un marqueur de sélection inductible par -SCN, c'est-à-dire, un marqueur qui ne devrait être exprimé que pendant le processus de sélection et en présence de -SCN, un promoteur a été identifié chez l'Arabidopsis thaliana, qui pourrait induire l'expression de TMTI seulement en présence de -SCN. L'étude a été faite sur le riz et l'A. thaliana. Afm de trouver le promoteur, des gènes induits par-SCN on été identifiés par l'analyse différentielle des ARNs. L'analyse par Northern a confirmée la présence de deux gènes induits par l'ion; le gène Os09g0442300 sur le chromosome 9 du riz qui code pour une cystéine protéinase appelée oryzain y, et le gène Atlg03350 sur le chromosome 1 d'A. thaliana qui code pour une protéine contenant un domaine BSD. Pour le riz, on n'a pas réussi à isoler la séquence qui précède le gène et qui contient le promoteur inductible. Dans le cas du gène d'A. thaliana, une séquence de 502 paire de base qui précède le gène a été isolée et amplifiée. Cette région pourrait contenir le promoteur inductible. Elle a été insérée en amont du gusA pour mesurer l'activité du promoteur en présence et en absence de l'ion -SCN. Ce travail permet d'étudier dans le future la capacité de ce promoteur d'induire l'expression de la TMTl seulement en présence de -SCN. Mots clés: Thiol méthyl transférase, thiocyanate, marqueur de sélection, promoteurs inductibles, analyse différentielle.
ABSTRACT RÉsuMÉ TABLE OF CONTENTS LIST OF FIGURES LIST OF TABLES ABBREVIA TIONS ACKNOWLEDGMENTS DEDICATION 1. INTRODUCTION
1.1 Se1ectable markers: DefInition and applications
1.2 Thiol methyltransferase-encoding gene: A new selectable marker ii IV vii x Xl X 111 XIV
1.2.1 Thiol methyltransferase (TMT): Historica1 view 2
1.2.1.1 The role ofTMT 3
1.2.1.2 TMT isoforms 4
1.2.1.3 TMT -encoding genes 5 1.2.2 Development of the selectable marker 6 1.3 Selectable markers: Avoiding side effects 9 1.4 Development of TMT as an inducible selectable marker 9
2. MATERIALS ANDMETHODS 12
1 2.1 Plant materials 12
2.2 Optimization oCSCN concentrations 12
2.5 Reverse transcription polymerase chain reaction (RT -PCR) 14
2.6 Northem blot analysis 15
2.6.1 RNA transfer 15
2.6.2 Probe preparation and hybridization 17 2.6.3 Washes, exposure and development of membranes 17
2.7 DifferentiaI display 18
2.8 Sequencing and sequence analysis 19
2.9 Slot blot analysis 19
2.10 Northem blot analysis 20
2.11 Promo ter isolation 20
2.12 Promoter analysis 22
2.13 Preparation of electrocompetent bacteria 22 2.14 Electroporation with E. coli 23
2.15 Tobacco root transfonnation 24
2.15.1 GUS Assay on tobacco roots 25
2.16 Arabidopsis mesophyll protoplasts transfonnation 26
2.16.1 GUS assay on protoplasts 27 2.17 Transfonnation through floral dip 28
3. RESULTS 30
3.1 Optimization of-SCN concentrations 30
3.2 Micorarray analysis 36
3.2.1 Microarray analysis versus RT-PCR and northem blot analysis
3.3 DifferentiaI display analysis
44 50
3.3.2 Analysis of the putative bands by northem blot 58 3.4 Sequencing of differentially expressed genes 61 3.5 -SCN-inducible promoters'isolation 68
3.6 Bacterial Transformation 72
3.6.1 E. coli transformation 72
3.6.2 Agrobacterium transformation 75
4. DISCUSSION 78
4.1 Identification or-SCN-induced genes 79 4.2 Identification or-SCN-induced promoters 82 4.3 -SCN-induced promoter analysis through GUS assay 83
4.3.1 Possible reasons for the failure of plant transformation
4.4 Development of inducible selectable marker TMT 5. CONCLUSION 6. REFERENCES 84 87 90 91
Figure 1 Figure 2 Figure 3 Figure 4 Figure 5 Figure 6 Figure 7 Figure 8 Figure 9 Figure 10 Figure 11 Figure 12 Figure 13
Response of A. thaliana plants to different concentrations of
·seN.
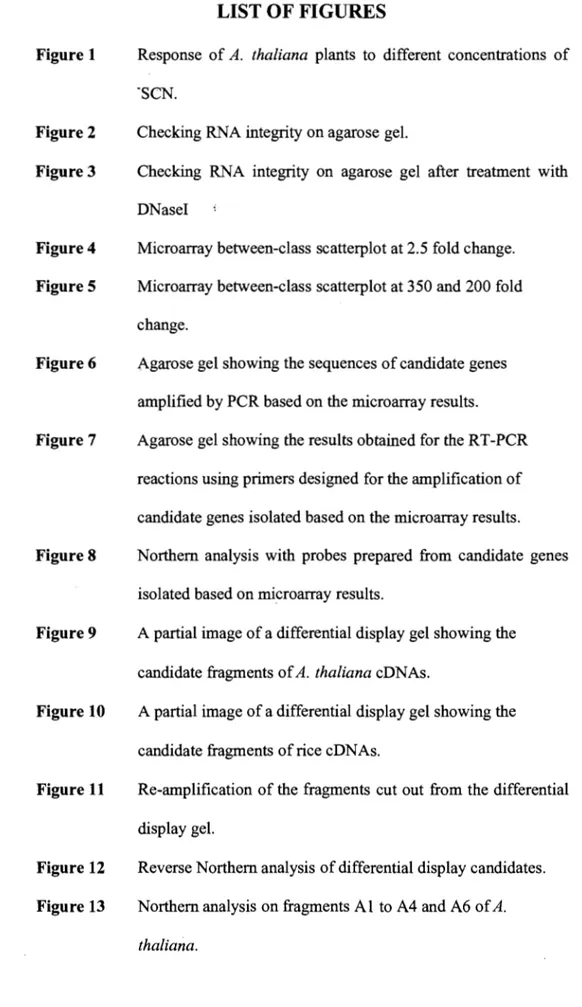
Checking RNA integrity on agarose gel.
Checking RNA integrity on agarose gel after treatment with DNaseI
Microarray between-class scatterplot at 2.5 fold change. Microarray between-c1ass scatterplot at 350 and 200 fold change.
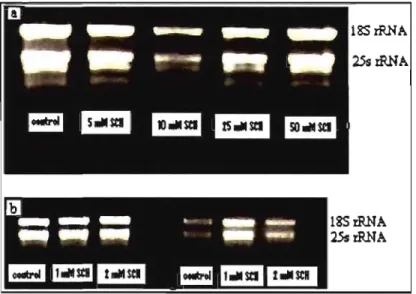
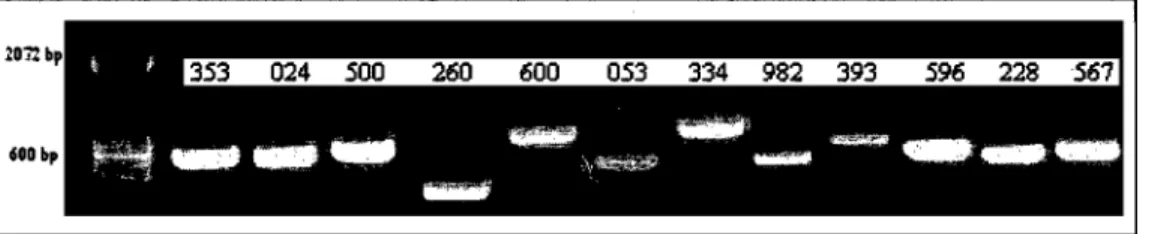
Agarose gel showing the sequences of candidate genes amplified by PCR based on the microarray results. Agarose gel showing the results obtained for the RT-PCR reactions using primers designed for the amplification of candidate genes isolated based on the microarray results. Northem analysis with probes prepared from candidate genes isolated based on microarray results.
A partial image of a differential display gel showing the candidate fragments of A. thaliana cDNAs.
A partial image of a differential display gel showing the candidate fragments of rice cDNAs.
Re-amplification of the fragments cut out from the differential display gel.
Reverse Northem analysis of differential display candidates. Northem analysis on fragments Al to A4 and A6 of A. thaliana.
Figure 15 Figure16 Figure 17 Figure 18 Figure 19 Figure 20 Figure 21 Figure 22 Figure 23 Figure 24
DNA sequence analysis of fragment A6.
Blast of forward and reverse sequences of fragment A6 with the A. thaliana genome.
A. thaliana BSD domain-containing protein (Atlg03350) rnRNA complete sequences.
DNA sequence analysis of fragment R4.
Blast of forward and reverse sequences of fragment R4 with the rice genome.
0. sativa Uaponica cultivar-group) Os09g0442300 full sequence.
Agarose gel showing the bands obtained from the different PCR trials to isolate the sequence upstream of Os09g0442300 gene of rice.
PCR amplification of the BSD domain-containing protein (Atlg03350) upstream sequence with the primers AUF andAUR.
Genetic map of the binary vector pCambial291Z containing the reporter gene gusA.
Agarose gel showing the PCR products obtained from the amplification of the plasmid by the primers AUF and AUR.
Figur~ 25 ,. Agarose gel showing the plasmid extracted from A. rhizogenes and A. tumefaciens and amplified with the primers AUF
Table 1
Table II
Table III
Table IV
The list of genes that showed an increase in expression according to microarray analysis
The list of forward and reverse primers designed for each gene chosen from microarray analysis.
Characteristics of candidate bands re-amplified from differential display geL
Primer combinations used for the amplification of the upstream sequence of Os09g0442300 gene of rice.
·SCN A260 A280 AdoMet bp cDNA dATP dCTP dGTP dNTP dTTP EDTA GUS HlBMT HPLC kb kDa LB MES MOPS MS MUG NaCIO nptII Thiocyanate ion Absorbance reading at 260 nm Absorbance reading at 280 nm S-adenosyl-L-methionine base pair Complementary DNA deoxyadenosine triphosphate deoxycytidine triphosphate deoxyguanosine triphosphate deoxyribonucleotide triphosphate deoxythymidine triphosphate Ethylenediaminetetra-acetic acid beta-glucuronidase halidelbisulfide methyltransferase
High performance liquid chromatography kilobase
Kilo Dalton
Luria-Bertani medium
2-(N-morpholino )ethanesulfonic acid 3-(N -morpho lino )propanesulfonic acid Murashige and Skoog medium
4-methyl umbell iferyl
p-
D-glucuronide Sodium chloriteSDS~PAGE TBE TEMED 1;MT Tris Tween20
uv
X~GlucSodium dodecyl sulfate polyacrylamide gel electrophoresis Tris~borate~EDTA N,N,N',N'-tetramethyl-ethylenediamine Thiol methyltransferase 2-amino-2-(hydroxylmethyl)-1,3-propanediol Polyoxyethylenesorbitan monolaurate Ultraviolet light 5-bromo-4-chloro-3-indolyl glucuronide
1 would like to express my gratitude to aIl those who gave me the possibility to complete this work. 1 am deeply indebted to my supervisor, Professor Deep H.S. Saini for his guidance, and moral and financial support during the course ofthis project. Words cannot describe my feelings. 1 can just say that it was an honor to have you as a supervisor and to feel to be a pah ofyour family.
1 would also like to express my sincere appreciation and respect for my co-supervisor, Professor Daniel Maton for his help and precious support during this work. 1 am also greatly thankful for my colleagues and dear friends in the lab, Dr. Priyum Koonjul for her constant and precious advice throughout these two years, Dr. Sima Babayeva for her help in the technical work, and Catherine Viel for her support in the beginning of this work. 1 would also like to thank Professor Daniel Maton's students for the support 1 got in their lab; special thanks to Martin, Hugo, and Eric for their help in the molecular work.
1 would also like to thank every person working in the institute. It was a pleasure working with you. A special thanks to Fengshan Ma for his help and support at the end of this work.
Finally, 1 would like to thank my dearest Mom, Dad, Dana, and Nehme for their continuaI interest, support, and inspiration during these two years. For my parents, thank you for all what you've been through while 1 am away. For Dana, thank you for being my sister and my friend. For Nehme, thank you for listening and helping me in every possible way.
1 dedicate this work to the most precious people in my life who offered me unconditional love and support during the course of this work: my great and amazing Mom, my best and dearest Dad, my wonderful sister and best friend Dana, and my love and my dear fiancé Nehme.
1.1 Selectable markers: Defmition and applications
Selectable mark ers are genes used to identify cells that are successfully transformed with a vector containing the gene of interest. The most common se1ectable markers are antibiotic-resistance genes (Miki and McHugh, 2004). Currently, neomycin phosphotransferase II (nptII) is the most wide1y used marker (Miki and McHugh, 2004). It conf ers resistance to neomycin and kanamycin. Following transformation with a vector containing both nptII and the gene of interest, only the cells that have integrated the genetic material are able to grow in a neomycin or kanamycin-containing medium. Other types of marker genes inc1ude herbicide tolerant genes, metabolic/auxotrophic genes and screenable markers. The first conf ers resistance to herbicides in a manner similar to antibiotic-resistance genes. The second allows the transformed plants to synthesize an important component for its survival that the wild type plants can not synthesize, so only transformed plants can survive and grow in a medium that lacks this component. The last type of marker genes code for proteins that can be identified through experimental procedures, so only transformed cells contain a specific protein. This type of mark ers are the least commonly used because selection with them is time consuming as both transformed and non-transformed plants have to be screened.
1.2 Thiol methyltransferase-encoding gene: A new select able marker
A new selectable marker system was recently developed (Koonjul et al, unpublished), which uses a thiol methyltransferase (TMT) gene (Attieh et al., 2002) encoding an enzyme capable of detoxifying thiocyanate ions (Attieh et al., 2000).
1.2.1 Thiol methyltransferase (TMT): Historical view
Thiol methyltransferases (TMTs) are enzymes mostly found in Brassicaceae and several other plant families of the order Capparales. They are able to transfer methyl group of S-adenosyl-L-methionine (AdoMet) to thiol groups, including highly reactive thiocyanate (SCN) and bisulfide (HS-) ions, as well as to halide ions, producing the corresponding methyl compounds that are often volatile (Attieh et al., 1995; Attieh et al., 2000).
When originally discovered, TMT was thought to be a halidelbisulfide methyltransferase (H/BMT) (Attieh et al., 1995). Its function was initially thought to be the methylation of the halide (Cr, Br-, and r) or bisulfide (HS-) ions. It was shown that the methylating activities for both halides and bisulfide co-purified at about the same ratio, an indication that both methylation reactions might be catalyzed by the same enzyme. This possibility was confirmed by kinetic analysis that showed competitive inhibition between
r
and HS-. These results demonstrated that the halide and bisulfide methylation was carried out by the same enzyme, the halidelbisulfide methyltransferase (H/BMT), and· both substrates bind to the same active site of the protein.1.2.1.1 The role ofTMT
Because of its methylation activity, TMT was suggested to play a role in the detoxitication of its phytotoxic substrates. The tirst suggestion was that the enzyme might be involved in detoxifying
cr
as a part of plant's salt-tolerance mechanism. However, the enzyme activity was very low in halophytic plants, and was not affected by plant salinization, providing no evidence for a role in salt tolerance (Saini et al., 1995).Since the enzyme activity was highest in species of the sulfur-rich family Brassicaceae, which is known to produce HS-, one of the enzyme's substrates, another suggestion was that TMT might be involved in sulfur metabolism. Several potential substrates were assayed based on the ability of various compounds to compete with
r
for the enzyme's active site and thus inhibitr
methylation (Attieh et al., 2000). Among a large number of compounds screened, thiol compounds, especiaUy -SCN, thiophenol, 4,4'-thiobisbenzenethiol, and thiosalicylic acid were highly inhibitory ofr
methylation, suggesting that they might be methylated by TMT. This suggestion was contirmed with a radiometric as say, in which radiolabeUed methylated products were detected when their corresponding substrates, the pure TMT, and the labeled methyl donor AdoMet were present in the medium (Attieh et al., 2000).These TMT substrates or their analogues are known to arise from the hydrolysis of the secondary metabolites glucosinolates (Attieh et al., 2000). Glucosinolates are natural organic compounds found in aU plants belonging to the order Capparales (Duncan, 1991). They are glucosides characterized by a
thioglucose moiety, a sulfonated oxime, and a side chain derived from amino acids. Glucosinolates have various biological functions, inc1uding anticarcinogenic properties, effect on taste and flavor of food, and plant defense against insects, fungi, and herbivores (Jezek et al., 1999; Mikke1sen et al., 2002). Upon herbivore attack, these compounds are degraded by myrosinase, an endogenous thioglucosidase, into various toxic compounds (Halkier and Du, 1997) that are not only harmful to the attacking pathogens, but could be toxic for the plant itse1f. Among all these compounds, -SCN was found to be the most preferred substrate for the TMT (Attieh et al., 2000).
These results suggest that this methyltransferase could be involved in the methylation and hence detoxification of toxic thiol products of the glucosinolate pathway. TMT was also found to be associated with glucosinolates, as well as myrosinase, in the different plant parts, especially in younger tissues (Attieh et al., 2000), which further supports the finding that TMT is associated with the detoxification of the glucosinolate hydrolysis products.
1.2.1.2 TMT isoforms
TMT was purified to near homogeneity from Brassica oleracea L. (red cabbage) through five purification steps, and proteins from each step were separated on an SDS-PAGE (Attieh et al., 1995). The purification with HPLC on Protein Pak Q anion ex change column resulted in multiple peaks of the activity that were all able to methylate both
r
and HS-, suggesting the existence of multiple isoforms of the enzyme. Five isoforms, having molecular massesbetween 26 and 31 kDa, were isolated (Attieh et al., 2000). AlI isofonns were shown to methylate different thiol products, including -SeN and HS-, as well as the halide
r.
1.2.1.3 TMT-encoding genes
This c1ass of newly identified enzymes, found to have at least five isofonns with different properties and molecular weights, was most likely derived from more than one gene. Attieh et al. (2002) isolated two cabbage cDNAs, cTMTl and cTMT2, that coded for TMT. The molecular characterization of the cDNAs cloned showed that cTMTl was 910 bp long encoding a 25.13-KDa protein, with pl 4.72. cTMT2 was 875 bp long encoding a 25.02-KDa protein, with pl 4.73. The proteins encoded had the same length but the difference in the molecular masses was due to difference in 13 amino acids. These two cDNAs contained the conserved motifs l, II, and III of methyltransferases. Motifs 1 and III were shown to be present in N- and 0- methyltransferases as part of the AdoMet binding site. Motif II was also widely found in methyltransferases but was not associated with active parts of the gene (Ni and Hager, 1998). On the other hand, these cDNAs did not share significant homology with other methyltransferase cDNAs. Besides, the protein translated did not show activities re1ated to N-, 0-, or S- methyltransferases. These findings suggested that TMT were distinct from other methyltransferases and hence they were considered novel plant enzymes that were unique, with unique classes of genes.
1.2.2 Development o(the selectable marker
The idea of using TMT gene as a selectable marker was based on the notion that TMT -catalyzed conversion oCSCN to volatile CH3SCN was a detoxification
reaction (Attieh et al., 2000). This idea was supported by the findings (Koonjul et al, unpublished) that red cabbage (Brassica oleracea), which naturally contains TMT, was much more tolerant to -SCN than tobacco, which do es not contain the gene. Moreover, engineering TMT into tobacco (Nicotiana tabacum) plants increased their tolerance to -SCN, and knocking a homologue of the gene out of Arabidopsis thaliana through T-DNA insertion reduced its tolerance to the ion. Taken altogether, these results suggested that TMT gene could be used as a selectable marker for plant transformation, such that if the TMT and a gene of interest were co-introduced into a population, only the individuals carrying TMT gene would survive in the presence of -SCN while those lacking the gene would die or lag in growth.
The efficiency of this marker was successfully demonstrated in root cultures of eight dicot plants, all of which lacked the TMT gene, as well as for the selection of whole plants in three different species: A. thaliana, a dicot that contains a homologue of the gene (Attieh et al., 2002), N tabacum (tobacco), a TMT-Iacking dicot, and Oryza sativa (rice), a monocot that lacks the gene (Koonjul et al, unpublished). The details are summarized be1ow.
Root cultures of eight dicots were transfected with Agrobacterium rhizogenes containing a vector with or without the TMT gene and the roots were grown on -SCN-containing medium at a concentration inhibitory to the growth of
non-transformed roots. The roots that grew faster in the presence of -SCN were selected as putatively transformed. PCR and TMT enzyme assay confirmed that in seven of eight species, all visually selected clones were TMT -positive. Thus TMT-based selection in these species was 100% accurate. The accuracy of selection in the eighth species was 75%.
Having thus established the proof of concept, the efficacy of TMT was tested in plant transformation. A. thaliana, tobacco, and rice plants were transformed with A. tumefaciens containing a vector having both TMT and nptII sequences. The use of these two genes together allowed the comparison between the efficacy of nptII and TMT as selectable markers. In the case of tobacco, 2.5 mM -SCN inhibited the growth of wild type plants. This concentration of the ion was added to the regenerating calli. The plants that grew normally were selected and all of them were shown to contain the nptII, suggesting that TMT has provided 100% selection efficiency. When plants were grown on kanamycin-containing medium, only 80% of the selected plants contained the TMT gene, suggesting a less accuracy for selection with nptII. These results were similar for A. thaliana transformation. Arabidopsis plants were transformed using the floral dip method (Clough and Bent, 1998). Seedlings were grown on selection medium either containing -SCN or kanamycin. When TMT was used as the selectable marker, 75% of the visually selected plants were proven to contain nptII. In contrast, when nptII was the marker for selection, only 58% of the selected plants actually contained the TMT gene. These results showed that in both dicot plants, selection with TMT was more accurate than the CUITent most commonly used
marker, npt11. In the case of monocots, rice was used for transformation. In general, monocot transformation has a low yield of transformed plants. Only two plants were selected visually to be transformed and both plants contained npt11, suggesting 100% selection efficiency with TMT. However, no plants were regenerated when npt11 was used for selection.
The above results showed that TMT could be used as an efficient selectable marker in conjunction with -SCN, regardless of whether the plant itself does or does not naturally contain the TMT gene. As the TMT gene is found naturally in a number of plants (Saini et al., 1995), this marker bypasses the concerns over the risk of lateral transfer of foreign genes, such as antibiotic-resistance genes (Stewart et al., 2000; Miki and McHugh, 2004). The use of these genes as selectable markers has been criticized because of the potential for their transfer from transformed plants to microorganisms, which could lead to the development of resistance to these antibiotics in pathogenic microbes (Bertolla et al., 2000; Chiter et al., 2000). Although gene transfer occurred from plants to prokaryotes during evolution (Heinemann, 1991), the transfer was limited among distant organisms and was affected by various environmental factors, providing no evidence of the possibility of increasing the resistance of bacteria (Bertolla et al., 2000). However, critics argue that the risk, even if small, could be avoided with alternatives markers (Miki and McHugh, 2004). One such alternative is the TMT gene. It also has an additional advantage that the selective agent -SCN is a natural less expensive compound that can be easily'added to the medium.
1.3 Selectable markers: Avoiding side effects
To overcome any si de effect of the marker genes after the transformation, the selectable markers are sometimes excised from the transgenic plants (Hare and Chua, 2002). Cre recombinase has been used to eliminate the selectable marker (Dale and Ow, 1991; Zhang et al., 2003; Wang et al., 2005; Cuellar et al., 2006), leaving the inserted gene of interest intact in the plant. This excision could avoid the concems about genetically modified crops and facilitate the commercialization ofthese transgenic plants.
Altematively, development of an inducible selectable marker would have the advantage of avoiding the need to excise the marker from the transgenic plants. In this case, the marker would be induced only during the selection process and then switched off once the selection has been accomplished, thus avoiding any effect of the marker gene on the growth and development of selected transgenic plants. To our knowledge, no inducible selectable marker is currently available.
1.4 Development of TMT as an inducible selectable marker
Development of TMT into an inducible marker could be possible if a suitable promo ter that tums on the gene only during the selection could be found. The object of this work is to find such a promoter. Ideally, this should involve the regulation of the TMT gene by one of the TMT's substrates, such as -SCN, that is used as a selective agent. In general, gene expression is regulated by promoters found upstream of a gene's transcription site. Promoters are themselves regulated by a variety of factors such as heat (Holtorf et al., 1995), cold (Mujacic et al.,
1999), pathogen attack (Kooshki et al., 2003), wounding (Keil et al., 1990) and chemicals (Yurimoto et al., 2000). The identification and isolation of a promoter that is positively regulated by the ion -SCN, would require three steps:
1. Identification of genes expressed only in the presence oCSCN. 2. Isolation of the upstream promoters regulating these genes.
3. Test the promoter by transformation to prove its inducibi1ity by -SCN. The first step was done by comparing gene expression in untreated versus -SCN-treated plants. Two plants were used in this study, rice and A. thaliana, since their full genome is a1ready sequenced and it would be convenient to find the complete sequence of the -SCN-responsive gene as weIl as the upstream promoter sequence. The comparison of gene expression was done through differential display and microarray analysis. The genes that were found to be up-regulated in the presence of -SCN were isolated and identified. The aim was to identify the promoters regulating these genes, i.e. the -SCN-induced promoters. The second step then involved the isolation of the upstream sequence of the genes, containing the promo ter region, by polymerase chain reaction. In the third step, this region was tested for its ability to induce gene expression only in the presence of -SCN. The test was done by introducing the sequence in a binary vector upstream of a reporter gene, gusA, so that the putative -SCN-induced promoter regulates the expression of gusA. The construct was transformed into A. rhizogenes. Transformation of plants with A. rhizogenes leads fast-growing roots (Visser et al., 1989; Rivoal and Hanson, 1994). It would be convenient to initially test the promoter activity in cultured roots for rapid results. Besides, A.
tumefaciens-mediated transfonnation for which the floral dip of A. thaliana was used to test the promoter activity in the whole plant (Zhang et al., 2006). Transgenic plants that would integrate the chimeric gene and grow nonnally in the selective medium would be selected and tested for gusA expression. Sorne of these plants would be exposed to -SeN, and others used as a control.
Following exposure to -SeN, the promoter would be activated and would induce the expression of gusA that encodes the enzyme beta-glucuronidase (GUS). GUS is able to cleave a chromogenic substrate, 5-bromo-4-chloro-3-indolyl glucuronide (X-Glue), resulting in a blue color in the plant cells where gusA is expressed. This assay is widely used to test promoter activity since it is inexpensive and easy to perfonn and visualize (Jefferson et al., 1987). In the absence of -SeN, gusA expression would not be induced, and plant cells would not stain blue in the presence of X-Glue. To test the promoter activity, gusA expression would be tested by incubating the transgenic plant tissues with X-Glue and observed for possible blue staining.
2. MATERIALS AND METHODS
2.1 Plant materialsTwo plant species were used: Arabidopsis thaliana Columbia-O ecotype and Oryza sativa (rice) Japonica and Indica types. The seeds ofboth species were surface sterilizedas follows: For rice seeds, sterilization involved a wash with 70% ethano1 for 1 minute, followed by a 15-minute wash with 2.5% (v/v) NaC10 containing 2 drops of tween-20, and three successive washes with sterile water for 5 minutes each. Arabidopsis seeds were washed with 50% ethanol for 1 minute, followed by a wash with 0.2% (v/v) SDS/50% (v/v) NaCIO for 10 minutes, and three successive washes with sterile water for 10 minutes each. Sterile seeds were grown on Murashige and Skoog (MS) medium supplemented with different -SCN concentrations.
2.2 Optimization of -SeN concentrations
A. thaliana naturally contains the TMT gene. In order to study genes induced by -SCN, the plants were exposed to a sublethal concentration of the ion; a concentration at which the TMT enzyme is no longer able to methylate all of its substrates but the plant is still able to survive. Arabidopsis seeds were germinated and grown on MS medium with different -SCN concentrations, ranging from 0.25 mM to 100 mM to find the optimum ion concentration. Rice, which does not contain the TMT gene, is extremely sensitive to -SCN. Renee, rice seeds were germinated on basal MS media then transferred to grow on MS media containing
different concentrations of-SCN, ranging from 5 to 100 mM, for a period of one to three days.
2.3 RNA extraction
RNA was extracted from control plants and those exposed to different concentrations of -SCN. In the case of rice, the two-week old plants exposed to different -SCN concentrations for different days were ground to a fine powder in liquid nitrogen, and RNA was extracted using the RNeasy Plant Mini Kit (Qiagen, Missisauga, ON) according to manufacturer's recommendations. For Arabidopsis, plants were about three weeks old. The whole plants were ground in liquid nitrogen and 1 ml of Trizol reagent was added to 100 mg of powder. The mixture was incubated at room temperature for 5 minutes to break down the cells then 0.2 ml chloroform was added and the solution was incubated for 15 minutes at room temperature, followed by a centrifugation in a micro centrifuge at 4°C at 12,000g for 15 minutes. The upper aqueous phase obtained was saved and mixed with 0.25 ml of isopropanol. The solution was again incubated at room temperature for 10 minutes and centrifuged for 10 minutes under the same centrifugation conditions. After centrifuging, the supematant was removed and the RNA pellet was dissolved in 70% (v/v) ethanol solution, and centrifuged at 4°C at 7,500 g for 5 minutes. AlI the ethanol solution was aspired and the pure RNA pellet was resuspended in 30 ~l RNase free-water. The RNA in the extracts was quantified by measuring their absorbance at 260 nm using a DU-65 spectrophotometer (Beckman Instruments, Mississauga, ON). The RNA purity
was detennined by comparing absorbance at 260 nrn and 280 nrn; an A260/280 ratio of 1.8 to 2 indicated that the RNA was pure. RNA integrity was deterrnined by electophoresing 1 !-tg of RNA on a 1 % (w/v) agarose gel, staining it with ethidium bromide and observing the bands under UV light.
2.4 Microarray analysis
An Affyrnetrix GeneChip Arabidopsis ATH 1 Genome Array was purchased from Genome Quebec and Mc Gill Center (Mc Gill University, Montreal, QC) and microarray analysis was carried out by the center's technicians. Control and -SCN-exposed RNA were sent to be reverse transcribed and screened with the chips. Although multiple replicates for analysis of differentially expressed genes with microarray chips were recommended, on1y one replicate of each case was used, because of the high cost of each chip. Besides, it was considered that the different concentr~tions of -SCN are the different replicates, however only one replicate for the control was used. Genes that showed an expression in treated sarnples with a fold change above 2.5 compared to the expression in the control samples were considered as up-regulated by-SCN. These genes were isolated and tested by reverse transcription-polyrnerase chain reaction (RT-PCR) and northem blot analysis. These two tests were critically important to confinn the results obtained with the microarray analysis.
2.5 Reverse transcription polymerase chain reaction (RT -peRl
Several genes that showed up-regulation in the presence of -SCN in the microarray chips were tested by RT-PCR using the One-Step RT-PCR kit (QIAGEN, Missisauga, ON). Forward and reverse primers were designed for each gene. Two PCR reactions were prepared for each gene; one with control RNA, and the other with -SCN-exposed RNA. Each reaction was prepared for a final volume of 50 !lI and contained 1 !lg of RNA, 0.6 mM of each primer, IX enzyme buffer, 400 !lM of each dNTP, and 2 !lI of QIAGEN One-Step RT -PCR enzyme mix. The reaction mixture was subjected to the following steps in a thermal cycler: 30 minutes at 50°C for reverse transcription, 15 minutes at 95°C for enzyme activation, followed by 35 amplification cycles of 30 seconds at 94°C for cDNA denaturation, 30 seconds at 55°C for primer annealing, and 90 seconds at 72°C for elongation, and a final elongation at 72°C for 10 minutes. During the 35 amplification cycles, 4 !lI of each PCR reaction was removed after every 5 cycles and loaded on an agarose gel to study the expression of the gene in the presence and absence of-SCN. The intensity of the band on the agarose gel is an indication of the level of expression of the gene. Actin2 primers were used as a control to ensure equal amounts of RNA. Two PCR reactions were prepared using the actin2 primers; one with control RNA, and the other with -SCN-treated RNA. The control PCR reactions was prepared as mentioned for the microarray-identified genes, and subjected to the same PCR conditions. The control PCR products were also loaded on the agarose gel, to see the actin gene that is
expected to show equal intensities in both cases, suggesting that equal amounts of control and -SCN-treated RNA were used.
2.6 Northern blot analysis
2.6.1 RNA transfer
Rice and Arabidopsis RNA from control and -SCN-treated plants were loaded on 1 % (w/v) agarose gel for 1.5 hours at 220 volts in IX MOPS buffer (0.5 M MOPS pH 7.3 and 0.01 M EDTA). Ten ~g of each RNA sample previously treated with 3 M sodium acetate (NaOAc) and 100% (v/v) ethanol was centrifuged in a micro centrifuge at 4°C at 12,000 g for 30 minutes and further purified by suspension of the RNA pellet with 500 ~l of 70% (v/v) ethanol. The RNA was microcentrifuged at 4°C at 12,000g for 10 minutes and dried in Savant SpeedVac plus model SCllOA to remove aIl residual ethanol. After aIl the ethanol was aspired, the RNA pellet was then re-suspended in 4.8 ~l buffer A (3X MOPS buffer) and 9.2 ~l FIF solution (9% (v/v) formaldehyde and 73% (v/v) formamide). The mixture was incubated at 70°C for 10 minutes for denaturation of the secondary structure. The different samples were loaded on the gel after addition of the loading dye (322 ~l buffer A, 5 mg cyanol xylene, 5 mg bromophenol blue, 400 mg sucrose, 178 ~l of 37% (v/v) formaldehyde, and 500
~l deionized formamide), stained with ethidium bromide and visualized under UV light. The visualization under UV light allowed the verification of the integrity and the quantity of the RNA. These RNAs were then transferred to a positively charged nylon transfer membrane (Fisher, Ottawa, ON). The agarose
gel was placed with the entry of wells faced down on a large Whatman paper that had its extremities soaked in 20X SSC solution (3 M sodium chloride and 0.3 M sodium citrate, pH 7). The nylon membrane was soaked in 20X SSC solution and placed between the gel and three presoaked and one dry Whatman papers. The assembly was covered with Saran wrap and a layer of paper towels, a glass plate and a heavy book were p1aced on top. After 16 hours, the membrane was removed and the RNAs were fixed on the membrane through UV cross-linking.
2.6.2 Probe preparation and hybridization
Probes were prepared from diffèrent candidate genes identified by microarray analysis using the Strip EZ DNA Kit (Ambion, Austin, TX), according to the manufacturer's recommendations. The cDNAs were radioactively labeled with fresh u-p32 labeled dA TP (Perkin-Elmer, Massachusetts, USA). Before hybridization with the probes, the membranes containing the transferred RNA were pre-hybridized .with 50% formaldehyde buffer (50% (v/v) deionized formamide, 30% (v/v) of 20X SSC, 10% (v/v) of 50 X Denhardt's solution, 5% (v/v) of20% (v/v) SDS, 4% water, and 1 % (v/v) of 10 mg mr1 salmon sperm DNA) at 45°C for 2 hours. The probes were purified using the quick spin G50 Sephadex columns, denatured and added to fresh 50% formaldehyde buffer. The incorporation of radioactive dATP was assayed in 1 III of the probè using a liquid scintillation counter. The membranes were incubated with the radioactive probes at 45°C for 12 hours.
2.6.3 Washes, exposure and development ofmembranes
Following hybridization, the membranes were washed with different SSC solutions. The washing started in a solution of 2x (v/v) SSC, 0.1 % (v/v) SDS at 35°C for 30 minutes. The wash was repeated twice, followed by 2 more washes each in a mixture of IX (v/v) SSC and 0.1 % (v/v) SDS at 45°C for 30 minutes. The final wash was done once in a 0.1 % (v/v) SSC and 0.1 % (v/v) SDS solution at 50°C for 10 minutes. The membrane radioactivity was monitored by a Geiger counter. The membranes were exposed to the films for 12 to 24 hours, and the films were developed in the automatic developer Curix 60 (Agfa, Pointe Claire, QC). Sorne membranes were exposed in cassettes for 12 hours and the films were developed in the phosphorimager Typhoon 9200 (Amersham Biosciences, Piscataway, NJ, USA) for faster results.
2.7 DifferentiaI display
The RNAimage Kit (GenHunter, Nashville, TN) was used for the analysis of genes differentially expressed between -SCN-treated and control rice and Arabidopsis plants, using the protocol of Liang and Pardee (Liang and Pardee, 1992). For rice, cDNA from plants exposed to 0, 10, and 50 mM -SCN for 1 day were studied using the three anchored prim ers (H-TllA, H-TllC, and H-TllG) combined with the arbitrary prim ers HAP1 to HAP8 (Liang et al., 1994). Arabidopsis cDN A was from plants exposed to 0, 1, and 2 mM -SCN during germination and early seedling growth. The three anchored primers were 'also used in combination with arbitrary primers HAP9 to HAP 16. The Choice of
different pnmer combinations was random. The cDNAs were radioactively labeled with fresh a_p33 labeled dATP (Perkin-Elmer, Massachusetts, USA). The 6% denaturing gel was prepared as follows: 42 g of urea, 5.7 g of acrylamide, 0.3 g of bis-acrylamide, 20 ml of 5X TBE buffer (54 g Tris base, 27.5 g boric acid, and 0.01 M EDTA pH 8.0) were dissolved in 40 ml water. The solution was mixed, filtered using a 0.45 micron filter, and degassed. Just before loading the gel, 500 III of freshly made 10% (w/v) ammonium persulfate and 50 III of TEMED were added to the solution for polymerization. The samples were loaded and the gel was electrophoresed for 4 hours at constant 60 W, with a voltage of 3500 V and a current of 150 mA.
2.8 Sequencing and sequence analysis
Bands from the gels showing putative differentially expressed genes in both rice and Arabidopsis were extracted, purified, amplified, and sequenced using the appropriate anchored and arbitrary primer combinations used in the differential display analysis. The sequencing was done using the University Core DNA and Protein Services, University of Calgary, AB. Each primer (3.2 IlM) was mixed with 100 ng of cDNA and sent for sequencing at an annealing temperature of 55°C. Sequences were analyzed, corrected and subjected to BLAST analysis in GenBank to identify the corresponding gene sequences.
2.9 Slot blot analysis
Equal amounts of cDNAs amplified from the candidate differential display bands were loaded on a positively charged Slot Blot membrane. The membrane was dried and UV cross-linked to fix the DNA. Probes were prepared from 3 /lg RNA from control and -SCN-exposed plants, 25 mM of each dGTP, dCTP, and dTTP, MMLV enzyme, IX RT buffer, and 10 mM of the prim ers H-TllA, H-TllC, and H-TIIG. The probes were radioactively labeled with fresh u-p32 labeled dATP (Perkin-Elmer, Massachusetts, USA). The solutions were incubated at 65°C for 5 minutes to denature secondary structures of RNA, followed by 60 minutes at 37°C for reverse transcription. The MMLV enzyme was added after 10 minutes at 37°C. The reactions were stopped by incubation for 5 minutes at 75 oC.
The membranes were pre-hybridized with 50% formaldehyde. The probes were purified, denatured, added to 50% formaldehyde buffer and hybridized for 12 hours with the membrane containing the different cDNAs. After hybridization, the probes were removed and the membranes were subjected to a series ofwashes with different SSC solutions of increasing stringency as described in section 2.6.3, and exposed for 12 to 16 hours to a film for development.
2.10 Northern blot analysis
Rice or Arabidopsis RNA from control and -SCN-treated plants was loaded on a 1 % agarose gel, transferred to a nylon membrane and cross-linked as described in section 2.6.1. Probes were prepared from the different candidate
bands amplified from the differential display gel following the same procedure for the preparation of the probes for microarray-identified genes. After pre-hybridization and pre-hybridization of the northem membranes with the different probes, the membranes were washed with the different SSC solutions, and exposed to films for 12 to 24 hours to be developed.
2.11 Promoter isolation
Since the genome ofboth rice and Arabidopsis are fully sequenced, genes that were found differentially expressed by -SCN through differential display analysis and northem blotting were sequenced and characterized. The upstream sequence of each gene was isolated and amplified through polymerase chain reaction (PCR). For rice, a 2067 bp sequence upstream of the gene (ri ce upstream sequence-RU) was amplified by PCR after several rounds of optimization using
the two primers: forward primer RUF
5'-GAGAGGATCCGGCATATACACCGTCCATCC-3' and reverse primer RUR 5' GAGACCATGGGCTGGCCACTGGTATGACTT -3'. The forward and reverse primer sequences started with BamHI and NcoI restriction sites, respectively, to facilitate ligation of the upstream sequence with a promoterless vector containing the GUS reporter gene. One hundred ng of genomic rice DNA, 2.5 J.1M of each primer, 200 J.1M of each dNTP, 1 U of Taq polymerase and IX of the corresponding enzyme buffer (QIAGEN, Mississauga, ON) were mixed in a 40 J.11 solution. The PCR pro gram included an initial denaturation step at 95°C for 5 minutes, followed by 40 cycles of denaturation (94°C for 1 minute), primer
annealing (60·C for 1 minute) and elongation (72·C for 3 minutes). The amplification ended with a final elongation at 72·C for 10 minutes.
In the case of A rabidopsis , a 502 bp upstream region of the gene (Arabidopsis upstream sequence- AU) was amplified by PCR using the forward
primer AUF with BamHI restriction site
5'-GAGAGGATCCGTCTGGCTCAACGGTAACT-3' and the reverse primer AUR with NcoI restriction site 5' -GAGACCATGGGGATTCGGTTTCTGGAGGAT-3'. The PCR program was the same as that for rice, except that the elongation was for 1 minute.
2.12 Promoter analysis
RU, AU, and pCambia 1291Z were cut with NcoI and BamHI, using 500 ng of each DNA and 10 units of each restriction enzyme (Startagene, Texas, USA) with IX corresponding buffer at 3TC for 12 hours. The DNA and the vector with sticky ends were loaded on a 1 % agarose gel and the corresponding bands were cut from the gel using a clean sharp scalpel. The bands were purified using the Qiagen Gel Extraction Kit (QIAGEN, Mississauga, ON) according to the manufacturer's recommendations.
Following purification, RU and AU were each ligated with pCambia, using 0.4 U ofT4 DNA ligase (Invitrogen, Burlington, ON), and a vector to insert ratio of 1 :5, with IX of the corresponding ligase buffer in a 20 !-lI reaction, and incubated at room temperature for 4 hours.
2.13 Preparation of electrocompetent bacteria
Different electrocompetent bacteria were prepared; E. coli XL-I Blue MRF', Agrobacterium rhizogenes A4, and A. tumafeciens LBA 4404. For E. coli, a single colony was isolated, inoculated in 5 ml LB medium (1 % (w/v) tryptone, 0.5% (w/v) yeast extract, 1 % (w/v) sodium chloride, and a pH of 7.0) with 4 Ilg mr1 tetracyc1ine (the strain is resistant to tetracycline), and incubated at 37° C for 16 hours. The culture was transferred to 500 ml LB medium with tetracyc1ine and grown at 37° C with vigorous shaking until it reached an OD6oo of 0.5. The culture was chilled on ice and then centrifuged to pellet the bacteria. The pellet was resuspended in 10% cold glycerol and centrifuged several times until most of the salt is washed out. The electrocompetent cells were stored at -80° C.
For both Agorbacterium strains, the same protocol was used except that the incubation temperature was always at 28°C, and the medium used for growth was MY A (0.5% (w/v) yeast extract, 0.05% (w/v) casamino acids, 0.8% (w/v) mannitol, 0.2% (w/v) ammonium sulfate, 0.5% (w/v) sodium chloride, and with a pH of 6.6). Besides, as Agrobacterium is not antibiotic resistant, the bacteria were initially grown on MY A plates and MY A medium without antibiotic.
2.14 Electroporation with E. coli
Each ligation reaction was transformed into electrocompetent E.coli through electroporation using a cell porator (GIBCO BRL, Invitrogen, Burlington, ON). Bacteria (23 Ill) were thawed on ice and mixed with 2 III of ligation reaction. The 25 III reaction was introduced between the electrodes of the
electroporation cuvette and electroporated under a capacitance of 330 ).lf, a fast charge rate, and a low resistance. Immediately after electroporation, 1 ml of LB medium was added to the cuvette, the mixture was transferred to a new tube, and incubated at 3TC for 1 hour with shaking. Fifty and hundred ).lI of the transformed bacteria were plated on LB agar plates with chloramphenicol, and the plates were incubated at 3TC ovemight. Chloramphenicol was used for the selection of colonies containing the vector pCambia l29lZ at a final concentration of 20 ).lg mr1. Five to ten colonies grown on each plate were
picked, inoculated in 5 ml LB medium with chloramphenicol, and incubated at 3TC for 18 hours with vigorous shaking. A 3 ml aliquot was used for plasmid extraction using the Qiaquick miniprep extraction kit (QIAGEN, Mississauga, ON), following the manufacturer's recommendations. The plasmid was quantified and 100 ng was amplified by PCR using the forward and reverse prim ers for the inserted upstream sequence, i.e. primers RUF and RUR for rice insert and primers AUF and AUR for Arabidopsis insert. The PCR products were analyzed on a 1 % (w/v) agarose gel to confirm the presence of the insert within the pCambia vector. The remaining 2 ml were preserved in a glycerol solution at -80°C for future use.
The plasmid obtained by plasmid miniprep was transformed into both electrocompetent A. rhizogenes and A. tumefaciens by electroporation. The same proto col was repeated, except for the incubation temperature (28°C instead of 3TC), the medium, and agar plates used (MY A instead of LB). Again, colonies containing the appropriate plasmid were stocked in a glycerol solution at -80°C.
2.15 Tobacco root transformation
Tobacco plants were grown for 45 days. Ten plants were used from two different tobacco types, Xanthi and Zimmer. Each plant was defoliated and stems were eut, washed thoroughly, and then sterilized with sterile bleach solution and two drops of Tween-20, followed by three washes with sterile water. Sterilized stems were then eut into 4 cm sections and placed upside down in MS media. Each stem was infected immediately with A. rhizogenes containing the construct of pCambia1291Z-UpstreamSequence and incubated at 23°C under continuous light (Visser et al., 1989; Rivoal and Hanson, 1994). Roots started to emerge from the stem segments after ten days of incubation. They were left to grow for about five more days and then cut out root by root and transferred to MS media with 0.2% phytagel and 500 !!g mrl carbenicillin. Roots were left to grow for a week in darkness, and newly grown parts were transferred to new MS media with 250 !!g mr1 carbenicillin, then to 100 !!g mr1, 50 !!g mr1 carbenicillin and finally to
MS media without carbenicillin. Carbenicillin is a bacteriostatin that progressively frees the medium of A. rhizogenes growing on the roots while maintaining root growth. For pCambia 1291Z, hygromycin was used as the selective antibiotic at a concentration of 25 !!g mr1 for tobacco. The antibiotic was added with lower concentration of carbenicillin (50 !!g mr1) and in MS
media without carbenicillin. In the final medium, the roots that grew normally in the presence of the selective antibiotic Were selected and transferred to new MS media with 25 !!g mr1 chloramphenicoL Sorne of these roots Were transferred to
MS media with 25 /lg mr1 chloramphenicol and 1 mM -SeN. The visually selected roots were grown for an additional two weeks to have enough materials to test them by GUS assay. This assay allowed the analysis of gusA expression in control roots (no -SeN) and roots exposed to -seN.
2.15.1 GUS Assay on tobacco roots
Roots grown normally in hygromycin-supplemented media either containing or lacking -SeN were harvested in 90% acetone. The samples were incubated for 20 minutes at room temperature, placed on ice, and washed in the staining buffer (50 mM sodium phosphate buffer pH 7.2, 0.2% (v/v) Triton X-100, 2mM potassium ferrocyanide, and 2 mM potassium ferricyanide). The staining buffer was removed and fresh buffer with 2 mM GUS reagent X-Glue was added. The samples were infiltrated under vacuum for 20 minutes and left for 16 hours at room temperature in the dark for GUS reaction to take place. The solution was removed and the roots were washed with a 20-35-50% (v/v) ethanol series for 30 minutes each. The samples were then immersed in the fixative solution FAA (50% (v/v) ethanol, 10% (v/v) glacial acetic acid, and 5% (v/v) formaldehyde) for 30 minutes followed by a wash with 70% (v/v) ethanol. Tissues were left in the ethanol solution for 2 hours to remove aIl chlorophyll before examination under the dissecting microscope.
2.16 Arabidopsis mesophyU protoplasts transformation
The protocol of Sheen (Sheen, 2002) was used for transfection of protoplasts of Arabidopsis mesophylls with the plasmid DNA. Leaves were cut carefully and incubated in cellulose/macro enzyme solution for 3 to 4 hours until the protoplasts were released, tuming the solution green. The solution was filtered through a 35 ~mnylon mesh in a 30 ml centrifuge tube and centrifuged in Beckman GS15R centrifuge at 4°C at 100 g for 2 minutes to pellet the protoplasts. The pellet was washed and resuspended in W5 solution (154 mM NaCI, 125 mM CaClz, 5 mM KCI, and 2 mM MES pH 5.7) to get 106 protoplasts per ml. The solution was centrifuged again under the same centrifugation conditions and the protop1ast pellet resuspended in MMg solution (0.4 M mannitol, 15 mM MgClz, and 4 mM MES pH 5.7) for PEG transfection. For each sample, 1 00 ~l of protoplasts were added to 1 0 ~l of the plasmid (2 ~g) in microcentrifuge tube and mixed weIl. Twelve samples for the pCambia construct, three samples for positive control (Super GUS vector), and three samples for negative control (pCambia1291Z vector alone) were prepared. Then PEG solution (4 g PEG-4000, 200 mM mannitol, and 100 mM CaClz) was added and mixed with the protoplasts and DNA. The solution was incubated for 30 minutes, diluted in W5 solution, and centrifuged in a microcentrifuge at 4°C at 100 g for 1 minute to remove PEG. The protoplast pellet was resuspended in W5 solution and added to 1 ml W5 solution in 6-well tissue culture dishes. The dishes were left for 16 hours with shaking at room temperature.
2.16.1 GUS assay on protoplasts
Transfonned protoplasts were transferred to micro centrifuge tubes and centrifuged in a micro centrifuge for 5 minutes at 1,200 rpm to pellet the protoplasts. The pellet was resuspended in GUS extraction buffer (50 mM NaP04
pH7, 10 mM ~-mercaptoethanol, 10 mM EDTA, 0.1% (w/v) sodium lauryl sarcosyl, and 0.1 % (v/v) Triton X-l 00), and incubated on ice for 5 minutes. Each sample was subjected to 4 cycles of ultrasound to burst the protoplasts and centrifuged in a microcentrifuge for 5 minutes at 14,000 rpm. The supematant containing the proteins was transferred to a new tube. Five j.li of the supematant was added to 245 !-lI of GUS reagent (4.4 mg mrl MUG (4-methylumbelliferyl-~ D-glucuronide) in 20% (v/v) methano1, in GUS extraction buffer). At times 0, 60 and 180 minutes, a dilution of one-tenth of each sample in GUS stop-buffer (0.2 M Na2C03) was quantified using the spectrophotometer fMax Fluorescence Microplate Reader, and at the excitation and emission wavelengths of 360 and 455 nm, respectively.
2.17 Transformation through floral dip
Two month old Arabidopsis plants were transfonned using the floral dip method of Zhang et al. (Zhang et al., 2006). Positive clones of A. tumafeciens were plated on MY A medium with chloramphenicol. A single colony was inoculated into 5 ml MY A broth with chloramphenicol and grown at 28°C for two days. The five ml culture was then added to 500 ml MY A broth and incubated at 28°C until the cells reached the stationary phase at OD600 of 1.5. The culture was
centrifuged in Beckman J2-HS centrifuge at 4,000 G for 10 minutes to pellet the bacteria. The pellet was resuspended in 5% (w/v) sucrose solution. Just before dipping, 0.02% (v/v) of Silwet L-77 was added to the solution, and six plants were subject to floral dip using the authors' recommendations. The plants were wrapped in Saran wrap and put on their sides for 16 hours, after which the Saran wrap coyer was removed and the plants were transferred to a growth chamber and left to grow in long days (16-24 hours of light per day) for one month. The seeds were collected at maturity and sterilized, through a single wash with 70% ethanol containing 2 drops of Tween-20 for 5 minutes, followed by three washes with 95% ethanol for 5 minutes each. The seeds were spread on MS media containing 25 )..tg mrl hygromycin and 100 )..tg mrl carbenicillin, placed at 4°C for three days for vernalization then transferred to grow in a growth chamber at 23 oC under continuous light (50-100 microEinsteins) for 10 days. The plants showing normal growth were transferred for another 10 days to fresh MS media with the same antibiotic. The experiment was stopped at this point because there was no time to continue and wait for the se1ected plants to grow for another month. GUS assay on transgenic plants could be done as in section 2.17.1.
3. Results
3.1 Optimization of ·SeN concentrationsThe first step in the identification of -SCN-induced promoters was to expose A. thaliana and rice seeds or plants to the optimal concentrations of the ion.
For A. thaliana, it was shown that seeds could germinate and grow at ·SCN concentrations below 2 mM. Figure 1 shows the growth of plants under different concentrations of the toxic ion. At 0.5 mM (Figure lb), the seeds germinated and grew normally compared to those grown on normal MS media (Figure la). At 1 mM -SCN (Figure 1c), the plantlets showed reduction in growth. Plants in normal media were healthy and green, whereas plants in media containing 1 mM ·SCN were shorter in length, and had a lighter green color. This result indicated that the ·SCN concentration had an effect on the phenotype of the plants, implicating a possible effect on the gene expression. At 2 mM -SCN (Figure Id), the effect oCSCN was more visible. At concentrations above 2 mM (4 mM, Figure 1 e), a low percentage of seeds germinated and the growth of the plants were drastically reduced, indicating that -SCN started to be toxic for the plants. As shown in Figure If, at 10 mM -SCN, the seeds were merely germinating and plant growth was drastically reduced. Figure 1 g represents a comparison in the growth of a plant in normal medium, at 0.5 mM, and 1 mM -SCN. The same pattern of growth was observed for control and 0.5 mM -SCN-treated plant. The difference in growth was observed when the plant was exposed to 1 mM-SCN.
Figure 1. Response of A. thaliana plants to different concentrations of -SCN. Plantlets growing in (a) unsupp1emented MS medium, (b) under 0.5 mM -SCN, (c) 1 mM -SCN, (d) 2 mM -SCN (e) 4 mM -SCN, and (t) 10 mM -SCN-containing media. (g) Comparison of plants growing in normal, under 0.5 mM, and 1 mM -SCN -containing media.
As mentioned in section 2.2, rice plants do not contain the TMT gene. In contrast to A. thaliana, seeds were not able to germinate in media containing -SCN, due to the ion toxicity. Therefore, seeds were germinated in unsupplemented MS medium, and seedlings were transferred to -SCN-containing media. Plants were able to grow in the media containing less than 50 mM -SCN (5 mM, 10 mM, 25 mM, and 50 mM). Plants were dead above this concentration (figures not shown). Pants were showing reduced growth in concentrations below 50 mM -SCN, compared to those grown in normal MS media, but they were able to survive. Note that although A. thnaliana contains the TMT gene, they were only able to grow at lower concentrations of In terms of time, the plants exposed to these -SCN concentrations were left to grow for one, two or three days. After 4 days, plants were starting to die, indicating that they were not able to withstand the stress of the ion toxicity anymore. Rice was able to grow at a much higher concentrations than A. thaliana, because rice seeds did not germinate in presence of -SCN. A. thaliana seeds germinated in the presence of the toxic ion, and were not able to withstand a higher concentration after germination and when they were growmg.
After exposing plants to different -SCN concentrations, it was concluded that -SCN had an effect on A. thaliana plants at concentrations of 1 mM and 2 mM. Seeds would germinate and grow under these concentrations and plants would be used for analysis. In the case ofrice, 1 mM, 5 mM, 10 mM, and 50 mM -SCN-exposed plants for one day were chosen for analysis.
Total RNA was extracted from both control and -SCN-exposed rice and A. thaliana plants. The amount of RNA isolated from a 100 mg plant material ranged from 100 ng to 2 Ilg. Figure 2 shows typical RNA sampi es from both plants at different -SCN concentrations.
18SrRNA
25s
Figure 2. Checking RNA integrity on agarose gel. (a) Rice RNA extracted from
control and -SCN-exposed plants. (b) A. thaliana RNA extracted from control
and -SCN-exposed plants. The RNA that are not degraded are chosen for use in
'\
Figure 3. Checking rice RNA integrity on agarose gel after treatment with DNaseI for the removal of any contaminant DNA. Those RNA are used for differential display analysis.
3.2 Micorarray analysis
RNA was extracted from A. thaliana plants and sent to Genome Québec and McGill Innovation Center for analysis on the Arabidopsis ATHl-121501 • .. Genome Chip Array. Three sets of 10 J..lg of total RNA _. the control RNA and RNA from plants exposed to 1 mM and 2 mM -SCN - were reverse transcribed, and hybridized with three arrays. Because of the high frequency of false positives encountered in microarray analysis, it is usually recommended to use a minimum of three replicates for each treatment. Besides, the use of many replicates allows more accurate statistical ana1ysis for more accurate comparison in the level of expression between the control array and the tested array. The objective was to compare the gene expression patterns in control and -SCN-exposed plants (1 and 2 mM -SCN). The construction of between-class scatterplots was used to identify possible differential expression between control and treated samples. The between-class plots consist of the average expression of each gene in treated samples versus the expression of the gene in the control sample. Figure 4 represents a between-class plot with +> 2.5 fold change. The fold change is the ratio of the average expression in treated samples (average for 1 mM -SCN and 2 m -SCN-treated plants) to the control sample, or vice versa. The probe sets highlighted in green are those that meet the specified fold change. In the plot, the x-axis value is the control sample intensities for each probe, and the y-axis is the average of the treated sample intensities for each probe. The probes that are above