HAL Id: hal-02328483
https://hal.archives-ouvertes.fr/hal-02328483
Submitted on 22 May 2020
HAL is a multi-disciplinary open access
archive for the deposit and dissemination of
sci-entific research documents, whether they are
pub-lished or not. The documents may come from
teaching and research institutions in France or
abroad, or from public or private research centers.
L’archive ouverte pluridisciplinaire HAL, est
destinée au dépôt et à la diffusion de documents
scientifiques de niveau recherche, publiés ou non,
émanant des établissements d’enseignement et de
recherche français ou étrangers, des laboratoires
publics ou privés.
Towards the optimal use of an existing MRE electrical
network from an electrothermal perspective
Charles-Henri Bonnard, Anne Blavette, Salvy Bourguet, François Rongère,
Thibaut Kovaltchouk, Thomas Soulard
To cite this version:
Charles-Henri Bonnard, Anne Blavette, Salvy Bourguet, François Rongère, Thibaut Kovaltchouk, et
al.. Towards the optimal use of an existing MRE electrical network from an electrothermal
perspec-tive. IEEE PES Innovative Smart Grid Technologies (ISGT) Europe, Sep 2019, Bucharest, Romania.
�10.1109/ISGTEurope.2019.8905532�. �hal-02328483�
Towards the optimal use
of an existing MRE electrical network
from an electrothermal perspective
C.-H. Bonnard
∗, A. Blavette
∗, S. Bourguet
†, F. Rong`ere
‡, T. Kovaltchouk
§and T. Soulard
¶ ∗Universit´e de Rennes, CNRS, SATIE laboratory, Rennes, France.Email: Charles-Henri.Bonnard@ENS-Rennes.fr, Anne.Blavette@ENS-Rennes.fr
†Universit´e de Nantes, IREENA laboratory, Saint-Nazaire, France. Email: Salvy.Bourguet@Univ-Nantes.fr ‡Formerly with ´Ecole Centrale de Nantes, now with D-ICE Engineering, Nantes, France.
Email: Francois.Rongere@dice-engineering.com
§Formerly with Univ. Rennes, now with the Lyc´ee Roosevelt, Reims, France. Email: Thibaut.Kovaltchouk@ac-reims.fr ¶Ecole Centrale de Nantes, LHEEA laboratory, Nantes, France. Email: Thomas.Soulard@EC-Nantes´
Abstract—Marine renewable energy (MRE) is an interesting sustainable source of power. However, planning the cost-effective integration of MRE, and in particular of wave energy, in the energy mix remains a challenge as its levelized cost of energy (LCOE) is still greater than these of more conventional energy sources. This paper describes a preliminary study about the energy production management of a simulated point absorber-based WEC farm that could be installed in the vicinity of the SEM-REV site, i.e. the French multi-technology open sea test site. The proposed approach is based on the temporal analysis of the electrothermal behavior of the export cable of the SEM-REV. The models developed under Matlab-Simulink®, are generic and can be easily extended to other WEC types and more sophisticated models and control strategies, as well as to other energy sources (e.g. offshore wind). It is demonstrated in this work that there is room to maximize the utilization of the export cable, which allows to increase wave electricity production during a predetermined sea-state sequence with limited to no curtailment.
I. INTRODUCTION
Marine renewable energy (MRE) is an interesting and sus-tainable source of power. However, planning the integration of MRE, and in particular of wave energy, in the energy mix re-mains a challenge as its levelized cost of energy (LCOE) is still greater than these of more conventional energy sources [1], [2], [3]. Many studies have addressed the design optimization of the MRE farms electrical infrastructure. More precisely, they have mainly focused on cable length and rated current [4], [5], [6], [7], [8], and WECs spatial layout [9], [10]. One of the next steps consists in addressing the future challenges regarding the use of the electric infrastructures, such as the existing test sites (e.g. SEM-REV, bimep). In particular, this paper discusses the potential for increasing the number of WECs in a wave farm without grid reinforcement by taking into account less conservative, and more realistic, operational constraints. This approach stems from the observation that highly conservative, and relatively irrelevant, design constraints are generally ap-plied to wave farms. More precisely, the design of a wave farm export cable is based on the maximum value of the electric current profile flowing through the cable, regardless
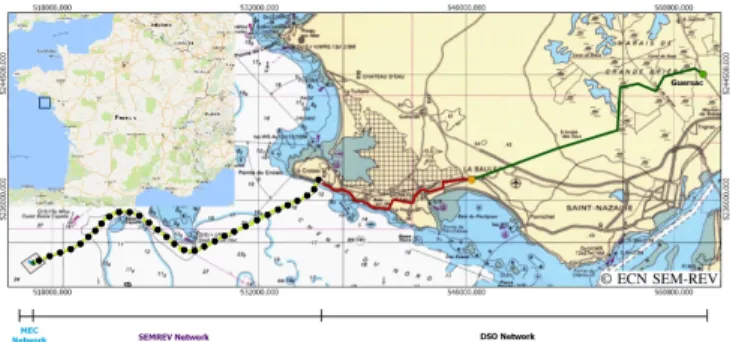
of the duration during which it is applied to the latter. In other words, this method considers implicitly that a fictive, constant current profile, whose magnitude is equal to the actual maximum current value, is applied to the cable at any time [11], [12], [13]. Based on this observation, and on the potentially highly fluctuating power output of a wave farm, one of our previous studies showed that a submarine power cable can carry, on a temporary basis, significantly more current than its rated value, the latter being evaluated under fictive, constant current conditions [14]. Hence, it was proposed to consider thermal limits rather than current limits, as the latter may be quite irrelevant in the case of a highly fluctuating current output. This approach is similar to the concept of dynamic line rating (DLR) used for transmission lines in that it proposes to consider dynamic thermal limits rather than to rely entirely on a fixed current limit established under worst or near-worst case conditions [15]. However, these two approaches differ as in DLR, several current limits are defined based on varying external meteorological conditions (e.g. wind speed, air temperature). On the contrary, in our approach, the external conditions, such as soil temperature and moisture for instance, are constant but the potential for electric current increase is made possible by 1) the soil large heat capacity, 2) the variable nature of the wave energy resource. This is illustrated in Fig. 1 where a current profile and the corresponding temper-ature profile are shown: despite large current fluctuations, the environment (soil and sea) acts as a damper with a certain thermal inertia, thus leading to temperature fluctuations of smaller magnitude. In this work, we are going one step further and we present a preliminary study about the optimal energy production management of a wave farm inspired from the SEM-REV test site, i.e. the French multi-technology open sea testing site managed by Ecole Centrale de Nantes [16]. As shown in Fig. 2, it is located near Le Croisic (France). Thanks to the thermal inertia of the overall system, composed of the cable and of its environment (soil and sea), and the fluctuating current generated by a wave farm, a submarine export cable
500 600 700 800 900 1,000 0.1 0.2 0.3 0.4 0.5 0.6 0.7 Time (s) RMS Curren t (kA) RMS Current 76 78 80 82 T emp eratu re ( ◦C) Core temp.
Fig. 1. Example of a RMS current profile generated by a WEC farm composed of 20 WECs considering a Hs= 6 m and Tp= 9 s sea-state. The current
profile is very fluctuating and ranges between 70 A and 700 A while in the same time the temperature varies only from 76°C to 81°C.
Fig. 2. The SEM-REV open sea test site is located in western France, near Le Croisic. The physical installation of the 24 km export cable studied in this paper follows the dotted path. It connects the SEM-REV offshore hub to an onshore substation and finally to the local network belonging to French DSO Enedis (red and dark green paths). Figure modified, courtesy of ´Ecole Centrale de Nantes [16].
can temporarily carry more current than its rated value, which is defined under static, (near-)worst case conditions, as men-tioned earlier. This paper describes three case studies based on a direct-drive, point absorber-based WEC farm with negligible energy storage, thus presenting a highly variable power output. The point absorbers are controlled passively with a damping factor depending on the sea-state considered. Our approach is two-fold. First, as electric currents greater than the rated value can be safely tolerated in the system on a temporary basis, we analysed whether the wave electricity production during highly energetic sea-states could be increased with limited to no curtailment, thus leading to an increased wave farm capacity factor. Second, a simple farm power production strategy has been applied by (de)activating the WECs with respect to marine weather conditions (i.e. sea-state parameters) in order to maximize the overall energy production while still not exceeding the thermal constraints. The proposed approach, implemented under Matlab-Simulink®, is generic and can be extended to other WEC types and to more sophisticated models and strategies. The rest of the paper is divided into four sections. Section II describes the electrothermal modeling of the cable that transmits the energy to the onshore network. Then, Section III describes the numerical simulations. Finally, Section IV details the results, followed by the conclusion of the paper.
Fig. 3. Cross section picture of the export cable considered for our case studies. This3 × 95 mm2 copper cores cable (that was designed to carry a
constant electric current of 290 A) is currently installed in the SEM-REV test site located off Le Croisic (see Fig. 2), France and is managed by ´Ecole Centrale de Nantes [16].
II. CABLE ELECTROTHERMAL MODELING
The model used in this study is intended to reproduce the electrothermal behaviour of the 24 km export cable installed in the SEM-REV test site (see Fig. 2). We considered that this 3-phase, 20 kV, XLPE insulation cable is buried at a 1.5 m depth in soil, where thermal properties are deemed to be homogeneous and constant, and where thermal resistivity ρth= 0.7 m·K·W-1 and heat capacity Cth= 2 MJ·m-3·K-1.
Also, based on a previous work [18], it was considered necessary that the cable materials consider the temperature dependence of the specific heat Cp(T ) in J/(kg.K), of the
thermal conductivity κ(T ) in W/(m.K), and of the electrical resistivity ρe(T ) in Ω.m. One can find the materials data
we used in [19], [20], [21], [13]. However, compared to our previous models based on the finite element method[14], and which required an important computing time, in this paper a simplified model based on the well-known analogy between electrical and thermal physics [23], [13], and implemented under the Matlab-Simulink® software [22], was used for the sake of computing speed.
III. NUMERICAL SIMULATIONS
A. Introduction
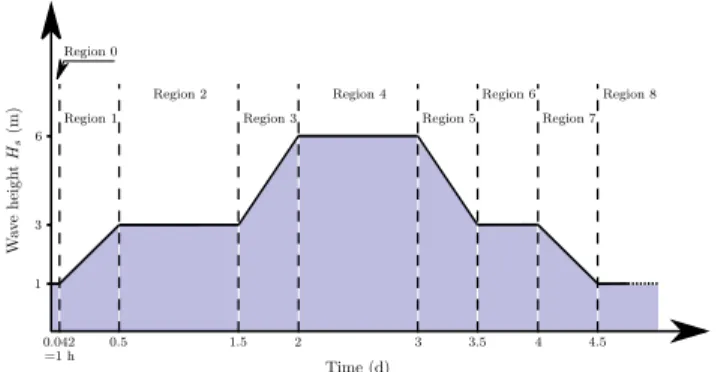
All the case studies presented in this paper used the same sea-state sequence shown in Fig. 4. Regarding the initial conditions, we used a predefined sea-state with wave height Hs = 1 m and wave period Tp = 12 s. It was assumed that
at initial time t=0 s, the system was in a dynamic steady-state where the cable temperature fluctuates around a constant value which is assumed to be the initial temperature for the simulations considered here. We have also computed the cable current carrying capacityIcc ≈ 330 A which corresponds to
the maximum constant RMS value of the current that can be transmitted in the cable without exceeding the maximum allowed temperature of the cable cores, i.e.Tmax= 90 °C for
a XLPE-insulated cable, as it is the case here. The difference between the rated value of 290 A and the calculated current carrying value, i.e Icc ≈ 330 A, may be explained by the
fact that we do not consider potential hot spots, which could be the case at landfall or at each junction box. Also, a
Region 2 Region 1 Region 0 Region 3 Region 4 Region 5 Region 6 Region 8 Region 7 Time (d) W av e heigh t Hs (m) 0.042 0.5 1.5 2 3 3.5 4 4.5 =1 h 1 3 6
Fig. 4. Sequence of sea-states that has been used for all simulation cases (see Table I). Note that it is a completely fictitious sequence but based on plausible durations and transitions between each sea-states based on Fig. E2 and E3 of [17].
TABLE I
DESCRIPTION OF THE SEA-STATE SEQUENCE+.
Region Wave height Hs(m) Duration (h)
0 1 1 1 1 to 3 12a 2 3 24 3 3 to 6 12b 4 6 24 5 6 to 3 12b 6 3 12 7 3 to 1 12a 8 1 12
+The sea-states sequence is based on a single peak period T
p= 12 s, for
all wave heights Hs.
bIncrease or decrease by step of∆H
s= 0.2 m distributed uniformly over
the region duration.
cIncrease or decrease by step of∆H
s = 0.25 m distributed uniformly
over the region duration.
security margin, unknown to the authors of this paper, may have been taken into account in the initial design studies, thus decreasing the value of the rated current. Without more information on these specific points, we deliberately chose to use the highest value, i.e. Icc ≈ 330 A, as a reference.
This constitutes a worst-case scenario leading to a minimal margin for current increase. However, it is important to note that the goal of this paper is to assess the potential for current increase on a submerged, continuous section of an export cable, independently of the influence of other cable elements and parts for which specific actions, such as replacement, may be undertaken.
B. Current profile generated by a WEC farm
In order to model the wave farm, we used a wave-to-wire model implemented under Matlab-Simulink®, as described in [24]. The farm was composed of up to 36 identical 1 MVA heaving buoys controlled passively, as modelled in [25]. Note that a single peak period Tp = 12 s is considered, i.e. the
value of the damping factor Bpto is constant and equal to
Bpto = 680 × 103 Nms. Due to the random nature of wave
power, the power generated by a WEC farm, especially when it is based on direct-drive point absorbers with little to no storage, can be extremely fluctuating. This is reflected in the current that flows in the export cable as shown in [26], [14] and as illustrated in Fig. 1.
C. Case studies description
The main objective of this paper is to determine the number of additional WECs which could be installed in the farm without exceeding the cable cores temperature constraints. To do so, three different scenarios are considered:
• Case 1 : The number of WEC is kept constant with NW EC = NW ECi .NW ECi corresponds to the maximum
number of WECs which can be connected to the wave farm without exceedingIcc, i.e.
max (If arm(t)) |NW EC ≤ Icc (1) • Case 2 : NW EC is also kept constant with NW EC =
NW EC+ .NW EC+ corresponds to the maximum number of WECs which can be connected to the wave farm without exceeding the cable cores temperature constraints, i.e.
max (Tcore(t)) |NW EC ≤ Tmax (2) • Case 3 : The number of WECs NW EC = NW ECv is
allowed to vary. This can be achieved by (de)activating WECs between different sea-states. However, the cable cores temperature constraints must still be satisfied, i.e.
max (Tcore(t)) |NW EC(t)≤ Tmax (3)
Case 1 can be seen as corresponding to an initial and existing WEC farm where the conservative approach considering only maximum current constraints. Case 2 can be envisaged as improvement over Case 1 where temperature constraints are considered instead of current constraints. In this case,NW EC
is constant throughout the sea-state sequence. Finally, Case 3 is deemed to represent a further enhancement compared to Case 2, asNW ECis allowed to vary. It is important to note that
in this preliminary study, economical considerations were not taken into account. In other words, the number of additional WECs (either NW EC+ or Nv
W EC) was not limited due to
economical reasons, but only due to technical constraints. This was meant to assess, at a first stage, the theoretical potential for farm expansion. This paper can therefore be considered as presenting a proof-of-concept study. Once this step is validated, further work will include additional constraints, including economical ones.
IV. RESULTS
A. Case 1
As we can see in Fig 5, the temperature of the cable cores is far below the limit of 90 °C that is suggested in IEC standards and is used by many power cables manufacturers. Such results confirm, as shown in a previous study [14], [18], that eq. (1) was not suitable for sizing power cables in the case of a WEC farm generating highly fluctuating currents. A
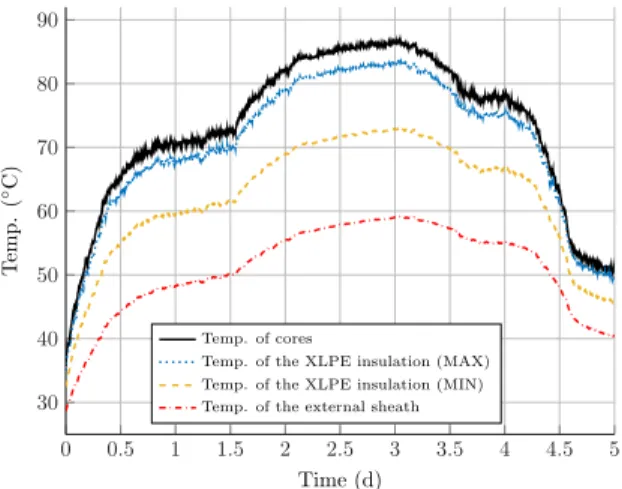
0 0.5 1 1.5 2 2.5 3 3.5 4 4.5 5 30 40 50 60 70 80 90 Time (d) T emp. ( ◦C) Temp. of cores
Temp. of the XLPE insulation (MAX) Temp. of the XLPE insulation (MIN) Temp. of the external sheath
Fig. 5. Temperature calculated in different locations of the cable for Case 1, i.e. with a wave farm composed of 11 WECs. As we can see, the cable cores temperature are far fromTmax= 90 °C, as allowed by the manufacturer and
suggested in IEC standards.
0 0.5 1 1.5 2 2.5 3 3.5 4 4.5 5 30 40 50 60 70 80 90 Time (d) T emp. ( ◦C) Temp. of cores
Temp. of the XLPE insulation (MAX) Temp. of the XLPE insulation (MIN) Temp. of the external sheath
Fig. 6. Temperature calculated in different locations of the cable for Case 2, i.e. with a wave farm composed of 13 WECs. As we can see, the cable cores temperature is close to Tmax= 90 °C.
number of 11 WECs has been found (NW ECi = 11). This
number corresponds to the number defined based on the most conservative approach taking into account maximum current constraints only. It will be used as the baseline to compare the results for the two other case studies.
B. Case 2
The results of Case 2 are presented in Fig. 6. In this case, 2 more WECs could be installed in the farm permanently, i.e. (NW EC+ =Ni
W EC+ 2). This represents an increase of 18.2%,
both in terms of WEC number and in terms of harnessed energy compared to Case 1 (see Table II). It is also worth mentioning that the temperature of the cable external sheath, which is in direct contact with the soil, is close to the maximum limit that is generally recommended to prevent the soil from drying out. A maximum value of 60°C may be allowed, considering that the soil is sufficiently humid [27], which is supposed to be the case in a sea water environment.
0 0.5 1 1.5 2 2.5 3 3.5 4 4.5 5 30 40 50 60 70 80 90 Time (d) T emp. ( ◦C) Temp. of cores
Temp. of the XLPE insulation (MAX) Temp. of the XLPE insulation (MIN) Temp. of the external sheath
Fig. 7. Temperature calculated in different locations of the cable for Case 3, i.e. with a wave farm composed of 12 to 15 WECs. As we can see, the cable cores temperature is very close to Tmax= 90 °C.
TABLE II
SUMMARY RESULTS OF CASE STUDIES
Case NW EC Energy (MWh) Gaina
1 11 1113 0%b
2 13 1315 +18.2%
3 13 to 25c 1414 +27%
aConsidering the sequence of sea-states given in Fig. 4 and neglecting
the Region 0 that is irrelevant in Case 3.
bConsidered as the reference case. cSee Table III for more details.
C. Case 3
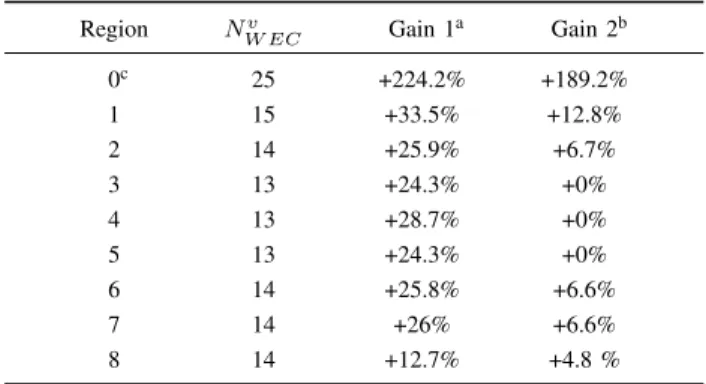
The results of Case 3, whereNv
W EC was varying between
13 to 15, are presented in Fig. 7. Note that we neglect the Region 0, which represents the first step for the computation of the temperature, where initial conditions and short duration of the period lead to an irrelevant number of WECs. One can see that the temperature calculated in Case 3 is closer to Tmax= 90 °C over the total duration of the simulation, which
means that the cable utilization is approaching its maximum. However, considering that the calculated temperature remains below 90 °C over the entire sea-state sequence, there is still room for improvement in terms of energy production with finer tuning and more comprehensive control of the WECs. Excluding Region 0, the expected energy production of Case 3 is between 12.7% and 33.5% more than this of Case 1 and is up to 12.8% more than this of Case 2 (see Table III). If we consider the entire duration of the simulation, Case 3 generates 27.0% more energy than this of Case 1, which is significant (see Table II). In Case 3, the external sheath temperature reaches and finally exceeds slightly the value of 60°C, and may thus require to lower the number of WECs. It is worth mentioning that, in this sense, the temperature of the external sheath can be a bottleneck and may require further studies as we discussed in Section IV-B (Case 2) .
TABLE III
DETAILED RESULTS AND ENERGY PRODUCTION GAIN FORCASE 3.
Region Nv W EC Gain 1a Gain 2b 0c 25 +224.2% +189.2% 1 15 +33.5% +12.8% 2 14 +25.9% +6.7% 3 13 +24.3% +0% 4 13 +28.7% +0% 5 13 +24.3% +0% 6 14 +25.8% +6.6% 7 14 +26% +6.6% 8 14 +12.7% +4.8 % aCompared to Case 1. bCompared to Case 2.
cFirst step of the simulation. Due to the initial temperatures and the
short duration of Region 0, the number of WECs is irrelevant.
V. CONCLUSION
The study described in this paper, that can be seen as a proof-of-concept analysis, deals with the optimal use of an existing MRE farm and is focused on the thermal response of the export cable to the fluctuating current of a wave farm in a sea-state sequence that considers different wave heights. It is shown that the combination of a wave farm fluctuating current and the thermal inertia of the cable and of its direct environment, composed of the soil and of the sea, may allow an increase of the number of WECs in the existing farm, which could lead to an increase of the energy production of up to 27%. This is an interesting option that could be considered to maximize the utilization of the MRE farms electrical infrastructure. The study also highlights some potential bottlenecks such a slightly excessive external sheath temperature, which could lead the soil to dry out. Future work will consider nearly a year of real sea-state data from the SEM-REV test site, which will allows us to perform a more comprehensive study with the use of a realistic and longer sea-state sequence.
ACKNOWLEDGMENT
The research work presented in this paper was conducted in the frame of the BlueGrid project, funded by the Brittany Regional Council and the ENS-Rennes, which are gratefully acknowledged. It is worth mentioning that this work would not have been possible without the help of ´Ecole Centrale de Nantes that manages the SEM-REV test site.
REFERENCES
[1] S. Astariz, A. Vazquez, and G. Iglesias, “Evaluation and comparison of the levelized cost of tidal, wave, and offshore wind energy,” Journal of Renewable and Sustainable Energy, vol. 7, no. 5, p. 053112, 2015. [2] S. Astariz and G. Iglesias, “The economics of wave energy: A review,”
Renewable and Sustainable Energy Reviews, vol. 45, pp. 397–408, 2015. [3] A. Uihlein and D. Magagna, “Wave and tidal current energy–a review of the current state of research beyond technology,” Renewable and Sustainable Energy Reviews, vol. 58, pp. 1070–1081, 2016.
[4] D. Bull, M. Baca, and B. Schenkman, “Electrical cable utilization for wave energy converters,” Journal of Ocean Engineering and Marine Energy, pp. 1–16, 2018.
[5] A. Wijethunga, J. Ekanayake, and J. Wijayakulasooriya, “Collector cable design based on dynamic line rating for wind energy applications,” Journal of the National Science Foundation of Sri Lanka, vol. 46, no. 1, 2018.
[6] R. Olsen, J. Holboll, and U. S. Gudmundsdottir, “Dynamic temperature estimation and real time emergency rating of transmission cables,” in Power and Energy Society General Meeting, 2012 IEEE. IEEE, 2012, pp. 1–8.
[7] O. Dahmani, “Mod´elisation, optimisation et analyse de fiabilit´e de topologies ´electriques ac de parcs ´eoliens offshore,” Ph.D. dissertation, Universit´e de Nantes, 2014.
[8] F. Sharkey, E. Bannon, M. Conlon, and K. Gaughan, “Dynamic electrical ratings and the economics of capacity factor for wave energy converter arrays,” in European Wave and Tidal Conference (EWTEC), 2011. [9] H. Bailey, B. Robertson, and B. Buckham, “Variability and stochastic
simulation of power from wave energy converter arrays,” Renewable Energy, vol. 115, pp. 721–733, 2018.
[10] R. Carballo and G. Iglesias, “Wave farm impact based on realistic wave-wec interaction,” Energy, vol. 51, pp. 216–229, 2013.
[11] Calculation of the Cyclic and Emergency Current Rating of Cables. Part 2: Cyclic Rating of Cables Greater Than 18/30 (36) kV and Emergency Ratings for Cables of all Voltages, International Electrotechnical Com-mission Std., 1989.
[12] IEC standard, Electric cables Calculation of the current rating Part 1-1: Current rating equations (100 % load factor) and calculation of losses General, International Electrotechnical Commission (IEC) Stan-dard 60 287-1-1:2006, Dec. 2006. [Online]. Available:
[13] IEC standard, Electric cables Calculation of the current rating Part 2-1: Thermal resistance Calculation of thermal resistance, International Elec-trotechnical Commission (IEC) Standard 60 287-2-1:2006, May 2006. [14] A. Matine, C.-H. Bonnard, A. Blavette, S. Bourguet, F. Rong`ere, T.
Ko-valtchouk, and E. Schaeffer, “Optimal sizing of submarine cables from an electro-thermal perspective,” in European Wave and Tidal Conference (EWTEC), 2017.
[15] A. Michiorri, H.-M. Nguyen, S. Alessandrini, J. B. Bremnes, S. Dierer, E. Ferrero, B.-E. Nygaard, P. Pinson, N. Thomaidis, and S. Uski, “Forecasting for dynamic line rating,” Renewable and Sustainable Energy Reviews, vol. 52, pp. 1713 – 1730, 2015.
[16] ´Ecole Centrale de Nantes. (2018) The SEM-REV website. [Online]. Available: https://sem-rev.ec-nantes.fr/english-version/
[17] P. Ruggiero, R. A. Holman, J. A. Barth, M. C. Haller, H. ¨Ozkan-Haller, J. C. Allan et al., “Sediment transport study: Baseline observations and modeling for the reedsport wave energy site,” 2009.
[18] CEA, IFFSTAR, IREENA, LHEEA, Nexans France, RTE, and SEM-REV, “Maintenance corrective et prdictive des cbles de fermes nergtiques offshore,” EMODI project : ANR-14-CE05-0032, Tech. Rep., 2018. [19] J. E. Mark et al., Physical properties of polymers handbook Second
edition. Springer, 2007, ch. 9 : Heat Capacities of Polymers. [20] R. Eichhorn, “A critical comparison of xlpe-and epr for use as electrical
insulation on underground power cables,” IEEE Transactions on Electrical Insulation, no. 6, pp. 469–482, 1981.
[21] X. Qi and S. Boggs, “Thermal and mechanical properties of epr and xlpe cable compounds,” IEEE Electrical Insulation Magazine, vol. 22, no. 3, pp. 19–24, 2006.
[22] MATLAB, version 9.5.0.944444 (R2018b). The MathWorks Inc., 2018. [23] A. Robertson and D. Gross, “An electrical-analog method for tran-sient heat-flow analysis,” Journal of research of the national bureau of standards, vol. 61, no. 2, p. 105, 1958.
[24] A. Blavette, T. Kovaltchouk, F. Rong`ere, M. J. de Thieulloy, P. Leahy, B. Multon, and H. B. Ahmed, “Influence of the wave dispersion phe-nomenon on the flicker generated by a wave farm,” in European Wave and Tidal Energy Conference (EWTEC), 2017.
[25] T. Kovaltchouk, B. Multon, H. B. Ahmed, J. Aubry, F. Rongre, and A. Glumineau, “Influence of control strategy on the global efficiency of a direct wave energy converter with electric power take-off,” in 2013 Eighth International Conference and Exhibition on Ecological Vehicles and Renewable Energies (EVER), March 2013, pp. 1–10.
[26] A. Babarit, J. Hals, M. Muliawan, A. Kurniawan, T. Moan, and J. Krokstad, “Numerical benchmarking study of a selection of wave energy converters,” Renewable Energy, vol. 41, pp. 44 – 63, 2012. [27] E. Dorison, Mod´elisation et dimensionnement des liaisons souterraines.