Titre:
Title
: Efficient cloud tracing: From very high level to very low level
Auteurs:
Authors
: Yves J. Bationo, Naser Ezzati-Jivan et Michel R. Dagenais
Date: 2018
Type:
Communication de conférence / Conference or workshop itemRéférence:
Citation
:
Bationo, Y. J., Ezzati-Jivan, N. & Dagenais, M. R. (2018, janvier). Efficient cloud tracing: From very high level to very low level. Communication écrite présentée à IEEE International Conference on Consumer Electronics (ICCE 2018), Las Vegas, NV, USA (6 pages). doi:10.1109/icce.2018.8326353
Document en libre accès dans PolyPublie
Open Access document in PolyPublie
URL de PolyPublie:
PolyPublie URL: https://publications.polymtl.ca/4201/
Version: Version finale avant publication / Accepted versionRévisé par les pairs / Refereed Conditions d’utilisation:
Terms of Use: Tous droits réservés / All rights reserved
Document publié chez l’éditeur officiel
Document issued by the official publisher
Nom de la conférence:
Conference Name: IEEE International Conference on Consumer Electronics (ICCE 2018)
Date et lieu:
Date and Location: 12-14 janvier 2018, Las Vegas, NV, USA
Maison d’édition:
Publisher: IEEE
URL officiel:
Official URL: https://doi.org/10.1109/icce.2018.8326353
Mention légale:
Legal notice:
© 2018 IEEE. Personal use of this material is permitted. Permission from IEEE must be obtained for all other uses, in any current or future media, including
reprinting/republishing this material for advertising or promotional purposes, creating new collective works, for resale or redistribution to servers or lists, or reuse of any copyrighted component of this work in other works.
Ce fichier a été téléchargé à partir de PolyPublie, le dépôt institutionnel de Polytechnique Montréal
This file has been downloaded from PolyPublie, the institutional repository of Polytechnique Montréal
Efficient Cloud Tracing: from Very High Level to
Very Low Level
Yves J. Bationo
Ecole Polytechnique Montreal Montreal, Quebec h3t 1j4 [email protected]
Naser Ezzati-jivan
Ecole Polytechnique Montreal Montreal, Quebec h3t 1j4
Michel R. Dagenais
Ecole Polytechnique Montreal Montreal, Quebec h3t 1j4 [email protected]
Abstract—With the increase of cloud infrastructure complexity, the origin of service deterioration is difficult to detect because issues may occur at the different layer of the system. We propose a multi-layer tracing approach to gather all the relevant information needed for a full workflow analysis. The idea is to collect trace events from all the cloud nodes to follow users’ requests from the cloud interface to their execution on the hardware. Our approach involves tracing OpenStack’s interfaces, the virtualization layer, and the host kernel space to perform analysis and show abnormal tasks and the main causes of latency or failures in the system. Experimental results about virtual machines live migration confirm that we are able to analyse services efficiency by locating platforms’ weakest links.
Index Terms—Cloud, OpenStack, QEMU, Tracing, LTTng. I. INTRODUCTION
Many cloud environments are based on OpenStack, a large collection of services that makes it difficult to track down errors for system administrators. Identifying and understand-ing any failed operation requires the gatherunderstand-ing of execution data from logs and then analysis of the interaction of the modules involved in this specific task. Performance latency may be caused by factors like bugs in code, an inappropriate configuration of the systems or hardware troubles which are often imperceptible. Systems tracing grants fine-grained analysis of the cloud components as it provides precise data about resources’ state changes, and allows observing the delay occurring between any request and response and understanding the internal logic of these systems [6]
The investigation starts by knowing what kind of activity was operated from users’ interfaces to the kernel of the machine where the task is running. Indeed we need to know which applications or services are involved in the task degradation and on which host they are located. That is why it is important to have enough information about the cloud nodes by reporting their whole work. We propose to trace hosts user space and kernel space, correlate their outputs and provide illustration about their behaviour. This paper aims to analyse cloud infrastructure and furnish meaningful reports to understand any activity latency.
The contribution is as follows:
• Instrumentation and tracing of OpenStack nova project
• Multi-level analysis model to get cloud system data
• vitualization views to detect and understand performance issues in nova
• Virtual machines live migration performance survey
The remainder of this paper is organized as follows. Section II describes the related work. OpenStack nova service analysis is introduced in section III. Section IV is focused on middle layer investigation and Section V is about low levels tracing and analysis. Finally, section VI presents some experimental results.
II. RELATEDWORK
Increasing interest in cloud computing has lead to the devel-opment of many tools for monitoring and troubleshooting like OSprofiler [17]. OSprofiler is a library used to trace python applications and to get events from OpenStack services. For each request, it generates one trace about services’ actions. The data is extracted to build a call-tree that shows the request flow and gives an estimation of the task performance. But its usage is not suitable when the latency is due to some issues in the host operating system.
Mi et al. [13] propose a way to locate performance issues within applications logs. They record information during the execution of requests to retrieve the behaviour of the worker. From any request which induces service degradation, they aim to pick up the abnormal function. This method is extended by Ruben [1] which addresses the problem of analysing tasks workflows and service orchestration in the cloud. In his approach, python applications are instrumented by adding some codes to be executed during task processing. He presents data-flow views illustrating service dependencies based on file calls. However, this method is not sufficient to represent the cloud infrastructure: collected data are not enough because the work is focused on the management software written in python and not on the whole computer.
Montes et al. [9] introduced the idea of monitoring levels in a virtualized environment. They proposed a taxonomy and a tool called GMonE to cover all cloud components’ analyses. Their work defines, according to the platform infrastructure, different interfaces for both providers and consumers to fulfill their management decision and to guarantee the QoS specified in the service level agreement. Following this concept, Mar-quezan et al. [12] deal with the problem of identifying which management actions need to be performed in the cloud during a specific task. They proposed a method to display records in a three-dimensional data space instead of looking at them as isolated reports. They provided diagrams that reveal the situation leading into some conflicting management actions.
The concept does not define how data are collected but rather proposes a way to analyse them as a single block by defining some metrics for the virtualization layer and the physical one. Information is collected from different layers of the computing node to make more efficient decisions. Nemati et al. [15] [16] proposed a technique to analyse the VM’s behaviour by tracing the host kernel. Their work is limited to display what actions are appropriate for the cloud owner. But in this paper, we plan to show how to dig into the cloud based systems to get detailed information for troubleshooting and performance analysis.
III. OPENSTACKNOVA TRACING
In this section we explain how to investigate the high-level layer and the type of information we are able to get from nova services.
A. Nova tracing design
Tracing nova fulfills two purposes: debugging services and host behaviour surveying. As nova is composed of many services, we have a lot of log files to investigate in order to pinpoint possible causes of failures. But, for the end users who in most cases are not involved in the nova development process, finding the cause of an issue when a task goes wrong can become a difficult operation. And when they succeed in detecting the failed task, another trouble will be finding which factors lead to that problem. However requests from and responses to guests are essential to locate any deficiency and to recover VMs states and the task repartition among computing devices. To report about works’ disruption, we proceed to the instrumentation of only interesting methods like those related to virtual machine life cycle. Our work is based on nova logging activity so adding trace points is just as simple as writing log in python script. Thereby tracing process benefits from current logs describing the system components’ states. We standardised the log format to make output investigation less difficult while we provide the most interesting information to help for easy monitoring and debugging. In this work, we choose to write the logs in JSON format and retrieve values about event types and instance objects which define the different attributes of the virtual machinesTable-I displays a short list of events we prescribe for nova analysis; more events and the tracing requirement can be find in [2]. Usually in a cloud environment we have more nodes running nova services so we must collect logs from all of them and be sure that log traces are synchronised.
sub-services events nova-compute instance.create.{start/end} nova-compute instance.power_off.{start/end} nova-scheduler scheduler.select_destinations.{start/end} nova-conductor provider_fw_rule.{start/end} nova-driver libvirt.find.migration.min.data.{start/end} nova-network allocate.network.instance.{start/end} nova-network lease_fixed_ip.instance.{start/end} TABLE I
NOVA EVENTS[SHORT LIST] B. Nova Trace Analysis
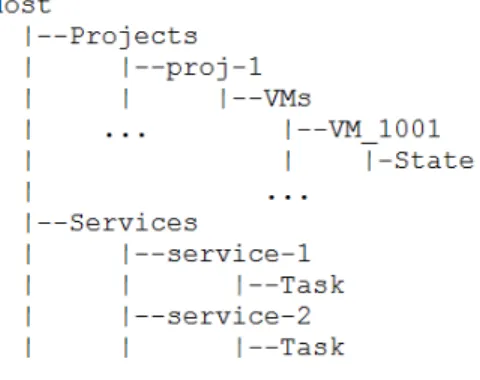
All the high-level views are based on the attribute-tree defined in Fig-1. They are created using TraceCompass which
Fig. 1. Nova System Attribute Tree
generates a "state provider" [14] to relate the behaviour of the resource reported in the trace collection. Each attribute node represents a system resource: in this model, we consider ’VM State’ to represent the current condition of the virtual machine and ’Service Task’ state to describe the service activity. Our analysis views give a detailed illustration of the cloud high-level infrastructure.
• VM state investigation: we mainly focus our audit on virtual machines, services and physical resources. As the user requests impact the virtual machine, knowing the current state of the guest is a good way to deduce services failures when instance state does not change as expected. The instance can take many states as defined in Table-II according to the activity executed on the guest through nova-compute service. The VM state view (Fig-2) shows the state by time interval of each instance in the cloud system.
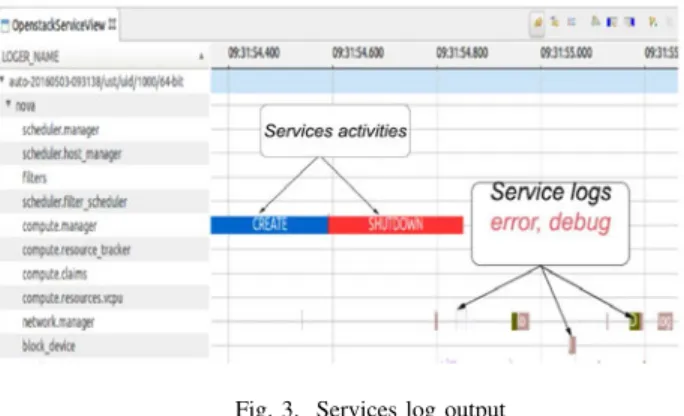
• Services performance analysis: We investigate functions processing by providing some performance measure-ments: the time to execute an operation. With the service view (Fig-3) we estimate nova main tasks efficiency like scheduling process to show the performance of filter algorithms which select the compute node where to launch the guest. We are able to check load balancing among services by detecting inactive workers thanks to services output in the view.
• Survey request flow: Network congestion or messaging hub bottlenecks will reduce task efficiency. We have to check activity process to ensure that no service is waiting unnecessarily for another and verify that the request is handled as expected by the workers.
• Troubleshooting: Nova components generate logs (Fig-3) that depend on the fault severity like debug, warning, error. For each critical log, we pinpoint the request flow leading to that fault by identifying the sensitive operation. Then we can identify the critical function and start debugging.
• Resource consumption: The quantity of available com-puting resources in the traced environment gives us a good appreciation of service behaviours and platform resource usage. We fully instrumented nova
compute-manager to get precise report about resource usage in such a way that we get data for creation, update or deletion of any virtual device. Based on this information, we provided graphs about virtual machines repartition per host, VCPU usage, and ram reservations.
Information of OpenStack layer are not really accurate and we need more details from system low levels. In the next section we explain how to survey virtualization layer based on QEMU feature.
Fig. 2. Nova Instance State Changes
VM State Description
BUILDING It proves that the VM creation start; block device and volume are mapped to the VM instance and the network IP is assigned.
ACTIVE Shows that any operation on the VM lifecycle is complete, and VM is fully running.
STOPPED related virtual machine is not using the computing resource anymore, all the memory is stocked in the physical storage.
RESIZED VM is stopped and is not running on the source node but is running on the destination node. VM is located on two different hosts at the same time, waiting for a commit.
MIGRATING VM is migrating from one host to another, this state is different from resizing because the VM at the source is not stopped during the task.
ERROR Something goes wrong during the operation, VM state is unrecoverable.
TABLE II NOVA INSTANCE STATES
IV. VIRTUALIZATIONLAYERTRACING
In this paper, the middle layer corresponds to the virtual-ization layer which is known as the hypervisor [19]. We use QEMU [18] on top of KVM [11]. QEMU is a hardware device emulator which provides a virtual interface for physical disk and network resources usage. KVM is included in the Linux kernel and uses the hardware extension to accelerate the task and supports guests to run unmodified OS images.
Fig. 3. Services log output
This level performs memory abstraction and achieves the mapping of the guest memory to the physical one. In such
environments, the guest does not have direct access to the host memory. On top of that, the virtualization layer provides, with the help of the CPU abstraction mechanism, some VCPUs (virtual CPU) for each VM. However, that process requires trapping critical operations in the VMM so that the resource access would be unified in the host to guarantee the stability of the system [10]. But, non-sensitive instructions of VM are run directly to improve the performance. Otherwise, it also handles the multiplexing operation of I/O requests of the virtual machine on the physical host. By tracing QEMU with LTTng we get all these internal activities and find the memory leaks or the memory access contention between virtual machines and figure out how QEMU handles their requests to the hardware. We analyse middle layer information of the VM by using QEMU events following the attribute tree described in Fig-4. We identify virtual machine main activity and their sub-tasks which provide more details about their current behaviour. The operation provided by qemu can be VM creation, live migration or VM destruction. In this work, we use current trace-points of QEMU application. Here we contribute by defining some metrics and algorithms for TraceCompass to generate graphs and views. These algorithms and the list of events we use to survey guest migration is available at [2].
Fig. 4. Nova System Attribute Tree
V. KERNELLAYER TRACING
In this section, we address low-layer tracing using LTTng for physical devices investigation. Giraldeau et al. [7] show how to understand services stagnation by analysing kernel traces to find the source of bottlenecks. They were able to pinpoint any latency due to network or CPU contention. Their work can be extended to OpenStack nova workers which interact to handle consumers’ requests. After knowing which service is concerned with an issue from high layers, we can explain its task performances with kernels trace investigation. So any service which waits unnecessarily for another can be detected if we know its workflow. Both services and virtual machines are viewed from the kernel traces as processes shared resources. That is why we can analyse them as regular processes which use computing resources and get their con-sumption based on system metrics as introduced by Desnoyers [5] and Giraldeau [8]. Processes of the host compete with each other to use the CPU and when one of them gets the CPU for a long time, it impacts other processes’ execution time and performance because they stayed in long blocking state waiting their turn. That mechanism causes resource sharing interferences which has a bad effect upon virtual
machines applications. We consider three main factors when we investigate kernel processes’ efficiency:
CPU utilization - waittime: total time the process was waiting
for the CPU. A process with high priority monopolised the CPU for such a long time that other processes have to wait until it has finished its task. And cpuusage: is the time the
process uses the CPU, it will give an idea of how much the virtual machine is consuming in the whole system.
Memory usage - gives the memory usage per service or guest process and more accurate information about memory leaked when a virtual host is using memory pages without releasing them.
I/O access statistics - provides the I/O operation latency, net-work and disk access. A lot of features for resource utilization analysis are available in LTTng and Tracecompass tools to analyse the kernel of the host and get fine-grained information to explain system usage and show service degradation.
VI. EXPERIMENTS:LIVE MIGRATION CASE In this section, we perform some experiments about VM live migration and the way we record the traces of our cloud installation and achieve execution analysis. The trace used in this paper is available online [2]. Live migration is a technique to move a virtual machine from one host to another physical device. Among the virtualization technologies, it is one of the most important providing resiliency and resource availability in the cloud environment. This operation is used in many cases to reach performance objective. For example, when the guest workload increases, migration operation will relocate it in a new host with more resources to reach its demand. Live migration analysis requires the gathering and the correlation of the information from the three layers both on the source, the destination, and the controller host. On nova side, migration is performed as described by Fig-5.
i. select destination host (controller): finds compatible destination hosts in the cloud environment. These phys-ical machines must support the virtual machine param-eters and pass the filtering process. Scheduling service will pick up one of them as a destination host.
ii. start migration process (source host): starts migration on the source host and alarms the destination to be ready for the operation.
iii. pre-migration step (destination host): gets the block device and network information of the instance and prepares to setup network on the destination.
iv. migration monitoring (source host): contacts QEMU to proceed the migration and pulls QEMU monitor to get the operation state until it finishes or fails. Rollback the process if the migration time exceeds the default interval time specified or if the migration fails.
v. post-migration (source host): detaches the volume con-nection to the instance, disables network address, un-plugs virtual network interface on the source host, cleans up and updates nova database.
vi. post-dest-migration (destination host): sets up a net-work on the destination host and updates instance
in-formation; the virtual machine is fully running on the destination.
Fig. 5. Nova Live Migration activity
Nova-compute service pulls the hypervisor to get the current state of the migration process. As migration is handled by QEMU, nova does not have access to migration internal state, so when something goes wrong, nova cannot find what is happening but will perform a rollback task by releasing the resource and cleaning up the destination machine.
Fig. 6. Live Migration: Qemu steps
We complete these high-level information with QEMU events for more details about the operation. Qemu proceeds to the migration in three steps (Fig-6): during the first step, all the memory is moved to the destination. In iteration copy phase, the dirty memory is transferred in several rounds until there is not enough dirty-data and then the virtual machine is stopped at the source, the memory is moved and the VM is resumed at the destination: that is the stop-and-copy phase. To improve the performance analysis, we define some sub-steps for each of them [Fig-6]: load stage when the memory is loaded by QEMU, compress stage describes the compression of the memory, transfer step happened when memory is sent to the destination.
Live migration has to deal with a lot of challenges that can reduce the QoS of applications running inside the virtual machine. Moreover increasing the number of guests in a host leads VMs to concurrently compete for physical resources utilization which causes service degradation. Bloch et al. [3] identify some interferences in cloud environment which possibly produce a bad effect upon a live migration process.
• Co-location interference - VM migration requires extra usage of the CPU and the bandwidth to move guest data. Unfortunately, the productivity of applications running inside the physical host will be reduced.
• Network interference - network I/O virtualization suffers from virtual interruptions to guests VMs. Moreover, mi-gration bandwidth usage degrades communication among VMs.
• Resources interference - migration reduces resource avail-ability and raises CPU or memory contention. At the
destination, a memory space will be assigned to the newly created VM and that operation will disturb the existing VMs. However, live migration will take more time to complete if there is not enough spare CPU.
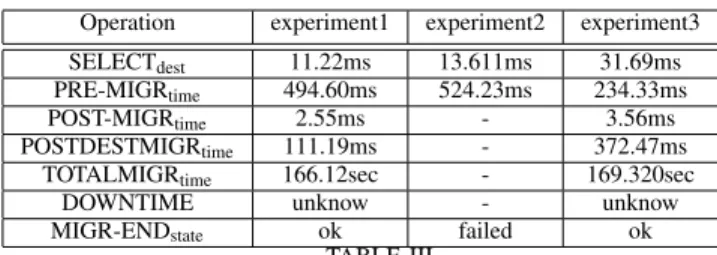
In this paper we performed two experiments on virtual ma-chines live migration and report its efficiency according to these challenges. There are several parameters used to ap-preciate live migration like the Migration time which refers to the total time used to copy the device memory from one physical host to another and resume it. The downtime is the time interval when VM is not running during the stop-and-copy step. Clark [4] demonstrates that downtime is critical as it may cause service disruption. In the literature, migration downtime is estimated by pulling the virtual machine interface until it responds but that is not accurate. Here we get the downtime by deducing it from the Qemu event. The downtime is related to stop and copy time in our Qemu activity view(Fig-7). We are able to estimate with high efficiency, memory copy stages and down time. For these live migration experiments we proceed according to the following steps: (a)-start tracing OpenStack nova, QEMU, kernel of the controller, source and destination host using LTTng stream to collect trace files automatically on a specified node. (b)-run live migration process. (c)-stop tracing after migration complete. (d)-upload trace in Tracecompass to synchronize and generate the view.
Operation experiment1 experiment2 experiment3 SELECTdest 11.22ms 13.611ms 31.69ms PRE-MIGRtime 494.60ms 524.23ms 234.33ms
POST-MIGRtime 2.55ms - 3.56ms
POSTDESTMIGRtime 111.19ms - 372.47ms TOTALMIGRtime 166.12sec - 169.320sec
DOWNTIME unknow - unknow
MIGR-ENDstate ok failed ok
TABLE III
EXPERIMENTS PERFORMANCE RESULTS FROM HIGH LEVEL
A. Experiment-1
We proceed to the first test by migrating a virtual machine and retrieving all possible trace from the nodes’ three layers. We reduce the environment’s activity to be sure that no process will interfere with the migration task. Table-III shows the result we get from the high-level layer about the main parameter. As expected, downtime is unknown at this stage, that is why we need QEMU level trace. Performance of the first experiment serves as the benchmark when studying other experiments. Fig-7 describes all the stage of the migration, the number of the copy-round and the downtime estimation. B. Experiment-2
Here we analyse the impact of VM interferences during live migration. We try to migrate a VM co-located with four virtual machines which have a high demand in resource: To increase the interference we use a stress tool for these guests. The migration succeeds but takes much more time than the first experiment (Table-III). This behaviour is explained by the low-level layer analysis with the kernel trace. In this case,
Fig. 7. Experiment-1: Migration succeeds; dirty-pages curve converges
VMs share the physical resources with other processes of the host. For illustration, in Fig-8 the virtual machine VM-23405 is waiting for CPU while other VMs are using the resources. Any process with high priority will confiscate the CPU and reduce VM-23405 access time. Moreover, the preemption of the migrated virtual machine increases the migration time. The interference of co-located VMs really matters when we want to perform migration quickly. The more the VM is preempted the more its activity takes time to complete. We can estimate the virtual machine preemption rate, explain its service latency and deduce that it is better to increase, if possible, VM process priority before moving it to another host.
Fig. 8. Experiment-3: vm-2340 migration takes much more time to complete
Fig. 9. VM Preemption: vm-2340 interferes with vm-1000 VII. CONCLUSION
In this work, we presented a multi-layer trace-based cloud analysis approach. The idea is to trace the virtualization layer, the kernel space of the VMs and the kernel space of any host involved in the cloud and associate the outputs. We also introduced OpenStack nova tracing to provide enough data for troubleshooting and load balancing survey in the cloud infrastructure. It works by correlating data from the compute manager, virtualization and kernel layers and performing work analysis and following any request made by the cloud users. Our live migration experiments show that we are able to pinpoint OpenStack services failures and understand in most case work latency. But the efficiency of some tasks is
hard to report due to the lack of data related to the network service. For future work, we plan to analyse the request flow in network functions virtualization by tracing Neutron and Opendaylight.
ACKNOWLEDGMENT
The authors would like to thank Mohamad Gebai for as-sistance with QEMU tracing, Genevieve Bastien and William Ahouma for reviewing this paper.
REFERENCES
[1] R. Acuña, Z. Lacroix, and R. A. Bazzi. “Instrumentation and Trace Analysis for Ad-Hoc Python Workflows in Cloud Environments”. In: 2015 IEEE 8th International Conference on Cloud Computing. June 2015.
[2] Yves Bationo. nova trace analysis.URL: https://github. com/yvesjunior/openstack-service-analysis.
[3] Ms Tarannum Bloch, R Sridaran, and CSR Prashanth. “Analysis and Survey of Issues in Live Virtual Machine Migration Interferences.” In: International Journal of Advanced Networking & Applications(2014).
[4] Christopher Clark et al. “Live Migration of Virtual Machines”. In: Proceedings of the 2Nd Conference on Symposium on Networked Systems Design & Implemen-tation - Volume 2. NSDI’05. 2005, pp. 273–286. [5] Mathieu Desnoyers. “Low-Impact Operating System
Tracing”. PhD thesis. 2009.
[6] Naser Ezzati-Jivan and Michel R. Dagenais. “Multi-scale navigation of large trace data: A survey”. In: Con-currency and Computation: Practice and Experience 29.10 (2017). e4068 cpe.4068, e4068–n/a.ISSN: 1532-0634. DOI: 10.1002/cpe.4068. URL: http://dx.doi.org/ 10.1002/cpe.4068.
[7] F. Giraldeau and M. Dagenais. “Wait analysis of dis-tributed systems using kernel tracing”. In: IEEE Trans-actions on Parallel and Distributed Systems PP.99 (2015), pp. 1–1.
[8] Francis Giraldeau et al. “Recovering system metrics from kernel trace”. In: Linux Symposium 2011. [9] “GMonE: A complete approach to cloud monitoring”.
In: Future Generation Computer Systems 29.8 (2013), pp. 2026–2040.
[10] Kai Hwang, Jack Dongarra, and Geoffrey C. Fox. “Dis-tributed and Cloud Computing: From Parallel Process-ing to the Internet of ThProcess-ings”. In: 1st. San Francisco, CA, USA: Morgan Kaufmann Publishers Inc., 2011. [11] KVM main page.URL: http://www.linux-kvm.org/. [12] C. C. Marquezan et al. “3-D cloud monitoring: Enabling
effective cloud infrastructure and application manage-ment”. In: 10th International Conference on Network and Service Management and Workshop. Nov. 2014. [13] H. Mi et al. “Performance problems diagnosis in cloud
computing systems by mining request trace logs”. In: 2012 IEEE Network Operations and Management Sym-posium. Apr. 2012, pp. 893–899.
[14] A. Montplaisir-Gonçalves et al. “State History Tree: An Incremental Disk-Based Data Structure for Very Large Interval Data”. In: Social Computing (SocialCom), 2013 International Conference on. Sept. 2013, pp. 716–724. [15] H. Nemati and M. R. Dagenais. “Virtual CPU State De-tection and Execution Flow Analysis by Host Tracing”. In: 2016 IEEE International Conferences on Big Data and Cloud Computing (BDCloud). Oct. 2016, pp. 7–14. [16] Hani Nemati, Suchakrapani Datt Sharma, and Michel R. Dagenais. “Fine-grained Nested Virtual Machine Performance Analysis Through First Level Hypervi-sor Tracing”. In: Proceedings of the 17th IEEE/ACM International Symposium on Cluster, Cloud and Grid Computing. CCGrid ’17. 2017, pp. 84–89.
[17] OSProfiler–. URL: https : / / specs . openstack . org / openstack/zaqar-specs/specs/kilo/osprofiler.html. [18] Qemu main page.URL: http://wiki.qemu.org.
[19] M. Rosenblum and T. Garfinkel. “Virtual machine monitors: current technology and future trends”. In: Computer38.5 (May 2005), pp. 39–47.