HAL Id: hal-01008201
https://hal.archives-ouvertes.fr/hal-01008201
Submitted on 2 Nov 2018
HAL is a multi-disciplinary open access archive for the deposit and dissemination of sci-entific research documents, whether they are pub-lished or not. The documents may come from teaching and research institutions in France or abroad, or from public or private research centers.
L’archive ouverte pluridisciplinaire HAL, est destinée au dépôt et à la diffusion de documents scientifiques de niveau recherche, publiés ou non, émanant des établissements d’enseignement et de recherche français ou étrangers, des laboratoires publics ou privés.
Experimental study on carbonation of concrete for
performance based specifications
Emmanuel Rozière, Ahmed Loukili, Gilles Pijaudier-Cabot, François Cussigh
To cite this version:
Emmanuel Rozière, Ahmed Loukili, Gilles Pijaudier-Cabot, François Cussigh. Experimental study on carbonation of concrete for performance based specifications. FraMCoS-6 - 6th International confer-ence on fracture mechanics of concrete and concrete structures, 2007, Catania, Italy. �hal-01008201�
Experimental study on carbonation of concrete for performance based
specifications
E. Rozière, A. Loukili, & G. Pijaudier-Cabot
Institut de Recherche en Génie Civil et Mécanique, Ecole Centrale de Nantes, Nantes, France
F. Cussigh
GTM Construction, Nanterre, France
ABSTRACT: This study is part of a research programme aimed at designing performance-based specifica-tions for durability of concrete, through the equivalent performance concept. A concrete mixture will be qualified for a given exposure if appropriate tests show that concrete is at least as durable as a concrete mix-ture which complies with prescriptive specifications from the standard. This study deals with carbonation, as it is a widely spread and relatively well known exposure. 8 concrete mixtures were designed by varying three parameters – water/binder ratio, fly ash content, and aggregate type – and they comply with specified limits. As each concrete mixture underwent two curing conditions, 16 sets of specimens were made. The accelerated test showed good sensitivity and pointed out significant variability of performances. A comprehensive study of properties of porous net including commonly used durability tests suggested that behaviour of concrete ex-posed to carbonation would not only depend on porosity but on chemical properties of binder.
1 INTRODUCTION
Carbonation of concrete is a chemical reaction be-tween CO2 from air and hydrates – mainly
portland-ite Ca(OH)2 – from cimentitious matrix. It results in
production of calcite CaCO3 and in a drop of pH in
concrete, which may lead to corrosion of reinforce-ment and spalling of surface concrete. Although it is not the most severe it is a very common degradation and it has been defined as an exposure class – as well as corrosion due to chloride penetration, freeze/thaw cycles, chemical attacks – in new stan-dard NF EN 206-1 (2004). As in most of stanstan-dards, specified limits are given for maximum wa-ter/cement ratio, minimum cement content, and maximum mineral admixture proportions. The speci-fied limits are deemed to ensure aimed durability of concrete, provided that good construction practices are followed. But the same set of specifications may lead to different actual levels of durability, and this prescriptive approach does not take into account ad-vances in concrete research, which might have pointed out more relevant parameters to assess dura-bility resulting of a concrete mixture than composi-tion parameters (Baroghel-Bouny et al. 2004). Euro-pean standard does not give such durability parameters and criteria but it take into account the need for performance-based specifications through the equivalent performance concept. In accordance with this concept, a concrete mixture is qualified for a given exposure if its potential durability is at least as good as test performances of the reference
con-crete mixture, which complies with prescriptive specifications. The purpose of this experimental study is to investigate the variability of perform-ances of concrete mixtures which comply with threshold values of prescriptive requirements. Con-crete mixtures have been designed by varying wa-ter/cement ratio, binder composition, and aggregate type. The effect of curing condition has been inves-tigated on the eight concrete mixtures. As good sen-sitivity and repeatability of performance tests are necessary to design a comparative performance-based approach, they are also an interesting result of this study. The performance test is the accelerated carbonation test, according to the French AFPC-AFREM procedure. Carbonation depths have been compared with results from usual durability tests, as porosity, gas permeability, and diffusivity are often considered as relevant parameters to assess potential durability. A study of porous distribution and prop-erties of porous net through mercury intrusion po-rosimetry has been carried out to confirm results and understand effects of composition and curing on global properties.
2 EXPERIMENTAL PROCEDURE 2.1 Materials, mix proportions and curing
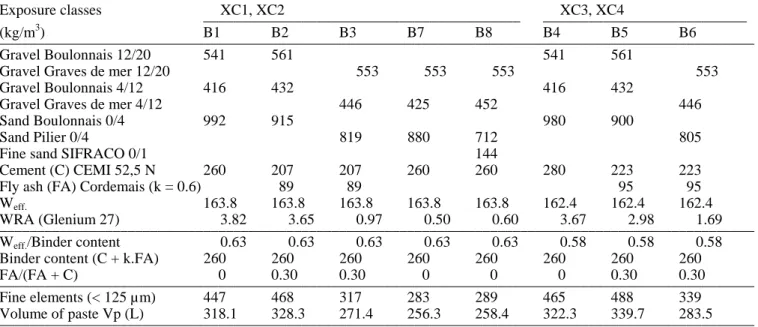
Eight concrete mixtures have been designed by choosing two values of each following composition parameters, namely: water/binder ratio, binder type, aggregates, as shown in Table 1. The two
Table 1. Mix proportions. ____________________________________________________________________________________________________ Exposure classes XC1, XC2 XC3, XC4 __________________________________________ ___________________________ (kg/m ) B1 B2 B3 B7 B8 B4 B5 B6 ____________________________________________________________________________________________________ 3 Gravel Boulonnais 12/20 541 561 541 561
Gravel Graves de mer 12/20 553 553 553 553 Gravel Boulonnais 4/12 416 432 416 432
Gravel Graves de mer 4/12 446 425 452 446 Sand Boulonnais 0/4 992 915 980 900
Sand Pilier 0/4 819 880 712 805 Fine sand SIFRACO 0/1 144
Cement (C) CEMI 52,5 N 260 207 207 260 260 280 223 223 Fly ash (FA) Cordemais (k = 0.6) 89 89 95 95 Weff. 163.8 163.8 163.8 163.8 163.8 162.4 162.4 162.4
WRA (Glenium 27) 3.82 3.65 0.97 0.50 0.60 3.67 2.98 1.69 ____________________________________________________________________________________________________ Weff./Binder content 0.63 0.63 0.63 0.63 0.63 0.58 0.58 0.58
Binder content (C + k.FA) 260 260 260 260 260 260 260 260 FA/(FA + C) 0 0.30 0.30 0 0 0 0.30 0.30 ____________________________________________________________________________________________________ Fine elements (< 125 µm) 447 468 317 283 289 465 488 339 Volume of paste Vp (L) 318.1 328.3 271.4 256.3 258.4 322.3 339.7 283.5 ____________________________________________________________________________________________________
water/binder ratios 0.63 and 0.58 were chosen from the maximum values for XC1-XC2 and XC3-XC4 classes (defined in NF EN 206-1, Table NA.F.1). These exposure classes respectively correspond to ordinary and high carbonation risk. Binder contents comply with the same requirements, they are the minimum values given in French standard. The same Portland cement CEM I 52,5 N was used in all con-crete mixtures, fly ash content of B1, B2, B5, and B6 concrete mixtures is the maximum mineral ad-mixture content which complies with prescriptions from the standard, that is 30 % of binder content. Two different aggregates mixtures were used to in-vestigate the effect of aggregate type and aggregate mixture density. Boulonnais sand and gravel are crushed dense limestone, they have been used in other laboratory studies and their main feature is a high proportion of fine elements. Graves de mer gravels and Pilier sand are sand-lime sea aggregates, they have a low fine elements proportion and a rela-tively high porosity. Very fine sand was used in B8 concrete to compare the effect of mineral admixture (fly ash) with aggregate mixture density.
Two batches of each concrete were made and cast in 7 x 7 x 28 cm molds (for accelerated carbonation test) and cylindrical Ø 11 x 22 cm molds. After 24 hours of sealed curing, the first set of specimens was cured under water for 28 days, and will be referred to as “24 h – Water”. The second set of specimens was sealed cured until concrete reached 50 % of the minimum 28-day characteristic strength from stan-dard, which is 20 MPa for XC1-XC2 classes, and 25 MPA for XC3-XC4 classes. Then they were cured in a room at a constant temperature of 20°C and a con-stant relative humidity of 50 % RH for 28 days. They will be referred to as “50 %”.
2.2 Durability tests
The 16 previously described materials underwent the same set of durability tests, after 28 days. Each test was done on three samples from the same batch, ex-cept the mercury intrusion porosimetry test, which was done on two samples after 90 days.
Compression tests were carried out just after sealed curing and after 28 days, on cylindrical Ø 11 x 22 cm specimens. Gas permeability was measured on cylindrical Ø 11 x 5 cm specimens in accordance with AFPC-AFREM procedure (1997), at a relative pressure of 1.00 bar, to assess apparent permeability, and at five different pressures from 2 bar to 4 bar, to assess intrinsic permeability by Klinkenberg ap-proach.
Accelerated carbonation test was done in accor-dance with AFPC-AFREM procedure, in a carbona-tion chamber at 20°C and 65 % RH, with 50 % CO2
by Laboratoire Matériaux et Durabilité des Con-structions (LMDC) in Toulouse, France. Porosity was also measured in accordance with AFPC-AFREM procedure by LMDC. Chloride diffusivity was assessed from the steady state migration test called LMDC Test.
3 RESULTS AND DISCUSSION 3.1 Global properties
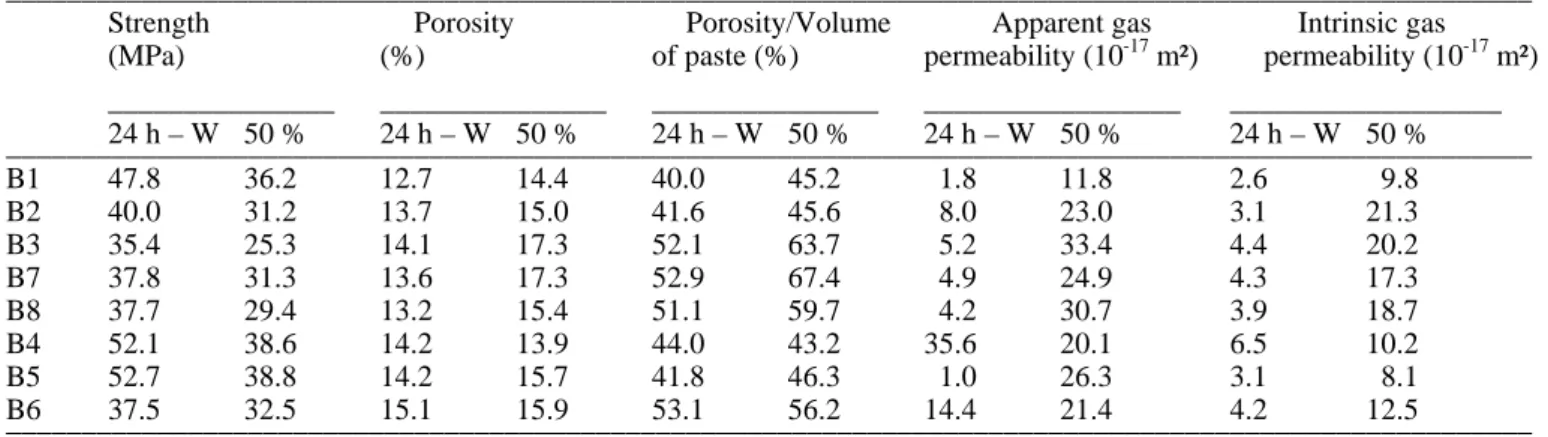
Compressive strength, porosity, gas permeability, chloride diffusivity may be considered as global properties. Comprehensive results are given in Table 2. Each value is the mean value, from three tests on different samples.
Table 2. Global properties
_____________________________________________________________________________________________________ Strength Porosity Porosity/Volume Apparent gas Intrinsic gas (MPa) (%) of paste (%) permeability (10-17 m²) permeability (10-17 m²) _______________ _______________ _______________ _________________ __________________ 24 h – W 50 % 24 h – W 50 % 24 h – W 50 % 24 h – W 50 % 24 h – W 50 % _____________________________________________________________________________________________________ B1 47.8 36.2 12.7 14.4 40.0 45.2 1.8 11.8 2.6 9.8 B2 40.0 31.2 13.7 15.0 41.6 45.6 8.0 23.0 3.1 21.3 B3 35.4 25.3 14.1 17.3 52.1 63.7 5.2 33.4 4.4 20.2 B7 37.8 31.3 13.6 17.3 52.9 67.4 4.9 24.9 4.3 17.3 B8 37.7 29.4 13.2 15.4 51.1 59.7 4.2 30.7 3.9 18.7 B4 52.1 38.6 14.2 13.9 44.0 43.2 35.6 20.1 6.5 10.2 B5 52.7 38.8 14.2 15.7 41.8 46.3 1.0 26.3 3.1 8.1 B6 37.5 32.5 15.1 15.9 53.1 56.2 14.4 21.4 4.2 12.5 _____________________________________________________________________________________________________
A 20-MPa characteristic strength was required for B1, B2, B3, B7, and B8 concrete mixtures, and a 25-MPa characteristic strength was required for B4, B5, and B6 concrete mixtures. 28-day compressive strengths were from 50 % (B6) to 139 % (B1) higher than required. As concrete mixtures comply with maximum Water/Binder ratios and minimum binder contents from the standard, this result may seem sur-prising. However, the highest compressive strengths were measured on concrete including crushed lime-stone aggregates (B1, B2, B4, and B5). The sand contained 7 % of fine elements (below 80 µm), which are not taken into account in binder content. So fine element contents (given in Table 1) could partly explain this difference. The difference in compressive strength of concrete mixtures including crushed limestone or sea aggregates may also come from densities of aggregate mixtures and actual Wa-ter/Binder ratios. Effective water content (Weff.)
dif-fers from added water by the amount of water which is absorbed by aggregates. This is assessed by WA24 (water which is absorbed after 24 hours), given for each type of sand or gravel. Sea gravels were more porous and had a WA24 of 2 %, instead of 0.7 % for limestone gravel. But during batching and curing gravels may not absorb so much water, so the real water content of paste is higher for con-crete made of sea gravels, and its strength is lower.
Porosity results show the same trend and Poros-ity/Volume of paste ratios are consistent with strengths. Volume of paste has been defined as Weff.
+ Volume of fine elements (< 125 µm), it is given in Table 1. 125 µm is the maximum size of cement grains; If it is assumed that porosity of concrete is porosity of paste, Porosity/Volume of paste ratios give porosity of paste (Table 2). It is closely linked to aggregate type, and the significant differences are consistent with what was assumed about real water content of paste to explain differences in strengths. Use of fine sand in B8 concrete mixture reduces concrete porosity and porosity of paste, especially for dry curing (“50 %”). Fly ash would not have such a positive effect on density, but would only have a chemical part. But global properties have been assessed after 28 days, and positive effect of
pozzolanic reaction might not have been observed yet.
The type of curing seems to have a significant ef-fect, especially on gas permeability, as shown in Ta-ble 2. This does not only come from curing condi-tions but from configuration of samples for durability tests. Compressive strengths of studied concrete mixtures are significantly higher than re-quired characteristic strengths. So strength at the end of sealed curing is less than 50 % of real 28-day compressive strength. It actually ranges from 22 % (B1 50 %) to 31 % (B6 50 %). So because of early drying hydration rate of surface concrete of “50 %” samples is relatively low and this explains the in-crease of transfer properties, such as gas permeabil-ity. Finally, for the “50 %” curing condition, the stronger concrete undergoes the worst curing condi-tions. This discrepancy between required and actual compressive strength and its consequences on actual curing is also to be kept in mind to analyze results from carbonation test. But configuration of samples and testing device should also be taken into account to explain effect of curing conditions on gas perme-ability. The test is done on cylindrical Ø 11 x 5 cm specimens sawed from Ø 11 x 22 cm samples. As gas flux is transverse, it may flow through surface concrete layer, which is likely to be more permeable, for the “50 %” curing condition, because of early drying. In real atmospheric conditions, air or gas gets into concrete from the surface, so configuration and effect of curing conditions are different.
3.2 Accelerated carbonation test
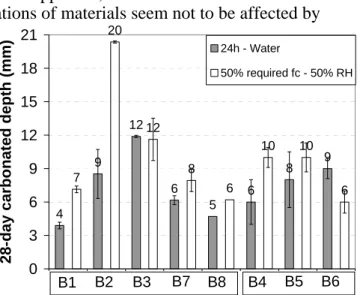
The main result of the accelerated carbonation test is carbonation depth. It is assessed by a colorimetric method on a cross section of prismatic 7 x 7 x 28 cm samples, at 7, 14, 21, 28, and 56 days.
28-day carbonated depths are given in Figure 1. Standard deviations are given on the graph. In spite of dispersion of some results, significant differences may be observed. Most of carbonation depths ranged from 4 to 12 mm, whereas Water//Binder ratio and Binder content were kept constant. So the acceler-ated carbonation test is interesting in a performance
based approach, as it is sensitive. Moreover classifi-cations of materials seem not to be affected by
4 9 12 6 5 6 8 9 7 20 12 8 6 10 10 6 0 3 6 9 12 15 18 21
28-day carbonated depth (mm)
24h - Water 50% required fc - 50% RH B4 B5 B6 B8 B7 B3 B2 B1
Figure 1. Carbonated depths after 28 days of accelerated test.
0 5 10 15 20 25 3 6 9 12 15 18 21
28-day carbonated depth (mm)
Global properties Chloride diffusivity (10-13 m²/s) Porosity (%) Intrinsic permeability (10-17 m²)
Figure 2. Carbonated depths and global properties.
curing condition, which is of great interest in a com-parative approach.
Effects of composition parameters and curing conditions appear on the results of the accelerated test. “Dry” cured (“50 %”) concrete generally had higher carbonation depth than concrete cured under water, except for B6 50 % concrete. It should be noted that this result may not be relevant, as it is not consistent with other properties of the same material (see Table 2) or results for B3 concrete (Fig. 2), which had the same binder and aggregates.
Water/Binder ratio had not systematically the ex-pected effect on carbonation, as B1, B7, and B8 con-crete mixtures (W/B = 0.63) shown lower carbon-ated depth than B4, B5, and B6 concrete mixtures (W/B = 0.58). But the difference between the two W/B ratios is relatively low, and the difference be-tween the water contents – respectively 163.8 and 162.4 L/m3 – is even more reduced (0.9 %), as binder content also varied. So the accelerated test might not have been sensitive enough to show the difference, which also occurred for other properties, such as porosity and gas permeability. The effect of
fly ash is clearer and has already been reported (Pa-padakis 1999). From concrete mixtures which had the same aggregates and W/B ratio, it may be de-duced a negative effect of fly ash. That may be ex-plained by a lower portlandite content of the hydra-tion products. Moreover, pozzolanic reachydra-tion reduces portlandite content. The effect of aggregates could have been more complicated. Moreover the test may not be sensitive enough to draw conclu-sions, and “50 %” curing may have lead to better curing for sea aggregates concrete mixtures than limestone aggregates concrete mixtures, as shown in 3.1. As far as water cured concrete are concerned, from B1/B7, B2/B3, and B5/B6 concrete mixtures, it may be deduced that the crushed limestone aggre-gates lead to better resistance against carbonation. This may come from the density of the mix, as the sea aggregates mix lacks fine elements. In B8 con-crete mixture, fine sand was added, and the concon-crete seemed to have a better behavior than B7.
In Figure 2 the second graph results from durabil-ity tests are plotted against carbonation depth. The highest sensitivity was shown with gas permeability, but no good correlation between global properties and carbonation may be deduced from these results. For instance the same porosity can be associated with very different carbonation rates. This has al-ready been shown in literature (De Schutter & Audenaert 2004).
3.3 Mercury intrusion
As global properties may be difficult to analyze, mercury intrusion porosimetry (MIP) tests have been carried out, to confirm results and to investigate ef-fects of properties of porous net of concrete. Pore size distribution curves and quantitative results, such as porosities, median and average pore diameters, may be useful to analyze properties of concrete (Roy & al. 1999).
MIP tests were carried out on B4 samples after 28 and 90 days, to study the effect of curing condition, as shown in Figure 3. The porous mode which ap-pears clearly at 28 days for “50 %” curing tended to
0 0,02 0,04 0,06 0,08 1 10 100 1000 10000 100000 1000000 Pore diameter (nm)
Log Differential Intrusion (mL/g)
B4 24h W - 90j B4 50% - 90j
B4 24h W - 28j B4 50% - 28j
Median pore diameters
decrease, but it could still be observed after 90 days, and it has an influence on median pore diameter.
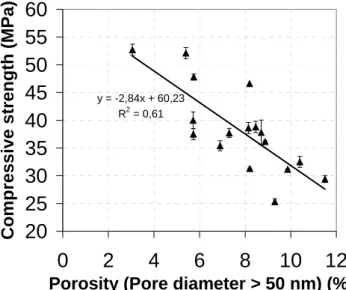
Median pore diameter may be used as a quantita-tive result to be linked to global properties. In Figure 4, compressive strength is plotted against macropo-rosity, which is defined as porosity for pore diame-ters > 50 nm (Basheer & al. 2001).
Compressive strength decreases with an increase in porosity, which is to be linked to W/B ratio of paste. In Figure 5, intrinsic permeability is plotted against median pore diameter. Equations may be found in literature to link porosity and permeability, through MIP and other data. From the results of the study, pore diameter seems to be a relevant parame-ter as far as gas permeability is concerned.
y = -2,84x + 60,23 R2 = 0,61
20
25
30
35
40
45
50
55
60
0
2
4
6
8
10
12
Porosity (Pore diameter > 50 nm) (%)
Compress
ive
strength (MPa)
Figure 4. Compressive strength.
y = 0,21x - 7,42 R2 = 0,86 0 5 10 15 20 25 0 20 40 60 80 100 120
Median pore diameter (nm)
Intrinsic
permeability (10
-17
m²)
Figure 5. Intrinsic permeability.
4 CONCLUSIONS
This study includes accelerated carbonation test and a comprehensive study of porosity of 16 concrete mixtures. It can be used as a work on standards to translate prescriptions into data on potential
durabil-ity and as an investigation on durabildurabil-ity of concrete exposed to carbonation.
In the standard context, the objective was to in-vestigate performances of reference concrete mix-tures for XC exposure classes. Experimental data from accelerated test and other durability tests have shown significant variability of properties and resis-tance to carbonation. Carbonation depths after 28 days of accelerated test ranged continuously from 4 to 12 mm, whereas the studied concrete mixtures had the same binder content and water/binder ratio, in the standard meaning.
This experimental work gives data to investigate the effect of composition parameters and curing conditions. The effect of binder type was found to be more significant than the effect of aggregates type or water/binder ratio. So, for this set of concrete mix-tures carbonation would mainly depend on chemical behavior, rather than density of concrete, and a study on portlandite content of paste and concrete would bring useful data. Saturation degree of concrete has not been assessed but it could explain some trends, as CO2 diffusivity is much higher in dry concrete
than in saturated porosity. Curing condition is a ma-jor parameter, but it has to be defined precisely, and one has to pay attention to the configuration of sam-ples and testing device.
5 ACKNOWLEDGEMENTS
The authors would like to acknowledge the financial support of the Fédération Nationale des Travaux Publics (FNTP), Paris, France. The authors are grateful to Mr. Raphaël Edieux, of LMDC, in Tou-louse, France, for his technical support.
REFERENCES
NF EN 206-1 standard, Béton – Partie 1: Spécification, per-formances, production et conformité, AFNOR, 2004. Baroghel-Bouny, V & al. 2004. Conception des bétons pour
une durée de vie donnée des ouvrages. Paris. Association
Française de Génie Civil.
Compte-rendu des journées techniques AFPC-AFREM Durabi-lité des bétons, Méthodes recommandées pour la mesure des grandeurs associées à la durabilité, 11 et 12 décembre 1997, Toulouse, 1997, p. 121-158.
Papadakis, V. G. 2000. Effect of supplementary cementing ma-terials on concrete resistance against carbonation and chlo-ride ingress. Cement and Concrete Research 30: 291-299. De Schutter, G. & Audenaert, K. 2004. Evaluation of water
ab-sorption of concrete as a measure for resistance against car-bonation and chloride migration. Materials and structures 37: 591-596.
Roy, S.K. & al. 1999.Durability of concrete – accelerated car-bonation and weathering studies. Building and
Environ-ment 34: 597-606.
Basheer, L. & al. 2001. Assessment of the durability of con-crete from its permeation properties: a review. Construction and Building Materials 15: 93-103.