Size Matters: The Impact of Capital Market Liberalization on Individual Firms
32
0
0
Texte intégral
(2) CIRANO Le CIRANO est un organisme sans but lucratif constitué en vertu de la Loi des compagnies du Québec. Le financement de son infrastructure et de ses activités de recherche provient des cotisations de ses organisationsmembres, d’une subvention d’infrastructure du ministère de la Recherche, de la Science et de la Technologie, de même que des subventions et mandats obtenus par ses équipes de recherche. CIRANO is a private non-profit organization incorporated under the Québec Companies Act. Its infrastructure and research activities are funded through fees paid by member organizations, an infrastructure grant from the Ministère de la Recherche, de la Science et de la Technologie, and grants and research mandates obtained by its research teams. Les organisations-partenaires / The Partner Organizations PARTENAIRE MAJEUR . Ministère des Finances, de l’Économie et de la Recherche [MFER] PARTENAIRES . Alcan inc. . Axa Canada . Banque du Canada . Banque Laurentienne du Canada . Banque Nationale du Canada . Banque Royale du Canada . Bell Canada . Bombardier . Bourse de Montréal . Développement des ressources humaines Canada [DRHC] . Fédération des caisses Desjardins du Québec . Gaz Métropolitain . Hydro-Québec . Industrie Canada . Pratt & Whitney Canada Inc. . Raymond Chabot Grant Thornton . Ville de Montréal . École Polytechnique de Montréal . HEC Montréal . Université Concordia . Université de Montréal . Université du Québec à Montréal . Université Laval . Université McGill ASSOCIÉ AU : . Institut de Finance Mathématique de Montréal (IFM2) . Laboratoires universitaires Bell Canada . Réseau de calcul et de modélisation mathématique [RCM2] . Réseau de centres d’excellence MITACS (Les mathématiques des technologies de l’information et des systèmes complexes). Les cahiers de la série scientifique (CS) visent à rendre accessibles des résultats de recherche effectuée au CIRANO afin de susciter échanges et commentaires. Ces cahiers sont écrits dans le style des publications scientifiques. Les idées et les opinions émises sont sous l’unique responsabilité des auteurs et ne représentent pas nécessairement les positions du CIRANO ou de ses partenaires. This paper presents research carried out at CIRANO and aims at encouraging discussion and comment. The observations and viewpoints expressed are the sole responsibility of the authors. They do not necessarily represent positions of CIRANO or its partners.. ISSN 1198-8177.
(3) Size Matters: The Impact of Capital Market Liberalization on Individual Firms* Peter Christoffersen†, Hyunchul Chung, Vihang Errunza. Résumé / Abstract. Nous étudions les questions suivantes: Quels sont les effets de réévaluation et l’impact sur les performances, la volatilité et les corrélations de la libéralisation du marché boursier dans les marchés naissants? Ces questions ont été étudiées intensivement au niveau des marchés mais pas au niveau des entreprises. Nos résultats montrent que l’impact de la libéralisation des marchés est significativement différent selon la taille des entreprises. Les grandes entreprises présentent en général des effets de réévaluation importants, des changements insignifiants au niveau des performances, des chutes importantes de volatilité et des changements insignifiants des corrélations en raison de la libéralisation. Les petites entreprises présentent quant à elles de faibles effets de réévaluation, une amélioration des performances, un déclin plus faible de la volatilité et une diminution des corrélations à la suite de la libéralisation. Ces résultats demeurent valables lorsqu’on contrôle pour les mouvements des rendements boursiers mondiaux, les réformes économiques concourantes et les principes fondamentaux de macroéconomie. Ils sont également robustes à la longueur de la fenêtre de libéralisation. Nos résultats ont des implications importantes pour les investisseurs internationaux qui cherchent à gérer leur exposition globale ainsi que pour les responsables qui envisagent la libéralisation de marchés financiers. Mots clés : Marchés naissants, volatilité, corrélation, performance, effets de réévaluation.. * The first and third authors are Assistant Professor and Bank of Montreal Chair in Finance and Banking respectively at the Faculty of Management, McGill University and CIRANO. The second author is with KT Corp. We would like to thank George Allayannis, Martin Boyer, Steve Fortin and Rene Garcia as well as participants in the 2001 Canadian Economic Association Meetings, the McGill Internal Finance Seminar and CIRANO for helpful discussion. Christoffersen thanks FCAR, IFM2 and SSHRC and Errunza thanks SSHRC for financial support. We are also grateful to the capital markets department of the International Finance Corporation for providing the data on emerging markets. † Corresponding author: Peter Christoffersen, Faculty of Management, McGill University, 1001 Sherbrooke Street West, Montreal, Quebec, Canada, H3A 1G5, tel: (514) 398-2869, Fax: (514) 398-3876. E-mail: peter.christoffersen@mcgill.ca.
(4) We attempt to answer the following questions: What are the revaluation effects and the impact on performance, volatility, and return correlation from stock market liberalization in emerging markets? These questions have been studied extensively at the market-level but not at the firm level. Our results show significantly different impact of stock market liberalization across firms. Large firms tend to exhibit large revaluation effects, insignificant change in performance, large declines in volatility, and insignificant change in correlation from liberalization. Small firms show small revaluation effects, improved performance, smaller decline in volatility and decreases in correlation after liberalization. These results hold after controlling for movements in world stock returns, concurrent economic reforms and macroeconomic fundamentals. They are also robust to the length of the liberalization window. Our results have important implications for international investors seeking to manage their global exposure as well as for policy makers considering capital market liberalization.. Keywords: Emerging Markets, Volatility, Correlation, Performance, Revaluation Effects..
(5) I.. Introduction The past two to three decades have witnessed a dramatic decrease in barriers to international. investment, especially in emerging markets (EMs). In general, these barriers can be classified into explicit and implicit barriers. While the explicit barriers are directly observable and quantifiable, for example foreign ownership restriction and discriminatory taxation, the implicit barriers are not directly observable and may arise from, for example lack of information, political risk, or fear of expropriation. In recent years, many studies have investigated the impact of market liberalizations – see for example, Bekaert and Harvey (2000), Errunza and Miller (2000), Henry (2000a), and Kim and Singal (2000). Since these studies [with the exception of Errunza and Miller (2000)] use marketlevel indices, their results represent an average effect of liberalization on a country’s securities. For a deeper assessment of the economic significance, it is important to use firm level data and study the impact of liberalization on valuation, performance, volatility and correlations.1 Further, the International Finance Corporation (IFC) indices2 used in market level studies may not represent the real portfolio holdings of foreign investors who prefer investment in large and well-known firms.3 Thus, the results based on market indices could under(over)estimate the impact depending on foreign demand for a security. Although explicit foreign investment restrictions may be removed by the government, implicit barriers, such as lack of information, may still remain. Different firms from a liberalized market may also provide different diversification opportunities to the foreign investor. Thus, the use of market-level indices to investigate the impact of market liberalization may not take into account firm level asymmetries embedded in investment decisions. There are also other potential problems with using market-level indices. First, since each country has only one observation (market index) the power of any test will be low. Second, firms are included and excluded based on the firm selection criteria in index construction. Hence, at times, firms are implicitly included in the analysis even though they did not exist before or during the market liberalization period.. 1. At the macroeconomic level, see Henry (2000b), Errunza (2001) and Bekaert and Harvey (2002) for the impact on growth following stock market liberalizations. 2 Because of their focus on large, liquid securities, IFC indices are better than local indices. Indeed, the IFC investible index would be ideal, unfortunately, it begins after December 1988 and later in many cases. Hence, we use the IFCG constituent firms. 3 For example, Kang and Stulz (1997) and Choe, Kho and Stulz (1999) show explicitly that foreign investors are more likely to invest in large firm securities.. 1.
(6) Hence, the purpose of this study is to investigate the impact of stock market liberalization at a more disaggregated firm level. Using market-level results as benchmarks, we analyze firm-level data to investigate the impact of stock market liberalization with respect to revaluation effect, changes in performance, stock market volatility and correlation with world market return. Based on the standard International Asset Pricing Models (IAPMs), we would expect an increase in the stock price (revaluation effect) leading up to market liberalization, and a subsequent decrease in the cost of capital.4 Unfortunately, there is no established theory regarding the impact on future performance, volatility or correlations following liberalization. It has been claimed that foreign portfolio investment renders local stock markets unstable. It is also believed that the gradual removal of barriers to international investment could lead to a progressive increase in the international correlation of financial markets due to the globalization of the discount rate or increased cash flow correlation. However, the empirical evidence based on index level data is mixed.5 Of course, portfolio managers would like to know if an important event such as stock market liberalization has an impact on performance, volatility and correlation, which in turn affects portfolio re-balancing decisions and risk management practices. Our main contributions are as follows: First, by investigating firm level data, we further our understanding of the economic benefits that accrue from liberalizations. Although the sample sizes at the individual country level are not sufficiently large to allow for sector level conclusions, the results can serve as a useful starting point for future investigations. Second, it allows us to investigate the cross-sectional differences among individual firms driven by foreign investors’ demand using firm size as a proxy. The rationale for using firm size as a proxy is based on the importance of information availability. For example, in IAPMs of Black (1974), Stulz (1981), and Errunza and Losq (1985), the informational barrier can render cross-border investments costly, or prohibit such investments in the limit. The “home bias” literature emphasizes the importance of information asymmetry to explain the predominance of home assets in international portfolios.6 In her survey of market experts and participants, Chuhan (1994) also reports limited information as one of the major impediments to investing in emerging markets. On the other hand, firm size has been 4. See, for example, Stulz (1999) and Errunza and Miller (2000). Similarly, Bailey and Jagitiani (1994) and Bailey, Chung and Kang (1999) explain the revaluation effect on the basis of increased foreign portfolio investor demand for domestic securities. 5 See for example, Tesar and Werner (1995), Bekaert and Harvey (1997, 2000), De Santis and Imrohoroglu (1997) and Kim and Singal (2000) for evidence on volatility and Solnik et al. (1996), Longin and Solnik (1995), Bekaert and Harvey (2000) and Carrieri, Errunza and Hogan (2002) for evidence on correlations. 6 See for example, French and Poterba (1991), Cooper and Kaplanis (1994) and Lewis (1999).. 2.
(7) used in many studies as a proxy for information richness and found to be a good indicator of information availability.7 Hence it is reasonable to assume that foreign investors, who generally have limited information, prefer information-rich, large firms to information-poor, small firms in international investment decisions, especially in emerging markets.8 Third, we significantly enhance the power of the hypothesis tests by having more observations compared to studies that use market-level observations. Finally, since we deal with individual firms, we do not face the problem of including firms to test market liberalization impact even though they were not in IFC dataset before or during market liberalization. This is also important because our sample firms do not change throughout the study period whereas the IFC index composition changes over time. This will contribute to some difference in results based on indices versus individual firms. Our benchmark results using market-level data show statistically and economically significant revaluation effects and improved performance in the post liberalization period. However, neither the emerging stock market volatility nor its correlation with world market return change after stock market liberalization. More importantly, large firms tend to exhibit large revaluation effects, insignificant change in performance, large declines in volatility, and insignificant change in correlation from liberalization. Small firms show small revaluation effects, improved performance, smaller decline in volatility and decreases in correlation after liberalization. These results hold after controlling for movements in world stock returns, concurrent economic reforms and macroeconomic fundamentals. They are also robust to the length of the liberalization window. The remainder of the paper is organized as follows. We discuss stock market liberalization dates, IFCG indices and firm-level data in section II. In section III, we discuss methodological issues. Section IV presents our empirical results. Conclusions follow.. 7. See Bailey and Jagtiani (1994), Kang and Stulz (1997) and Bailey, Chung and Kang (1999) among others. It is plausible that the cost of information on small-size firms is too high for foreign investors in relation to the potential diversification benefit. Hence, foreign investors may not invest in small-size firms. These small-size firms become nontraded in the vein of Stulz (1981) who shows that there could exist non-traded assets that do not provide sufficient benefits to overcome the cost of existing barriers. Along the same line, Merton (1987) also argues that investors invest only in securities they know about. He emphasizes the importance of information asymmetry in investment by noting that (P.488) “concern about asymmetric information among investors could be important reason why some institutional and individual investors do not invest at all in certain securities, such as shares in relatively small firms with few stockholders.” Note that this phenomenon will be much severe in international investment context. 8. 3.
(8) II.. Stock Market Liberalization and Data. A. Market Liberalization Dates The official government announcement date is often used as a proxy for the stock market liberalization date. However, mere governmental announcement of market opening may not induce foreign investment. On the other hand, stock market restrictions may not have been binding and other avenues for foreign investment, most notably the country funds, may have preceded official opening. Hence, it is very difficult to pinpoint the exact market liberalization date. Therefore, several additional proxies for dating stock market liberalization are used in empirical studies.9 Henry (2000a) constructs a set of liberalization dates based mainly on official policy decree and country fund introductions. We use Henry’s (2000a) market liberalization dates since our data set of 12 emerging markets matches his, and the dates in column (2) of his Table I represent the earliest verifiable liberalization implementation dates.10 Further, his liberalization dates put relatively more weight on the introduction of country funds (for eight of the twelve countries), which is consistent with the empirical evidence of Errunza, Hogan and Hung (1999) that suggest the importance of these indirect vehicles to obtain exposure to otherwise closed markets. Since, these are implementation and not announcement dates, we estimate the revaluation effect over a generous window preceding liberalizations as in the past studies. B. Data We use both market-level and firm-level data from the Standard & Poor’s (S&P) IFC Emerging Market Data Base (EMDB). The Morgan Stanley Capital International (MSCI) world market index from Datastream is used as a proxy for world market return and S & P 500 return series from CRSP represents U.S. returns. All returns are logarithmic and in US$.11 IFC uses size, liquidity and industry as criteria in selecting stocks to include in the index, which results in the inclusion of the largest and the most actively traded stocks on the major exchange of each market. These selected firms are representative of the industrial classification of. 9. For example, Bekaert and Harvey (2000) use four liberalization dates based on the official announcement, country fund and ADR introduction and capital flows. 10 Table II of Henry (2000a) compares his liberalization dates with those of Bekaert and Harvey (2000), Kim and Singal (2000) and Buckberg (1995). In only three out of twelve cases, Henry’s dates were preceded by those proposed by the other authors. Unfortunately, Henry could not verify their accuracy. 11 We also carried out the analysis on real and excess returns and found no qualitative differences.. 4.
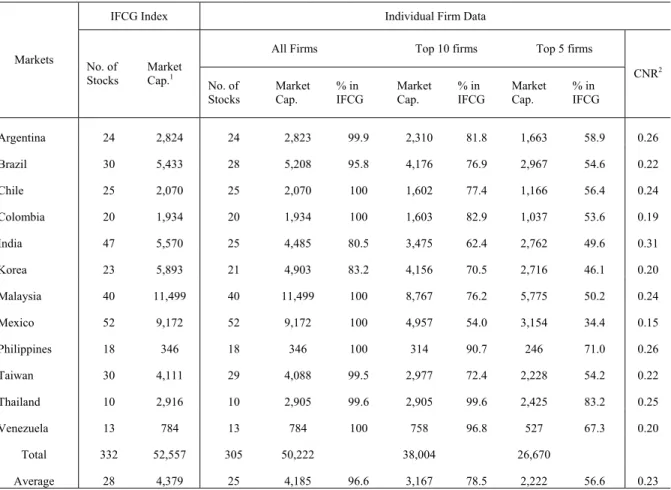
(9) the market with a target coverage of 60% of total market capitalization at the end of each year, and 60% of total value of shares traded during each year.12 We use the value-weighted global indices (IFCG) for 12 markets. Monthly return data are available from January 1976 to October 1999 for seven countries (Argentina, Brazil, Chile, India, Korea, Mexico and Thailand) and from January 1985 to October 1999 for five countries (Colombia, Malaysia, Philippines, Taiwan and Venezuela). These 12 emerging markets are also used in Henry (2000a).13 Our individual firm data are also from the EMDB for the same 12 emerging markets. The number of companies in each country index (IFCG) as of their respective liberalization date is presented in Table 1. Thailand has the smallest number of firms (10) and Mexico has the largest number of firms (52). The IFCG country indices consist of 28 firms on average across the 12 emerging markets. There are a total of 332 firms in the 12 emerging markets as of the market liberalization date. Market capitalization is reported as the average value for the 8 months leading up to and including the stock market liberalization date. We define this period as the DurLib period. The number of firms under the All Firms in Individual Firm Data in Table 1 should be identical to the number of firms under IFCG Index. However, there is a discrepancy (332 vs. 305) because we exclude firms, which do not exist for the entire 8-month DurLib period. Most of the countries have the same number of firms, but in particular India shows a discrepancy of 22 firms which were in the index but which did not exist throughout the liberalization period. The last five columns in Table 1 show the extent to which large firms dominate the country indices. The values of market capitalization are based on the average value of the 8-month DurLib period. The first four columns present how much the IFCG index is dominated by either the top (largest) 10 or the top (largest) 5 firms in each country. The dominance ratio for the largest 10 firms ranges from 54% for Mexico to 99.6% for Thailand and the average dominance ratio across all markets is 78.5%. With the top 5 firms in each market the dominance ratio decreases somewhat. For example, the dominance ratio ranges from 34.4% for Mexico to 83.2% for Thailand and the average dominance ratio decreases to 56.6%. These dominance measures are in absolute terms in the sense that they do not consider the total number of firms in the index (market).. 12. See International Finance Corporation (1999) for more detailed information about IFC indices. We do not report descriptive statistics for the market indices here, as they are similar to those reported in the past literature.. 13. 5.
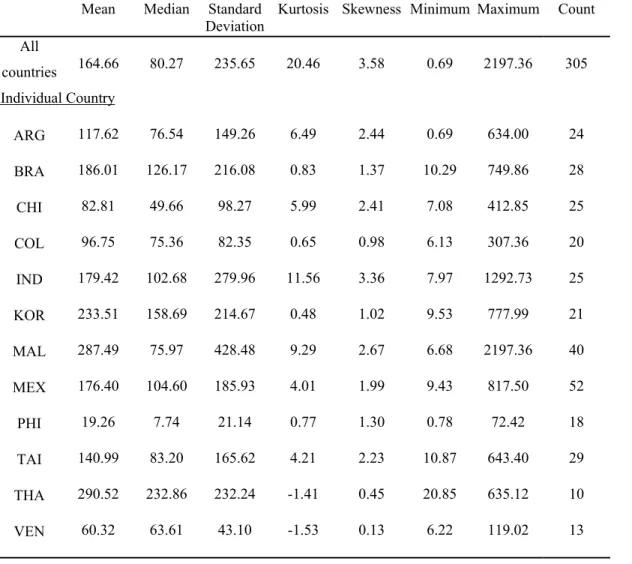
(10) In the last column, the Concentration Ratio (CNR) presents a modified Herfindahl index of concentration, previously applied by Roll (1992) and Bekaert and Harvey (1997, 2000) that complements the absolute dominance measures by taking the number of firms in the market (index) into account. If one stock dominates, then CNR approaches one. If every stock has equal market capitalization, then CNR equals zero. We take the CNR of S&P500 as our benchmark, which was 0.10 as of 7 Dec. 2000. Compared to this benchmark value, the relative concentration degree in emerging markets is higher, ranging from 0.15 to 0.31. The average CNR across all the emerging markets is 0.23, which is twice the benchmark value of the S&P 500. Since we use firm size, represented by its market capitalization, as a proxy for foreign investor demand, it plays an important role in our study. Table 2 presents the descriptive statistics of size measures for individual firms in 12 emerging markets. All the figures are based on the average value of the eight-month DurLib period. In the case of all countries, firm sizes vary widely ranging from 0.69 to 2,197.36 million US dollars. This wide dispersion of firm size is evident within each country as well. Having taken an initial look at the data, we now turn to a discussion of the empirical methodology to be employed below.. III.. Methodology. A. Econometric Analysis The general econometric framework is as follows: DVsit = α si + γLibit + δ f ( size si ) Libit + λCVit + ε sit where DVsit is our variable of interest for firm s in country i at time t, αsi is a firm-specific fixed effect, f(sizesi) is a function of firm size, CVit is a controlling variable, and εsit is the error term. We are typically interested in the parameters γ and δ being significantly different from zero during a certain period either around or after the liberalization date, which is captured by the dummy variable Libit. Panel regression with weighted least squares (WLS) estimation is used, and statistical inference is based on heteroskedasticity-consistent (White) standard errors. B. The Revaluation Effect In order to compare firm-specific estimates of the revaluation effect to the existing literature based on country indices, we first estimate the standard equation using the IFCG indices, which serves as the benchmark:. 6.
(11) Rit = α i + γDurLibit + ε it. (1). where Rit is the monthly US dollar log-return on the IFCG index in country i at time t. The liberalization dummy here takes the value one in the eight-month DurLib period, and zeros in the earlier months.14 The normal level of return is calculated on the basis of estimation window ranging from the earliest data available to the 7th month before stock market liberalization. The coefficient γ measures the monthly abnormal return during liberalization. We do not include sample points after the liberalization month since the expected post-liberalization decrease in the cost-of-capital may tend to overestimate the revaluation effect.15 We compare this country-panel with a firm-specific unconditional estimate, which should yield an estimate of the revaluation effect similar to the one obtained using the IFCG indices. The firm-specific but unconditional regression is R sit = α si + γDurLibit + ε sit .. (2). Note that the revaluation effects from the IFCG and the unconditional firm-specific regressions is not expected to be identical, since not all firms in the index are represented in our sample, as the index is value-weighted, and since we use firm-specific fixed effects. More interestingly, we report additional conditional estimates below. The key contribution of this study is to assess the extent to which the revaluation effect is a function of firm size. Due to the extreme cross-sectional variation in firm size, we use a rank-based measure of size. Rank-based size is calculated in one of two ways. First, we measure the rank of a firm in relation to all firms in the World (305 firms in the 12 emerging markets) on a scale from 0 to 1, with 1 corresponding to the largest firm in the sample based on market capitalization and 1/305 corresponding to the smallest firm in the World. This variable is denoted, WRank(sizesi). We also calculate a country-by-county, or domestic rank size measure in a similar fashion, and denote it. 14. Since market liberalization is not a one-shot event, but rather a gradual process, it’s not an easy task to pin down the exact liberalization date. The announcement is typically made before the actual market opening and the stock markets are likely to react to the announcement and its anticipation. In addition to the gap between announcement and implementation date, as Errunza and Miller (2000) argue, in practice there is likely to be information dissemination (leakage) prior to any official announcement. This 8-month window, also used by Henry (2000a), will potentially mitigate problems stemming from errors in the dating of the liberalization. For the same reason, Errunza and Miller (2000) use a 6-month period preceding the announcement and Bekaert and Harvey (2000) use 6 months prior to the liberalization month as an event window. 15 In our result below we do indeed get a slightly lower revaluation effect than does Henry (2000a), who includes postliberalization months in his sample. For example, while he reports 37.6% point increase in stock price before controlling for any confounding effects, we obtain 34.7% point increase. Note that Henry (2000a) uses real returns whereas our returns are nominal US$ returns.. 7.
(12) DRank(sizesi). Size itself is measured as the average market capitalization of each firm during the 8month DurLib period. We can then estimate the conditional revaluation effect based on world rank size measure using the regression, R sit = α si + γDurLibit + δ WRank ( size si ) DurLibit + ε sit. (3). and the conditional revaluation effect based on domestic rank size measure using the regression, R sit = α si + γDurLibit + δ DRank ( size si ) DurLibit + ε sit .. (4). Notice that the revaluation effects (RE) in these cases are not simply γ, but rather RE si = γ + δ WRank ( size si ) in the case of world rank size measure, and RE si = γ + δ DRank ( size si ) in the case of domestic rank size measure, both of which will be (nonlinear) functions of the firm size. The standard International Asset Pricing Models suggest a revaluation effect from market liberalization assuming that everything else is held constant. Thus, the event must be isolated from all other effects that might bear on the estimation. Hence, we re-estimate all the revaluation regressions after controlling for movements in world market returns and concurrent economic reforms. Further, in view of Henry’s finding that policymakers time market openings, we also control for macroeconomic fundamentals.16 C. Post Liberalization Performance The effect of market liberalization on performance is analyzed in a framework similar to the one used for revaluation effect. One key difference is that the liberalization dummy now takes the value one in each of the 36 months following the liberalization month and zeros elsewhere. The sample ends 36 months after the liberalization month. We define the 36 months preceding and following DurLib period as PreLib and PostLib period respectively. The 8-month DurLib period is excluded from the analysis. The 36-month PreLib period is used as a control period to assess the change in performance from liberalizing capital markets.. 16. We use Henry’s (2000a) variables for the concurrent economic reforms and macroeconomic fundamentals.. 8.
(13) We estimate the following regressions to investigate whether the performance changes after liberalization, and whether there are any cross-sectional differences, depending on the size of the firm. Rit = α i + γPostLibit + ε it. (5). R sit = α si + γPostLibit + ε sit. (6). R sit = α si + γPostLibit + δ WRank ( size si ) PostLibit + ε sit. (7). R sit = α si + γPostLibit + δ DRank ( size si ) PostLibit + ε sit. (8). We use realized returns to measure performance. If the liberalization has the impact on cost of capital and future growth opportunities as documented by numerous studies, then we would expect the markets to reflect it.17 As in the case of the revaluation effect, we re-estimate all the regressions after controlling for movements in world market returns, concurrent economic reforms and macroeconomic fundamentals, and check the robustness of our results to the choice of window length. D. Volatility and Correlation We again estimate the four regression models, now with volatility or correlation as the dependent variable. Vit (CRit ) = αi + γPostLibit + εit. (9). Vsit (CRsit ) = αsi + γPostLibit + εsit. (10). Vsit (CRsit ) = αsi + γPostLibit + δ WRank ( sizesi ) PostLibit + εsit. (11). Vsit (CRsit ) = αsi + γPostLibit + δ DRank ( sizesi ) PostLibit + εsit. (12). where V (CR) denotes volatility (correlation). The windows for the performance test are applied here again, but now with 2-year window lengths.18 Volatility itself is the log of realized standard deviation, using the sum of squares of monthly returns to construct an annual variance. We thus follow the approach of French, Schwert and 17. See for example, Bekaert and Harvey (2000), Bekaert, Harvey and Lundblad (2002), Errunza and Miller (2000), Errunza (2001), Henry (2000a and 2000b), and Kim and Singal (2000). 18 The choice of window length attempts to balance the desire of getting a low-variance estimate of change (suggesting a long window), while avoiding confounding effects biasing the estimate of change (suggesting a short window). In the above analysis on performance, we apply 3-year windows surrounding the liberalization period as this is standard in the literature. When estimating changes in volatility and correlation, arguments can be made for a shorter window, as the volatility of returns, compared to the mean of return, is more easily estimated using a short span of data. We therefore use 2-year windows. Evidence on the robustness of the results to the choice of window length is presented below.. 9.
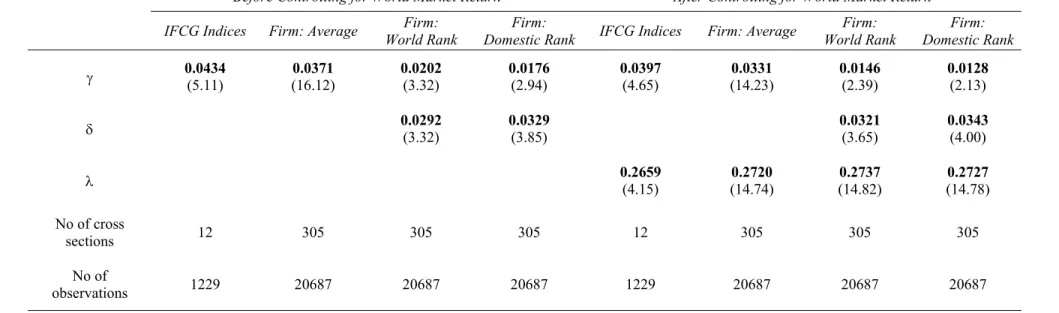
(14) Stambaugh (1987) and Schwert (1989), who use sum of daily squared observations to construct monthly, realized stock volatilities. This is a model-free estimation in the sense that we do not impose any parametric model to estimate variances. The annual realized correlation with World market return is similarly calculated from cross-products of monthly returns in the usual fashion. In order to control for effects arising from changes in world market volatility, we re-estimate volatility and correlation regressions including realized world market volatility on right hand side. As our volatility and correlation tests are done with annual data, we do not have enough cross-country variation to estimate the changes in volatility and correlation controlling for changes in the macroeconomic conditions. However, we have performed a series of robustness tests to assess the sensitivity of our results to varying the test window lengths.. IV.. Empirical Results We now report the empirical results from estimations of revaluation effect, performance,. stock market volatility and correlation with world market return. The results are reported in Tables 3-10. For completeness, each table contains results with and without controlling variables. The two sets of results are very similar, and for the sake of brevity we will only discuss the results including the controlling variables. A. Revaluation Effects Table 3 provides the empirical results from testing the revaluation effect. After controlling for world market return, on average, the emerging stock market is revalued by 31.8% points (3.97% per month for eight months) over the DurLib period. On average, the emerging market firm is revalued by 26.5% points (3.31% per month for eight months). Since the benchmark estimate, using value-weighted IFCG indices, has a higher revaluation effect than the firm-specific unconditional estimate, we expect larger firms to display a higher revaluation effect than smaller ones. As the IFCG indices are value-weighted, more weight is given to larger firms whereas no explicit weight is given in the estimation using firm level data. The firm-specific conditional estimates of γ and δ are significant in both regressions. The revaluation effect for the smallest firm using the world rank size measure is approximately 11.8% points and for the largest firm it is 37.4% points. Using instead the domestic rank size measure, the revaluation effect ranges from 10.9% to 37.7% points. Regardless of the size measure used, the results show that large firms experience higher revaluation effects than small firms.. 10.
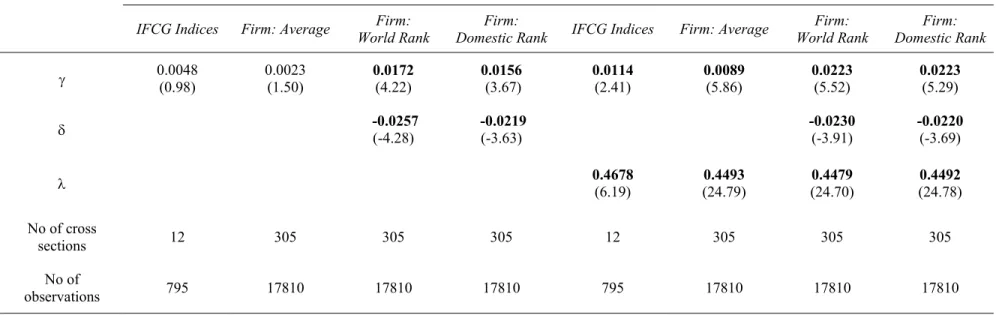
(15) Stock market liberalization usually coincides with concurrent changes in economic policy. We use four variables, namely macroeconomic stabilization, trade liberalization, privatization and the easing of exchange controls from Henry (2000a) to control for the effect of concurrent economic reforms (CER).19 After controlling for these variables, the results reported in Table 4 are the same as before. The results for market indices and the firm-specific unconditional model show significant revaluation effects and there is a cross-sectional difference in the revaluation effect depending on the firm size. Large firms show a higher revaluation effect than small firms do. The coefficient on the privatization variable is positive and significant as in Henry (2000a). However, the stabilization variable is unexpectedly negative and highly significant. The exchange rate is negative as in Henry (2000a) but in our case it is also significant. Although we use the same concurrent economic reforms, these differences may result from discrepancies in event classifications, use of firm level data in this study and the differences in sample periods. Finally, we control for four macroeconomic fundamental (MF) variables to account for the possibility of a revaluation from macroeconomic shocks. As in Henry (2000a), we use the continuously compounded growth rates of domestic industrial production, domestic inflation, 3month US T-bill rate and real foreign exchange rate. The basic results do not change and are not reported to conserve space. However, it is important to note that the decline in revaluation effect at the market and average firm level from the no control benchmark estimates to the estimates with world market return, CER and MF controls are of the same order as those reported by Henry (2000a). In summary, our analysis shows that large firms appear to be driving the revaluation effect. This is sensible as domestic investors could be anticipating foreign investors’ demand for equity in large firms, thus driving up the valuations even before the market liberalization takes place. Alternatively, if de facto liberalization has already taken place before the liberalization dates used here then foreign investors themselves could be driving up the valuations. B. Post Liberalization Performance Table 5 provides empirical results from testing the effect of market liberalization on performance. After controlling for changes in world market return, the benchmark coefficient γ of 0.0114 is statistically significant which indicates that the performance increases by 13.7% points per 19. See Henry (2000a) for an excellent discussion of the need to control for CER and macroeconomic fundamentals.. 11.
(16) annum on average in the emerging market after stock market liberalization. The firm-specific unconditional estimate is also significant and suggests that the performance increases by 10.7% points per annum for the average firm. The results for the firm-specific conditional estimation suggest a change in the performance for the world’s smallest firm of approximately 26.7% points per year and for the world’s largest firm –0.8% points per year. On the other hand, the change in the performance for the smallest firm using the domestic rank size measure is approximately 26.1% points and that for the largest firm it is 0.4% points per year. Thus, while small firms show positive changes, the change in the performance for large size firms are close to zero. As in the case of the revaluation effect, we re-estimated our results after controlling for concurrent economic reforms. The results are detailed in Table 6. Again, the firm size is negatively related to performance changes. Small firms show improved performance, whereas large firms show insignificant changes in performance. As in the case of revaluation effect, the coefficient for the privatization variable is positive and significant whereas the exchange rate variable is significantly negative. After controlling for macroeconomic fundamentals, the basic results do not change and are not reported to conserve space. We also checked the robustness of our results based on PreLib and PostLib windows with symmetric 2 to 5-year lengths. We find that our results are robust. Small firms show improved performance whereas large firms show only small changes in performance. Overall, our results are consistent with the expectations of improved future growth opportunities. Further, the size effect may suggest a relaxation of the financial constraint for smaller firms post liberalization - the large EM firms typically have preferred access to available finance in a developing economy. C. Changes in Volatility Table 7 presents the empirical results from testing changes in stock market volatility. As the market volatility changes could easily be affected by changes in world market volatility, the second set of columns in Table 5 report the results after controlling for this. The benchmark estimate suggests that the annualized emerging stock market volatility increases by 26.2%, whereas the firmspecific unconditional estimate implies an average increase in firm-level volatility by only 4.8%.20. 20. Since we use the log of realized volatility, our results can loosely be interpreted as percentage changes, unlike the changes in percentage points in the previous sections on revaluation effect and performance. The difference in logarithm is of course a poor approximation to the percentage change when the log difference is large.. 12.
(17) The conditional estimates suggest that the change in the annualized volatility for the world’s smallest firm is approximately 9.5%, and that for the world’s largest firm it is 0.7%. Using domestic ranks, the change in volatility for the smallest firm is approximately 6.6%, and for the largest firm it is 3.4%.21 While results of previous studies based on market indices are mixed, we find that volatility increases significantly after market liberalization—in particular for small firms.22 We also find that the increases in market-level volatility are quite dramatic when compared to the firm-level increases. This finding deserves further scrutiny. Since we use annualized data, we are not able to control for concurrent economic reforms. Table 8 reports results with macroeconomic fundamentals as control variables. Now, the country index level results show negative but insignificant changes in volatility consistent with the findings of Bekaert and Harvey (2000) who report that, annualized volatility slightly decreases (by one basis point). Our results at the index level are also consistent with their finding that both the financial and macroeconomic development indicators suggest a considerable decrease in volatility offset by an increase in volatility attributed to financial liberalization. At the firm level, we find the effect to be very significant. Whereas the large firms exhibit large declines in volatility, the decline for small firms is less pronounced. D. Changes in Correlation with the World Market Return Table 9 presents the empirical results for changes in correlation of stock returns with world market returns. Recent studies in international finance have shown that correlations of international equity returns move together with world market volatility. This phenomenon becomes apparent during an extremely volatile period when correlations increase markedly. (see Solnik et. al. (1996), De Santis and Gerard (1997) and Longin and Solnik (1995, 2001) among others). Since our sample period includes very volatile periods such as the 1987 crash, our results could be affected by changes in world market volatility. Hence, the second set of columns in Table 9 shows the results after controlling for changes in the world market volatility measured by the annualized realized volatility of MSCI world returns. The result for the benchmark model suggests no change in correlation after. 21. In terms of robustness of our results based on PreLib and PostLib windows with symmetric 2 to 5-year lengths, large firms show much lower increases in volatility than small firms after stock market liberalization, but the differences are not statistically significant. 22. Recall that previous studies typically estimate volatility using mean-reverting GARCH-type models. Instead, we take a model-free approach.. 13.
(18) stock market liberalization. The firm-specific unconditional estimate is statistically significant, implying that the correlation with world market return decreases slightly. The firm-specific conditional estimate using the world rank size-measures suggests that firm size matters for the correlation changes from stock market liberalization. The change in correlation for the world’s smallest firm is –0.1053 and that for the world’s largest firm is 0.0589.23 Using instead domestic ranks, γ and δ become insignificant. These results are consistent with those of Bekaert and Harvey (2000) who report a small but economically insignificant increase in index level correlations between emerging markets and the world market return. Our findings are again consistent with foreign investors demanding equity in large and well-known firms. Table 10 reports results with macroeconomic fundamentals as control variables. Again, the market level results show insignificant changes in correlation. With individual firm data, the correlations on average decrease with large firms showing insignificant changes and small firms exhibiting significant declines based on both the world and the domestic size rank.. V.. Conclusion and Discussions for Future Work We attempt to answer the following key questions: What are the revaluation effects and the. impact on performance, volatility, and correlation from stock market liberalization in emerging markets? These questions have been studied extensively at the market-level, using for example, IFC country indices, but not at the firm level. Unfortunately, the International Finance Corporation (IFCG) indices do not represent the real portfolio holdings of foreign investors who prefer investment in large and well-known firms. Hence, the opening of capital markets should have a differential impact across securities depending on foreign investors’ demand. We therefore use individual firm data as well as market-level indices in our analysis. Our test results using country indices show statistically and economically significant revaluation effects, and improved performance. However, neither the emerging stock market volatility nor its correlation with world market return change after stock market liberalization. More importantly, we report significantly different impact of stock market liberalization, based on firm size. Large firms tend to exhibit large revaluation effects, insignificant change in performance, large 23. We checked the robustness of our results based on PreLib and PostLib windows with symmetric 2 to 5-year lengths. Large firms consistently show significant increases whereas small size firms show decreases in the correlation with the world market.. 14.
(19) declines in volatility, and insignificant change in correlation from liberalization. Small firms show small revaluation effects, improved performance, smaller decline in volatility and decreases in correlation after liberalization. Thus, we find that there are significant cross-sectional differences in the impact of stock market liberalization among firms depending on their size. These results hold after controlling for movements in world stock returns, concurrent economic reforms and macroeconomic fundamentals. They are also robust to the length of the liberalization window. In this study, we adopt only one firm-specific characteristic, namely firm size, using it as a proxy for the foreign investors’ demand. Illiquidity is also considered to be a critical impediment to investing in emerging markets. Hence, liquidity measures can be used as conditioning factors to investigate the impact of stock market liberalization. We leave this important issue for further study pending the availability of reliable data.. 15.
(20) References Bailey, Warren and Julapa Jagtiani, 1994, Foreign ownership restrictions and stock prices in the Thai capital market, Journal of Financial Economics 36, 57-87. Bailey, Warren, Peter Chung and Jun-Ksoo Kang, 1999, Foreign ownership restrictions and equity price premiums: what drives the demand for cross-border investments?, Journal of Financial and Quantitative Analysis 34, 489-511. Bekaert, Geert and Campbell Harvey, 1997, Emerging equity market volatility, Journal of Financial Economics 43, 29-77. Bekaert, Geert and Campbell Harvey, 2000, Foreign speculators and emerging equity markets, Journal of Finance 55, 565-613. Bekaert, Geert, Campbell Harvey and Christian Lundblad, 2002, Does Financial liberalization spur growth?, Journal of Development Economics, Forthcoming. Black, Fischer, 1974, International capital market equilibrium with investment barriers, Journal of Financial Economics 1, 337-352. Buckberg, Elaine, 1995, “ Emerging stock markets and international asset pricing, World Bank Economic Review 9, 51-74. Carrieri, Francesca, Vihang Errunza and Ked Hogan, 2002, Characterizing world market integration tdhrough time,” Working paper, McGill University. Choe, Hyuk, Bong-Chan Kho and Rene Stulz, 1999, Do foreign investors destabilize stock markets? The Korean experience in 1997, Journal of Financial Economics 54, 227-264. Chuhan, Punam, 1994, Are institutional investors an important source of portfolio investment in emerging markets?, Policy Research working paper 1243, World Bank. Cooper, Ian and Evi Kaplanis, 1994, Home bias in equity portfolios, inflation hedging and international capital market equilibrium, Review of Financial Studies 7, 45-60. De Santis, Giorgio and Bruno Gerard, 1997, International asset pricing and portfolio diversification with time-varying risk, Journal of Finance, 52, 1881-1912. De Santis, Giorgio and Selahattin Imrohoroglu, 1997, Stock returns and volatility in emerging financial markets, Journal of International Money and Finance 16, 561-579. Errunza, Vihang, and Etienne Losq, 1985, International asset pricing under mild segmentation: theory and test, Journal of Finance 40, 105-124. Errunza, Vihang, Ked Hogan and Mao-Wei Hung, 1999, Can the gains from international diversification be achieved without trading abroad, Journal of Finance 54, 2075-2107.. 16.
(21) Errunza, Vihang and Darius Miller, 2000, Market segmentation and the cost of capital in international equity markets, Journal of Financial and Quantitative Analysis 35, 577-600. Errunza, Vihang, 2001, “Foreign Portfolio Equity Investments, Financial Liberalization and Economic Development,” Special issue of Review of International Economics, International Financial Liberalization, Capital Flows and Exchange Rate Regimes: Essays in Honor of Robert A. Mundell 9,. French, Kenneth and James Poterba, 1991, International diversification and international equity markets, American Economic Review 81, 222-226. French, Kenneth, Willam Schwert and Robert Stambaugh, 1987, Expected stock returns and volatility, Journal of Financial Economics 19, 3-29. Henry, Peter Blair, 2000a, Stock market liberalization, economic reform, and emerging market equity prices, Journal of Finance 55, 529-564. Henry, Peter Blair, 2000b, Do Stock market liberalizations cause investment booms? Journal of Financial Economics 58, 301-334. International Finance Corporation, 1999, IFC Indices: methodology, definitions and practices, IFC World Bank, Washington, D.C. Kang, Jun-Koo and Rene M. Stulz, 1997, Why is there a home bias? An analysis of foreign portfolio equity ownership in Japan, Journal of Financial Economics 46, 2-28. Kim, E. Han and Vijay Singal, 2000, Stock market opening: Experience of emerging economies, Journal of Business 73, 25-66. Lewis, Karen K., 1999, Trying to explain home bias in equities and consumption, Journal of Economic Literature 37, 571-608. Longin, Francois and Bruno Solnik, 1995, Is the correlation in international equity returns constant: 1960-1990?, Journal of International Money and Finance 14, 3-26. Longin, Francois and Bruno Solnik, 2001, Extreme correlation of international equity markets, Journal of Finance, 56, 649-676. Merton, Robert C., 1987, A simple model of capital market equilibrium with incomplete information, Journal of Finance 42, 483-510. Roll, Richard, 1992, Industrial structure and the comparative behavior of international stock market indexes, Journal of Finance 47, 3-42. Schwert, William, 1989, Why does stock market volatility change over time?, Journal of Finance 44, 1115-1154.. 17.
(22) Solnik, Bruno, Cyril Boucrelle and Yann Le Fur, 1996, International market correlation and volatility, Financial Analysts Journal 52, 17-34. Stulz, Rene M., 1981, On the effects of barriers to international investment, Journal of Finance 36, 923-934. Stulz, Rene M., 1999, Globalization of equity markets and the cost of capital, Journal of Applied Corporate Finance, Fall, 8-25. Tesar, Linda and Ingrid Werner, 1995, U.S. portfolio investment and emerging stock markets, World Bank Economic Review 9, 109-130.. 18.
(23) Table 1: Individual Firm Data No. of Stocks is the number of companies as of the market liberalization date. Market Cap. is the average value of 8month DurLib period. For example, Top 10(5) firms are chosen on the basis of firm size calculated as average market capitalization for 8-month DurLib period and its Market Cap. is the sum of these largest 10 (5) firms’ average market capitalization for the same period. No. of Stocks under Individual Firm Data count the number of firms, which exist during the entire 8-month DurLib period. IFCG Index. Markets. Individual Firm Data All Firms. No. of Stocks. Market Cap.1. No. of Stocks. Market Cap.. Top 10 firms % in IFCG. Top 5 firms. Market Cap.. % in IFCG. Market Cap.. % in IFCG. CNR2. Argentina. 24. 2,824. 24. 2,823. 99.9. 2,310. 81.8. 1,663. 58.9. 0.26. Brazil. 30. 5,433. 28. 5,208. 95.8. 4,176. 76.9. 2,967. 54.6. 0.22. Chile. 25. 2,070. 25. 2,070. 100. 1,602. 77.4. 1,166. 56.4. 0.24. Colombia. 20. 1,934. 20. 1,934. 100. 1,603. 82.9. 1,037. 53.6. 0.19. India. 47. 5,570. 25. 4,485. 80.5. 3,475. 62.4. 2,762. 49.6. 0.31. Korea. 23. 5,893. 21. 4,903. 83.2. 4,156. 70.5. 2,716. 46.1. 0.20. Malaysia. 40. 11,499. 40. 11,499. 100. 8,767. 76.2. 5,775. 50.2. 0.24. Mexico. 52. 9,172. 52. 9,172. 100. 4,957. 54.0. 3,154. 34.4. 0.15. Philippines. 18. 346. 18. 346. 100. 314. 90.7. 246. 71.0. 0.26. Taiwan. 30. 4,111. 29. 4,088. 99.5. 2,977. 72.4. 2,228. 54.2. 0.22. Thailand. 10. 2,916. 10. 2,905. 99.6. 2,905. 99.6. 2,425. 83.2. 0.25. Venezuela. 13. 784. 13. 784. 100. 758. 96.8. 527. 67.3. 0.20. Total. 332. 52,557. 305. 50,222. Average. 28. 4,379. 25. 4,185. 56.6. 0.23. 1. 2.. 38,004 96.6. 3,167. 26,670 78.5. 2,222. Market capitalization in millions of US$ Concentration Ratio (CNR): The Absolute Concentration measure using the largest firms (Top 10 or Top 5) does not consider the total number of companies in the market. A modified Herfindahl index of concentration below is used to complement the absolute concentration measure. CNRi ,t =. N i ,t N i ,t. N i ,t. (w −1 ∑ j =1. ji,t. −. 1 2 ) N i ,t. where Ni,t is the number of companies in the country i at time t and wji,t is the share of market capitalization of stock j in the country i at time t. If one stock dominates, then CNR approaches one. If every stock has equal market capitalization, then CNR equals zero.. 19.
(24) Table 2: Descriptive Statistics on Firm size (Market Capitalization) Firm size is based on the average market capitalization value in the 8-month DurLib period. All figures are in millions of US$. The emerging markets data are from Emerging Market Database of the International Financial Corporation. EMs include Argentina(ARG), Brazil(BRA), Chile(CHI), Colombia(COL), India(IND), Korea(KOR), Malaysia(MAL), Mexico(MEX), the Philippines(PHI), Taiwan(TAI), Thaniland(THA) and Venezuela(VEN). Mean. Median. Standard Kurtosis Skewness Minimum Maximum Deviation. Count. 164.66. 80.27. 235.65. 20.46. 3.58. 0.69. 2197.36. 305. All countries. 200. Individual Country ARG. 117.62. 76.54. 149.26. 6.49. 2.44. 0.69. 634.00. 24. BRA. 186.01. 126.17. 216.08. 0.83. 1.37. 10.29. 749.86. 28. CHI. 82.81. 49.66. 98.27. 5.99. 2.41. 7.08. 412.85. 25. COL. 96.75. 75.36. 82.35. 0.65. 0.98. 6.13. 307.36. 20. IND. 179.42. 102.68. 279.96. 11.56. 3.36. 7.97. 1292.73. 25. KOR. 233.51. 158.69. 214.67. 0.48. 1.02. 9.53. 777.99. 21. MAL. 287.49. 75.97. 428.48. 9.29. 2.67. 6.68. 2197.36. 40. MEX. 176.40. 104.60. 185.93. 4.01. 1.99. 9.43. 817.50. 52. PHI. 19.26. 7.74. 21.14. 0.77. 1.30. 0.78. 72.42. 18. TAI. 140.99. 83.20. 165.62. 4.21. 2.23. 10.87. 643.40. 29. THA. 290.52. 232.86. 232.24. -1.41. 0.45. 20.85. 635.12. 10. VEN. 60.32. 63.61. 43.10. -1.53. 0.13. 6.22. 119.02. 13. 20. 150. 100. 50. 0. 0. 400 800 1200 1600 2000.
(25) Table 3: Revaluation Effects M1 (IFCG indices): Rit=αi+γDurLibit+[λWRett]+εit M2 (Individual Firms): Rsit=αsi+γDurLibit+[λWRett]+εsit M3 (World Rank in Size):Rsit=αsi+γDurLibit+δ(WRank(sizesi)*DurLibit)+[λWRett]+εsit M4 (Domestic Rank in Size):Rsit=αsi+γDurLibit+δ(DRank(sizesi)*DurLibit)+[λWRett]+εsit The panel regressions are performed using monthly logarithmic returns of both IFCG indices and individual firms in 12 emerging markets. Data covers Jan. 1976 to the market liberalization date month in each country. For example, Argentina has data from Jan. 1976 to Nov. 1989. R(s)it is the logarithmic return for country i (for asset s in country i) at time t. DurLibit is a dummy variable that takes on the value one in each of the 8 month DurLib period in country i. α(s)i measures the average monthly return for country i (for firm s in country i ) before market liberalization and γ measures the average monthly abnormal return after liberalization across all the countries (all the firms). WRett is the logarithmic World market return (MSCI World Index). WRank(sizesi) is a worldwide rank measure in firm size {= (firm’s rank in the World/total number of firms in 12 markets)}. DRank(sizesi) is a firm’s rank in the local market i {= (firm’s rank in the country /total number of firms in that market)}. The revaluation effect for M3 and M4 are measured by γ+δWRank(sizesi) in the case of World rank size measure, and γ+δDRank(sizesi) in the case of domestic rank size measure. t-statistics based on heteroskedasticity-consistent (White) standard errors are reported in parentheses. Before Controlling for World Market Return. γ. After Controlling for World Market Return. IFCG Indices. Firm: Average. Firm: World Rank. Firm: Domestic Rank. IFCG Indices. Firm: Average. Firm: World Rank. Firm: Domestic Rank. 0.0434 (5.11). 0.0371 (16.12). 0.0202 (3.32). 0.0176 (2.94). 0.0397 (4.65). 0.0331 (14.23). 0.0146 (2.39). 0.0128 (2.13). 0.0292 (3.32). 0.0329 (3.85). 0.0321 (3.65). 0.0343 (4.00). δ λ. 0.2659 (4.15). 0.2720 (14.74). 0.2737 (14.82). 0.2727 (14.78). No of cross sections. 12. 305. 305. 305. 12. 305. 305. 305. No of observations. 1229. 20687. 20687. 20687. 1229. 20687. 20687. 20687. 21.
(26) Table 4: Revaluation Effects after Controlling for Concurrent Economic Reforms M1 (IFCG indices): Rit=αi+γDurLibit+λWRett+φ’CER+εit M2 (Individual Firms): Rsit=αsi+γDurLibit+λWRett+φ’CER+εsit M3 (World Rank in Size):Rsit=αsi+γDurLibit+δ(WRank(sizesi)*DurLibit)+λWRett+φ’CER+εsit M4 (Domestic Rank in Size):Rsit=αsi+γDurLibit+δ(DRank(sizesi)*DurLibit)+λWRett+φ’CER+εsit The panel regressions are performed using monthly logarithmic returns of both IFCG indices and individual firms in 12 emerging markets. Data covers Jan. 1976 to the market liberalization date month in each country. For example, Argentina has data from Jan. 1976 to Nov. 1989. R(s)it is the logarithmic return for country i (for asset s in country i) at time t. DurLibit is a dummy variable that takes on the value one in each of the 8 month DurLib period in country i. α(s)i measures the average monthly return for country i (for firm s in country i ) before market liberalization and γ measures the average monthly abnormal return after liberalization across all the countries (all the firms). WRett is the logarithmic World market return (MSCI World Index). Four dummy variables are used to control for the effect of the concurrent economic reforms (CER): Stabilization, Trade, Privatization and the easing of exchange control. WRank(sizesi) is a worldwide rank measure in firm size {= (firm’s rank in the World/total number of firms in 12 markets)}. DRank(sizesi) is a firm’s rank in the local market i {= (firm’s rank in the country /total number of firms in that market)}. The revaluation effect for M3 and M4 are measured by γ+δWRank(sizesi) in the case of World rank size measure, and γ+δDRank(sizesi) in the case of domestic rank size measure. t-statistics based on heteroskedasticity-consistent (White) standard errors are reported in parentheses.. 0.0273 (2.30). Firm: Average 0.0241 (7.90). Exchange rate. 0.2627 (4.27) -0.0268 (-1.63) 0.0076 (0.71) 0.0687 (4.16) -0.0264 (-1.82). 0.2745 (14.93) -0.0210 (-5.15) 0.0051 (1.54) 0.0538 (12.26) -0.0194 (-4.18). Firm: World Rank 0.0072 (1.15) 0.0294 (3.39) 0.2762 (15.01) -0.0205 (-5.03) 0.0049 (1.47) 0.0537 (12.23) -0.0190 (-4.10). No of obs.. 1229. 20687. 20687. IFCG Indices γ δ λ Stabilization Trade Privatization. 22. Firm: Domestic Rank 0.0066 (1.08) 0.0304 (3.55) 0.2752 (14.97) -0.0206 (-5.05) 0.0043 (1.31) 0.0533 (12.12) -0.0193 (-4.16) 20687.
(27) Table 5: Post Liberalization Performance M1 (IFCG indices): Rit=αi+γPostLibit+[λWRett]+εit M2 (Individual Firms): Rsit=αsi+γPostLibit+[λWRett]+εsit M3 (World Rank in Size):Rsit=αsi+γPostLibit+δ(WRank(sizesi)*PostLibit)+[λWRett]+εsit M4 (Domestic Rank in Size):Rsit=αsi+γPostLibit+δ(DRank(sizesi)*PostLibit)+[λWRett]+εsit The panel regressions are performed using monthly logarithmic returns of both IFCG indices and individual firms in 12 emerging markets. The data covers 36 months before and 36 months after market liberalization, excluding the 8-month DurLib period. R(s)it is the logarithmic return for country i (for asset s in country i ) at time t. PostLibit is a dummy variable that takes on the value one in each of the 36 PostLib months in country i. α(s)i measures the average monthly return for country i (for firm s in country i ) before market liberalization and γ measures the average monthly abnormal return after liberalization across all the countries. WRett is the logarithmic World market return (MSCI World Index). WRank(sizesi) is a worldwide rank measure in firm size {= (firm’s rank in the World/total number of firms in 12 markets)}. DRank(sizesi) is a firm’s rank in the local market i {= (firm’s rank in the country /total number of firms in that market)}. The change in performance for M3 and M4 are measured by γ+δWRank(sizesi) in the case of World rank size measure, and γ+δDRank(sizesi) in the case of domestic rank size measure. t-statistics based on heteroskedasticity-consistent (White) standard errors are reported in parentheses. Before Controlling for World Market Return. γ. After Controlling for World Market Return. IFCG Indices. Firm: Average. Firm: World Rank. Firm: Domestic Rank. IFCG Indices. Firm: Average. Firm: World Rank. Firm: Domestic Rank. 0.0048 (0.98). 0.0023 (1.50). 0.0172 (4.22). 0.0156 (3.67). 0.0114 (2.41). 0.0089 (5.86). 0.0223 (5.52). 0.0223 (5.29). -0.0257 (-4.28). -0.0219 (-3.63). -0.0230 (-3.91). -0.0220 (-3.69). δ λ. 0.4678 (6.19). 0.4493 (24.79). 0.4479 (24.70). 0.4492 (24.78). No of cross sections. 12. 305. 305. 305. 12. 305. 305. 305. No of observations. 795. 17810. 17810. 17810. 795. 17810. 17810. 17810. 23.
(28) Table 6: Post Liberalization Performance after Controlling for Concurrent Economic Reforms M1 (IFCG indices): Rit=αi+γPostLibit+λWRett+φ’CER+εit M2 (Individual Firms): Rsit=αsi+γPostLibit+λWRett+φ’CER+εsit M3 (World Rank in Size):Rsit=αsi+γPostLibit+δ(WRank(sizesi)*PostLibit)+λWRett+φ’CER+εsit M4 (Domestic Rank in Size):Rsit=αsi+γPostLibit+δ(DRank(sizesi)*PostLibit)+λWRett+φ’CER+εsit The panel regressions are performed using monthly logarithmic returns of both IFCG indices and individual firms in 12 emerging markets. The data covers 36 months before and 36 months after market liberalization, excluding the 8-month DurLib period. R(s)it is the logarithmic return for country i (for asset s in country i ) at time t. PostLibit is a dummy variable that takes on the value one in each of the 36 PostLib months in country i. α(s)i measures the average monthly return for country i (for firm s in country i ) before market liberalization and γ measures the average monthly abnormal return after liberalization across all the countries. WRett is the logarithmic World market return (MSCI World Index). Four dummy variables are used to control for the effect of the concurrent economic reforms (CER): Stabilization, Trade, Privatization and the easing of exchange control. Four macroeconomic fundamentals are also used: domestic industrial production, domestic inflation rate, 3 month US T-bill rate, and real exchange rate. WRank(sizesi) is a worldwide rank measure in firm size {= (firm’s rank in the World/total number of firms in 12 markets)}. DRank(sizesi) is a firm’s rank in the local market i {= (firm’s rank in the country /total number of firms in that market)}. The change in performance for M3 and M4 are measured by γ+δWRank(sizesi) in the case of World rank size measure, and γ+δDRank(sizesi) in the case of domestic rank size measure. t-statistics based on heteroskedasticity-consistent (White) standard errors are reported in parentheses.. 0.0093 (1.87). Firm: Average 0.0079 (4.86). Exchange rate. 0.4688 (6.06) -0.0197 (-0.90) 0.0076 (0.56) 0.0355 (1.22) -0.0179 (-0.80). 0.4515 (24.57) 0.0002 (0.00) -0.0027 (-0.66) 0.0131 (2.05) -0.0228 (-3.89). Firm: World Rank 0.0206 (5.00) -0.0215 (-3.65) 0.4498 (24.46) 0.0005 (0.14) -0.0032 (-0.78) 0.0121 (1.89) -0.0220 (-3.76). No of obs.. 795. 17810. 17810. IFCG Indices γ δ λ Stabilization Trade Privatization. 24. Firm: Domestic Rank 0.0210 (4.93) -0.0215 (-3.57) 0.4512 (24.56) -0.0003 (-0.07) -0.0027 (-0.65) 0.0132 (2.06) -0.0224 (-3.83) 17810.
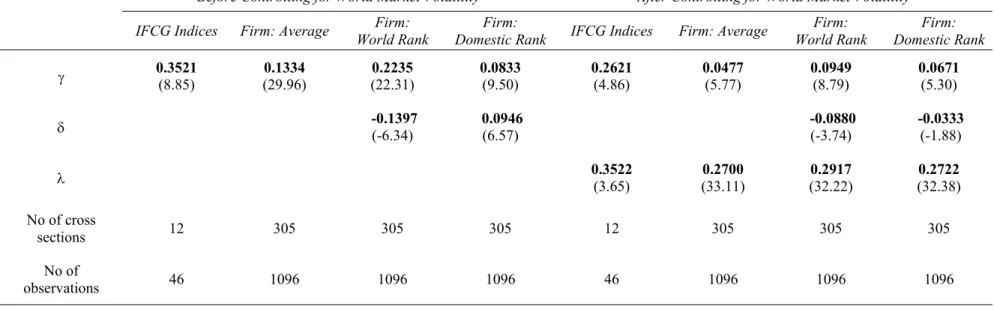
(29) Table 7: Changes in Volatility M1 (IFCG indices): Vit=αi+γPostLibit+[λWVolt]+εit M2 (Individual Firms): Vsit=αsi+γPostLibit+[λWVolt]+εsit M3 (World Rank in Size):Vsit=αsi+γPostLibit+δ(WRank(sizesi)*PostLibit)+[λWVolt]+εsit M4 (Domestic Rank in Size):Vsit=αsi+γPostLibit+δ(DRank(sizesi)*PostLibit)+[λWVolt]+εsit The panel regressions are performed using the log of annually realized volatility (standard deviation) of both IFCG indices and individual firms in 12 emerging markets. The data covers 24 months before and 24 months after market liberalization, excluding the 8-month DurLib period. V(s)it is the log of realized volatility for country i (for asset s in country i ) at time t. PostLibit is a dummy variable that takes on the value one in each of the 24 PostLib months in country i. α(s)i measures the average yearly volatility for country i (for firm s in country i ) before market liberalization and γ measures the average change in the volatility after liberalization across all the countries for IFCG indices and across all the firms for individual firms data. WVolt is the log of realized volatility of World market return (MSCI World index) that is used to control for world market volatility. WRank(sizesi) is a worldwide rank measure in firm size {= (firm’s rank/total number of firms in 12 markets)}. DRank(sizesi) is a firm’s rank in the local market i {= (firm’s rank/total number of firms in each market)}. The changes in the volatility for M3 and M4 are measured by γ+δWRank(sizesi) in the case of World rank size measure, and γ+δDRank(sizesi) in the case of domestic rank size measure. t-statistics based on heteroskedasticity-consistent (White) standard errors are reported in parentheses. Before Controlling for World Market Volatility. γ. After Controlling for World Market Volatility. IFCG Indices. Firm: Average. Firm: World Rank. Firm: Domestic Rank. IFCG Indices. Firm: Average. Firm: World Rank. Firm: Domestic Rank. 0.3521 (8.85). 0.1334 (29.96). 0.2235 (22.31). 0.0833 (9.50). 0.2621 (4.86). 0.0477 (5.77). 0.0949 (8.79). 0.0671 (5.30). -0.1397 (-6.34). 0.0946 (6.57). -0.0880 (-3.74). -0.0333 (-1.88). δ λ. 0.3522 (3.65). 0.2700 (33.11). 0.2917 (32.22). 0.2722 (32.38). No of cross sections. 12. 305. 305. 305. 12. 305. 305. 305. No of observations. 46. 1096. 1096. 1096. 46. 1096. 1096. 1096. 25.
(30) Table 8 : Changes in Volatility after Controlling for Macroeconomic Fundamentals M1 (IFCG indices): Vit=αi+γPostLibit+[λWVolt] +Γ’MF+εit M2 (Individual Firms): Vsit=αsi+γPostLibit+[λWVolt]+Γ’MF+εsit M3 (World Rank in Size):Vsit=αsi+γPostLibit+δ(WRank(sizesi)*PostLibit)+[λWVolt]+Γ’MF+εsit M4 (Domestic Rank in Size): Vsit=αsi+γPostLibit+δ(DRank(sizesi)*PostLibit)+[λWVolt]+Γ’MF+εsit The panel regressions are performed using the log of annually realized volatility (standard deviation) of both IFCG indices and individual firms in 12 emerging markets. The data covers 24 months before and 24 months after market liberalization, excluding the 8-month DurLib period. V(s)it is the log of realized volatility for country i (for asset s in country i ) at time t. PostLibit is a dummy variable that takes on the value one in each of the 24 PostLib months in country i. α(s)i measures the average yearly volatility for country i (for firm s in country i ) before market liberalization and γ measures the average change in the volatility after liberalization across all the countries for IFCG indices and across all the firms for individual firms data. Four macroeconomic fundamentals are also used: domestic industrial production, domestic inflation rate, 3 month US T-bill rate, and real exchange rate. WVolt is the log of realized volatility of World market return (MSCI World index) that is used to control for world market volatility. WRank(sizesi) is a worldwide rank measure in firm size {= (firm’s rank/total number of firms in 12 markets)}. DRank(sizesi) is a firm’s rank in the local market i {= (firm’s rank/total number of firms in each market)}. The changes in the volatility for M3 and M4 are measured by γ+δWRank(sizesi) in the case of World rank size measure, and γ+δDRank(sizesi) in the case of domestic rank size measure. t-statistics based on heteroskedasticity-consistent (White) standard errors are reported in parentheses.. γ. IFCG Indices. Firm: Average. -0.1255 (-1.59). -0.1443 (-14.77). 0.7244 (5.50) -0.5015 (-1.41) -0.2706 (-1.30) 0.3824 (4.64) -0.3710 (-3.70) 35. 0.2395 (29.11) 0.2576 (8.56) -0.0638 (-4.87) 0.4014 (50.81) -0.2519 (-24.23) 972. δ λ Industrial Production US T-bill rate Domestic Inflation Real Foreign Exchange No of obs.. 26. Firm: World Rank -0.0922 (-6.05) -0.0957 (-4.49) 0.2417 (27.59) 0.2563 (7.99) -0.0496 (-3.83) 0.3983 (49.58) -0.2454 (-23.54) 972. Firm: Domestic Rank -0.1320 (-8.26) -0.2128 (-0.91) 0.2399 (28.49) 0.2586 (8.39) -0.0601 (-4.55) 0.4004 (50.17) -0.2498 (-23.92) 972.
(31) Table 9: Changes in the Correlation Coefficient with World Market Return M1 (IFCG indices): CRit=αi+γPostLibit+[λWVolt]+εit M2 (Individual Firms): CRsit=αsi+γPostLibit+[λWVolt]+εsit M3 (World Rank in Size):CRsit=αsi+γPostLibit+δ(WRank(sizesi)*PostLibit)+[λWVolt]+εsit M4 (Domestic Rank in Size):CRsit=αsi+γPostLibit+δ(DRank(sizesi)*PostLibit)+[λWVolt]+εsit The panel regressions are performed using the annually realized correlation coefficient of both IFCG indices and individual firms in 12 emerging markets. The data covers 24 months before and 24 months after market liberalization, excluding the 8-month DurLib period. CR(s)it is the correlation coefficient with World market (MSCI World index) return for country i (for asset s in country i) at time t. PostLibit is a dummy variable that takes on the value one in each of the 24 PostLib months in country i. α(s)i measures the average yearly correlation with World market return for country i (for firm s in country i ) before market liberalization and γ measures the average change in the correlation after liberalization across all the countries for IFCG indices and across all the firms for individual firms data. WVolt is the realized volatility of World market return (MSCI World index) that is used to control for World market volatility. WRank(sizesi) is a worldwide rank measure in firm size {= ( firm’s rank/total number of firms in 12 markets)}. DRank(sizesi) is a firm’s rank in the local market i {= (firm’s rank/total number of firms in each market)}. The change in the correlation coefficient for M3 and M4 are measured by γ+δWRank(sizesi) in the case of World rank size measure, and γ+δDRank(sizesi) in the case of domestic rank size measure. t-statistics based on heteroskedasticity-consistent (White) standard errors are reported in parentheses. Before Controlling for World Market Volatility. γ. After Controlling for World Market Volatility. IFCG Indices. Firm: Average. Firm: World Rank. Firm: Domestic Rank. IFCG Indices. 0.0157 (0.37). 0.0605 (9.40). -0.0141 (-0.97). 0.0652 (4.40). 0.0039 (0.08). 0.1524 (5.68). -0.0094 (-0.31). δ λ. Firm: Average -0.0223 (-3.62). Firm: World Rank. Firm: Domestic Rank. -0.1058 (-8.81). -0.0120 (-0.86). 0.1647 (7.33). -0.0191 (-0.82). 1.3001 (2.18). 2.2129 (35.54). 2.2361 (36.06). 2.2121 (35.50). No of cross sections. 12. 305. 305. 305. 12. 305. 305. 305. No of observations. 46. 1096. 1096. 1096. 46. 1096. 1096. 1096. 27.
(32) Table 10 : Changes in the Correlation Coefficient with World Market Return after Controlling for Macroeconomic Fundamentals M1 (IFCG indices): CRit=αi+γPostLibit+[λWVolt]+Γ’MF +εit M2 (Individual Firms): CRsit=αsi+γPostLibit+[λWVolt]+Γ’MF +εsit M3 (World Rank in Size):CRsit=αsi+γPostLibit+δ(WRank(sizesi)*PostLibit)+[λWVolt]+Γ’MF +εsit M4 (Domestic Rank in Size):CRsit=αsi+γPostLibit+δ(DRank(sizesi)*PostLibit)+[λWVolt]+Γ’MF +εsit The panel regressions are performed using the annually realized correlation coefficient of both IFCG indices and individual firms in 12 emerging markets. The data covers 24 months before and 24 months after market liberalization, excluding the 8-month DurLib period. CR(s)it is the correlation coefficient with World market (MSCI World index) return for country i (for asset s in country i) at time t. PostLibit is a dummy variable that takes on the value one in each of the 24 PostLib months in country i. α(s)i measures the average yearly correlation with World market return for country i (for firm s in country i ) before market liberalization and γ measures the average change in the correlation after liberalization across all the countries for IFCG indices and across all the firms for individual firms data. Four macroeconomic fundamentals are also used: domestic industrial production, domestic inflation rate, 3 month US T-bill rate, and real exchange rate. WVolt is the realized volatility of World market return (MSCI World index) that is used to control for World market volatility. WRank(sizesi) is a worldwide rank measure in firm size {= ( firm’s rank/total number of firms in 12 markets)}. DRank(sizesi) is a firm’s rank in the local market i {= (firm’s rank/total number of firms in each market)}. The change in the correlation coefficient for M3 and M4 are measured by γ+δWRank(sizesi) in the case of World rank size measure, and γ+δDRank(sizesi) in the case of domestic rank size measure. t-statistics based on heteroskedasticityconsistent (White) standard errors are reported in parentheses.. γ. IFCG Indices. Firm: Average. -0.0813 (-1.13). -0.0466 (-7.68). 0.1875 (2.38) -0.4508 (-1.55) -0.8661 (-8.69) 0.0171 (0.16) -0.0777 (-0.62) 35. 1.9769 (73.19) -0.2081 (-4.74) -0.0614 (-7.88) 0.0022 (0.26) -0.0267 (-3.27) 972. δ λ Industrial Production US T-bill rate Domestic Inflation Real Foreign Exchange No of obs. 28. Firm: World Rank -0.1059 (-7.42) 0.1035 (4.41) 1.9702 (73.01) -0.2250 (-5.03) -0.0665 (-7.73) 0.0086 (0.96) -0.0261 (-3.09) 972. Firm: Domestic Rank -0.0895 (-6.76) 0.0731 (3.35) 1.9675 (73.48) -0.2177 (-4.92) -0.0638 (-8.13) 0.0040 (0.47) -0.0257 (-3.13) 972.
(33)
Figure

+7


Documents relatifs
This study supports the contention that, when following recom- mended application rates and best mosquito control practices, treat- ments with the VectoBac® WDG
1.9 Acquiring Intercultural Competence Through Virtual Communities The intercultural competence has increasingly become one the most important skill in this 21st Century and has
marketization of this sector has allowed workers in public services to get rising extra wage income (bonus, subsidy, etc.) on top of wages provided by the government. The
Les cas d'événements thrombotiques associés à une thrombopénie qui ont été rapportés suite à la vaccination avec le vaccin AstraZeneca (Vaxzevria®, auparavant appelé
As a result, these results confirm the predictions of the theoretical model that the industries with low trade costs (low tariff barriers), high fixed production costs, low
Gaps in research still exist with respect to measuring the qualitative effects of official labour market integration programmes, validation measures and other courses
While productivity measures the ability of employment, labour cost analyzes the efficiency of the employment and the competitive advantages between Ticino and the Italian
Our results provide three lines of evidence that suggest that DSB formation could help override the impediments to early-response gene expression: (1) DSB formation in the
