BCI performance and brain metabolism profile in severely brain-injured patients
1
without response to command at bedside
2
Jitka Annen1, Séverine Blandiaux1, Nicolas Lejeune1,2,3, Mohamed Ali Bahri4, Aurore Thibaut1,
3
Woosang Cho5, Christoph Guger5,6, Camille Chatelle1,7*, Steven Laureys1*
4
1 GIGA Consciousness, Coma Science Group, University and University Hospital of Liège
5
2 Disorders Of Consciousness Care Unit, Centre Hospitalier Neurologique William Lennox,
6
Université Catholique de Louvain, Ottignies-Louvain-la-Neuve, Belgium 7
3 Institute of Neuroscience, Université catholique de Louvain, Brussels, Belgium
8
4 GIGA-Cyclotron Research Centre In Vivo Imaging, University of Liège, Belgium
9
5 g.tec Medical Engineering GmbH, Schiedlberg, Austria
10
6 Guger Technologies OG, Graz, Austria
11
7 Laboratory for NeuroImaging of Coma and Consciousness - Department of Neurology,
12
Massachusetts General Hospital, Harvard Medical School, Boston, USA 13
* Authors contributed equally. Correspondence:
14
Steven Laureys: Steven.Laureys@uliege.be 15
Camille Chatelle: Camille.Chatelle@uliege.be 16
Keywords: Covert command following, P3, FDG-PET, disorders of consciousness,
17
consciousness, brain computer interface.
18
Abstract
19
Detection and interpretation of signs of ‘covert command following’ in patients with disorders of 20
consciousness remains a challenge for clinicians. In this study, we used a tactile P3-based BCI in 12 21
patients without behavioral command following, attempting to establish ‘covert command 22
following’. These results were then confronted to cerebral metabolism preservation as measured with 23
glucose PET (FDG-PET). 24
One patient showed ‘covert command following’ (i.e., above-threshold BCI performance) during the 25
active tactile paradigm. This patient also showed a higher cerebral glucose metabolism within the 26
language network (presumably required for command following) when compared with the other 27
patients without ‘covert command-following’ but having a cerebral glucose metabolism indicative of 28
minimally conscious state. 29
Our results suggest that the P3-based BCI might probe ‘covert command following’ in patients 30
without behavioral response to command and therefore could be a valuable addition in the clinical 31
assessment of patients with disorders of consciousness. 32
Introduction
33
Severely brain-injured patients with disorders of consciousness (DOC) can be distinguished by their 34
ability to show either only reflexive and thus unconscious behavior (unresponsive wakefulness 35
syndrome, UWS)1, or more purposeful reactions to the environment without (minimally 36
consciousness state minus, MCS-) or with signs of language preservation such as response to 37
command (minimally consciousness state plus, MCS+)2,3. A clinical challenge presents itself when
38
diagnosing patients correctly, yet, accurate diagnosis is key for treatment and prognosis. Indeed, 39
patients with residual consciousness have increased chances of recovery and respond better to various 40
treatments such as tDCS4, possibly modulating cortical excitability in DOC patients5, and 41
amantadine6. 42
Structured behavioral assessment, such as the Coma Recovery Scale-Revised (CSR-R), led to an 43
important reduction of the misdiagnosis rate7, especially when the behavioral assessment is repeated
44
at least five times8. In addition, passive neuroimaging techniques can quantify structural and 45
functional brain damage, and could ultimately be used as supplemental tools for diagnosis9–12. 46
Among them, 18F-fluorodeoxyglucose positron emission tomography (FDG-PET) has been used to 47
indicate that the absence of overt signs of consciousness does not necessarily indicate that the patient 48
is unconscious13. Resting state EEG can be used to passively assess DOC patients’ consciousness
49
level, for which spectral measures and functional connectivity are most successful and widely
50
employed (for review see14).
51
Active ways of assessing covert consciousness and command following are more challenging as it 52
necessitates cognitive integrity for command following (e.g., language comprehension, memory)15. 53
However, it brings additional key information as patients showing early signs of (covert) command 54
following have a better chance of good outcome16. Furthermore, command following can potentially 55
be used to establish functional communication which could dramatically increase the patient’s quality 56
of life. 57
About one decade ago, the first evidence for ‘covert command following’ in absence of overt 58
command following was reported using functional MRI17, further used a couple of years later to
59
enable an MCS- patient to functionally communicate18,19. However, fMRI is expensive and hardly
60
accessible for repeated assessments. For this reason, other techniques that can measure voluntary 61
responses not observable at bedside have been used to assess ‘covert command following’. EEG-62
based detection of motor imagery showed their potential to establish command following in about 63
20% of the patients with DOC20,21. The P3 event related potential (ERP), which is observed about 64
300-500ms after the presentation of a deviant sensory stimulus in a train of standard stimuli, reflects 65
the novelty of the stimulus. The P3 can be present in varying levels of consciousness, for example in 66
response to the subjects’ own name22,23, and it is less sensitive than spectral and connectivity
67
measures in discriminating between UWS and MCS patients24. Nevertheless, it is also known that 68
attention (which requires consciousness, by definition) can modify the amplitude of the P3 (for 69
review25). Other systems, that do not depend on brain activity directly, used subliminal limb
70
movements (i.e., electromyogram) 26,27, modulation of breathing 28 or of pH saliva29, pupil dilation 71
during mental effort 30 for detecting command following and communication in DOC or locked in
72
syndrome patients (i.e., fully paralyzed but conscious). However, all these techniques are relying on 73
experts for data acquisition and offline data analysis, and tools that can be directly implemented in 74
clinical setting for non-experts are needed. 75
In this prospective study, we used a commercially available P3-based BCI system with direct 76
feedback about the patient’s performance in clinically well-characterized patients with DOC. Our aim 77
was to identify patients with signs of ‘covert command following’, and compare those results to 78
cerebral glucose metabolism preservation as measured with FDG-PET13. A secondary aim was to 79
investigate whether there is a relationship between the BCI performance and the level of 80
consciousness (as defined by the CRS-R and the FDG-PET) at the group level. 81
Methods
82
Subjects 83
The study was conducted from November 2015 till July 2016 and included a convenience sample of 84
12 adult patients. Inclusion criteria were patients with DOC without response to command (i.e., UWS 85
or MCS-) after a period of coma and the availability of FDG-PET within one week of the BCI 86
assessment. Exclusion criteria were being less than 16years old, history of developmental, 87
neurologic, or major psychiatric disorder resulting in functional disability before the insult, and being 88
in a (sub-)acute stage after injury (<3 months). All patients were hospitalized for one week in the 89
University Hospital of Liège for a thorough clinical assessment of their medical and cognitive status. 90
This assessment included FDG-PET, MRI, EEG and repeated behavioral assessments with the CRS-91
R. Diagnosis of UWS or MCS- was based on the best out of a minimum of five CRS-R assessments 92
during this one-week hospitalization. The ethics committee of the Faculty of Medicine of the 93
University of Liège approved the study, and written informed consent was obtained from the 94
patient’s legal representative in accordance with the Declaration of Helsinki. 95
BCI assessment and data processing 96
Hard- and software were developed by g.tec (mindBEAGLE g.tec Guger Technologies OG, Graz, 97
Austria). Data were recorded from 8 active gel electrodes (Fz, Cz, C3, C4, CPz, CP1, CP2, Pz) 98
sampled at 256Hz, referenced to the mastoids, and filtered between 0.1-30Hz using a Butterworth 4th
99
order filter. The BCI analyzed the P3 event related potential for the assessment of ‘covert command 100
following’ and potentially communication. 101
The employed oddball paradigms administered mechanical vibrations with a frequency of 225Hz, 102
which lasted for 30ms, with an inter-stimulus interval of 270ms. A total of 480 stimuli were 103
presented, resulting in a paradigm duration of 2.4 minutes. In the first paradigm, the vibrotactile with 104
two stimuli (VT2), stimuli were presented on the left (probability of 7/8) and right (probability of 105
1/8) wrist. Before the start of the session, the patient was aroused if needed (i.e., the patient presented 106
multiple episodes of eye closure during the CRS-R before the BCI assessment) and instructed to 107
mentally count the stimuli presented on the right wrist. If the patient showed eye closure lasting 108
longer than 10 seconds, the paradigm was paused, the patient was aroused (using the CRS-R arousal 109
facilitation protocol) and the instructions were repeated before continuation of the paradigm. In case 110
of a BCI performance above 70% during the VT2 paradigm (without artefacts from the mechanical 111
vibrations), the result was considered above chance level and the test was extended with a third 112
stimulator (VT3). The threshold of 70% was chosen because it is suggested to be the minimal 113
required performance allowing effective communication using a BCI31. The VT3 paradigm includes a
114
stimulator on the right foot which then acts as standard stimulus (probability of 6/8), and the 115
stimulators on the left and right wrists deliver deviant stimulations each with a probability of 1/8. The 116
subject was instructed through headphones which hand to attend for every block, and mentally count 117
the number of deviant stimulations. Four blocks of 15 target deviant (and 15 non-target deviant plus 118
90 standard) trials randomly assigned to the left and right wrist, were presented. After this initial 119
training phase, 6 autobiographical questions were asked to the patient. In order to answer, the patient 120
was instructed to concentrate on the left hand for answering “yes”, and on the right hand for 121
answering “no” during a 30-second period. 122
Data for ERP’s was extracted from -100 to 600 around stimulus onset. Trials with an amplitude 123
exceeding 100µV were rejected from the further analysis. Baseline correction was done using the 124
100ms before stimulus onset. The 600ms after stimulus onset was down sampled to 7 samples. The 125
data processing classified deviant trials using a linear discriminant analysis with 56 features (7 time-126
points of the down-sampled ERP, for 8 channels). The BCI performance (i.e., the percentage of 127
detected deviant trials), ranging from 0 to 100%, was calculated using a 10-fold cross-validation. For 128
more detailed information on the stimulus presentation and analysis, please refer to previous 129
studies32,33.
130
FDG-PET acquisition and processing 131
Resting 18F-FDG-PET acquisition was performed about 30 minutes after intravenous injection of 132
approximately 150MBq radioactive labelled glucose (Gemini TF PET-CT scanner, Philips Medical 133
Systems) in order to quantify cerebral glucose uptake. A low dose CT was acquired prior the 12-134
minute emission scan and used for attenuation correction. PET images were reconstructed using the 135
iterative LOR RAMLA algorithm and correction for dead-time, random events and scatter were 136
applied. 137
Preprocessing and statistical analysis were done in the Statistical Parametric Mapping toolbox 138
(SPM12, www.fil.ion.ucl. ac.uk/spm) implemented in MATLAB (R2017a). Preprocessing was done 139
as described previously13. Briefly, images were manually reoriented according to the SPM12 FDG-140
PET template, spatially normalized (using a template for patients and controls) and smoothed (with a 141
14mm FWHM Gaussian kernel). 142
Statistics 143
We identified regions that showed preserved cerebral glucose metabolism in patients who showed 144
‘covert command following’ as compared with patients with a FDG-PET typical for MCS13 who did
145
not show signs of ‘covert command following’. This was done using a factorial design with four 146
design matrices. Clusters with preserved metabolism were considered significant at FWE p<0.05. 147
The mean glucose uptake (in MBq/cc) of the largest significant cluster was extracted for these six 148
subjects using Marsbar (version 0.44, http://marsbar.sourceforge.net/). 149
Additionally, for every subject, we identified regions with relative preserved metabolism compared 150
to 34 healthy subjects to obtain a FDG-PET-based diagnosis, as described in more details 151
elsewhere13. A Wilcoxon rank-sum test and chi-square test were used to assess the difference in age
152
and gender between patients and healthy subjects used for the FDG-PET analysis. The CRS-R and 153
FDG-PET based diagnosis were confronted to the VT2 BCI performance at the group level using a 154
Wilcoxon rank-sum tests. 155
Results
156
Twelve patients were included in the study, of which four MCS- patients (age median=47.5, IQR=20 157
years; disease duration median=7.5, IQR=7.75 months; 3 males; 3 TBI, 1 anoxia), and eight UWS 158
patients (age median=43.5, IQR=25.5 years; disease duration median=50, IQR=30.5 months; 4 159
males; 2 TBI, 5 anoxia, 1 hemorrhage). The VT3 was performed in only one patient (MCS1), for 160
whom the BCI performance during the VT2 and VT3 reached 100% and 70% respectively. The BCI 161
decoded an answer for one out of six questions, but the BCI did not decode replies during further 162
attempts. This patient showed a preserved metabolism within the left hemisphere (i.e., language 163
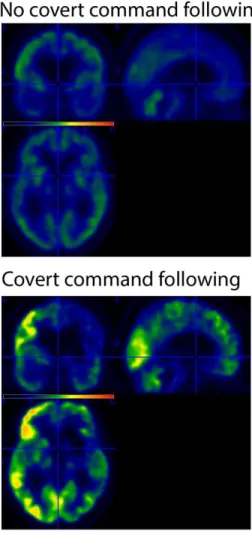
network) as compared to the other patients with a FDG-PET indicative of MCS (Figure 1). This 164
preservation was confirmed when compared with healthy subjects (Figure 2). 165
All patients behaviorally diagnosed as MCS showed cortical metabolism preservation in accordance 166
with a diagnosis of MCS. Six out of eight patients diagnosed as UWS had a FDG-PET in agreement 167
with the CSR-R based diagnosis, while the other two patients showed preserved cortical glucose 168
metabolism suggestive of MCS. The patients and healthy subjects used for the FDG-PET-based 169
diagnosis did not differ in age (Z = 0.32, p=0.75) or gender (χ2 (1) =1.98, p=0.16). Patients’
170
demographics, BCI performance, and FDG-PET diagnoses are reported in Table 1. BCI responses 171
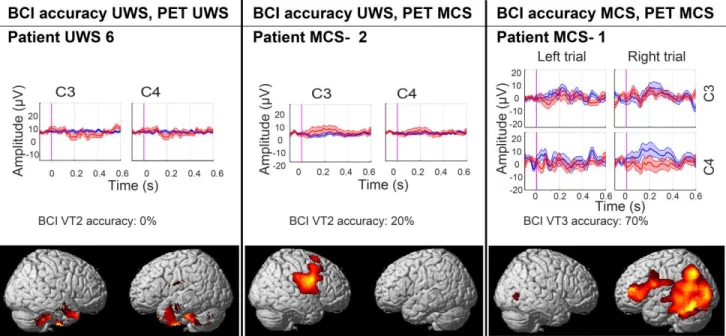
and preserved metabolism as compared to healthy subjects are presented in Figure 2 for three patients 172
(i.e. one UWS patient, one MCS- patient, and the patient with ‘covert command following’). 173
At the group level, the BCI performance during the VT2 paradigm was lower for UWS than for MCS 174
patients (UWS median=10, IQR=30; MCS median=22.5, IQR=47.5; Z = 2.10, p = 0.04). When 175
comparing the BCI performance with the FDG-PET diagnosis, the performance during the VT2 176
paradigm was also lower for UWS than for MCS patients (UWS median=10, IQR=40; MCS 177
median=20, IQR=15; Z=2.09, p = 0.04). 178
Discussion
179
In this prospective study, we used a commercially available P3-based BCI system in a convenience 180
sample of 12 clinically well-characterized patients with DOC. 181
We identified a patient with signs of ‘covert command following’, and compared those findings to 182
cerebral glucose metabolism preservation of patients without signs of ‘covert command following’. 183
We have found that one behaviorally MCS- patient (i.e. showing visual pursuit but no response to 184
command at bedside) was able to show ‘covert command following’ using the VT3 paradigm (i.e. 185
attended towards the left or the right stimulated hand, as requested). This patient, who showed 186
‘covert response to command’, had an FDG-PET in agreement with the diagnosis of MCS13. This
187
patient had already been assessed by our group about 1.5 years before and had been diagnosed in a 188
clinical state of MCS-. The week of the BCI assessment, MRI examination showed a grey matter 189
atrophy most severe in subcortical areas and in the middle and posterior cingulum, but relatively 190
limited in other cortical areas, suggesting a higher level of consciousness34. The clinical EEG showed 191
a 5Hz rhythm, which has been associated to a higher chance of being MCS+ (as compared to MCS-192
11). The FDG-PET also showed an increase in cerebral metabolism (as compared with previous
193
assessment), mostly pronounced in the regions of the right dorsolateral prefrontal cortex, the inferior 194
parietal junction and the inferior temporal gyrus. These regions, suggested before to be key regions 195
differentiating MCS- (absence of language understanding) and MCS+ (presence of language 196
understanding) patients3, were also more preserved in the patient with signs of ‘covert command 197
following’ than in the other patients with cerebral metabolism suggestive of MCS. However, the 198
outcome at 1 year after the BCI assessment still suggested a diagnosis of MCS-. The relatively good 199
results of the paraclinical assessment together with the limited motor response during clinical 200
assessment (i.e. 1/6 assessment an automatic motor reaction and 5/6 (abnormal) flexion to noxious 201
stimulation) and severe spasticity (i.e. 3/4 on the Modified Ashworth Scale for the upper limbs and 202
4/4 for the lower limbs) could therefore suggest that this patient’s behavior was mainly limited by her 203
physical rather than and cognitive impairments. 204
Previous literature have reported that about 20% of the DOC patients show covert response to 205
command if tested using active paradigms20,21. However, one of the main challenges in this field is 206
the heterogeneity in data analyses and statistical assumptions used. These choices can influence the 207
results and lead to false positives or negatives20,21, even in locked in syndrome patients assessed with
208
the same and a different system as employed in the current manuscript37. It is key to keep this in
209
mind when interpreting such data, especially in the context of DOC patients, where such false 210
negative or positive results might have harmful effects in the short and long term, triggering end-of-211
life decisions or inversely nurturing false hopes38. One way to avoid false negatives or positives is to 212
confront the results obtained through different techniques and/or modalities as presented here. 213
Multimodal approaches, even if they necessitate more time and resources, may help reduce the 214
underestimation of the patient’s levels of consciousness13,34. In the present study, the FDG-PET data
215
ensure the validity of the presented BCI results. 216
The fact that only one out of twelve patients showed signs of ‘covert command following’ (i.e., 8%, 217
vs 19%20-30%39 as previously reported in UWS patients using BCI approaches) in our small sample 218
could be explained by the high proportion of patients with anoxic brain damage in the included 219
sample, which previously have been reported to show ‘covert command following’ less often than 220
patients with a traumatic etiology21. When considering TBI patients only, 20% of the patients show 221
signs of covert command following (i.e. 1 of 5 in the current study, and 2 of 10 in Cruse et al.,20).
222
Additionally, we included solely chronic (i.e. > 3 months after injury) DOC patients as compared to 223
studies including acute DOC patients which find that 30% of the patients show ‘covert command 224
following’. Even if recovery of consciousness in the chronic phase of the disease can happen40,
225
recovery is more common to start in the acute phase after the injury41, and hence discordant results 226
suggestive of covert command-following are expected to be more frequent in the acute phase. Still, 227
the current small and heterogeneous convenience sample could limit the generalizability of the 228
results. Especially since the provided data does not include offline analysis allowing for a tailored 229
single-subject significance threshold for each session, the interpretation of these results remains 230
limited. Furthermore, vigilance fluctuation42 could also have an impact on the number of negative 231
results. For behavioral assessment, it is advised to repeat the assessment at least five times, in order 232
to avoid false negatives8. In this study, every patient was assessed only once with the P3 system.
233
Moreover, the VT3 paradigm was only tested when the results for the VT2 paradigm were promising, 234
here in one patient only. In the future, the measurements should be repeated regularly to reduce 235
diagnostic uncertainty, and to monitor the patient’s recovery. This could aid diagnosis in the acute 236
phase of the injury, as well as improve the quality of life of patients in the chronic phase of the 237
disease by providing assistive technologies and communication tools41.
238
On the other hand, we would like to highlight several strong points of the current study. Both the 239
VT2 and VT3 paradigm take only 2.4 minutes per session, which is much shorter than a motor 240
imagery paradigm that usually takes about 10 minutes20,21, or fNIRS session which takes 9 minutes43. 241
Secondly, the employed system has the potential to analyze (albeit imperfect) the data directly, and 242
provides feedback about the patient’s performance promptly. Last, the BCI results have been 243
confronted to FDG-PET data on the single-subject level, and we have shown that neuroimaging and 244
neurophysiological markers of consciousness and ‘covert command following’ were in accordance 245
with each other. 246
At the group level, the results for the VT2 paradigm showed higher BCI performance in MCS based 247
on the CRS-R and/or FDG-PET than in UWS. Previous literature during various states of 248
(un)consciousness such as sleep, anesthesia, and DOC (for review see 25) has shown evidence for the
249
absence of a link between the P3 and consciousness. However, in the acute phase of the disease, 250
outcome prediction using auditory irregularities has been successful in more than 90% of the cases44. 251
In a recent pilot study including a small sample of 12 patients, the accuracy of the vibrotactile 252
paradigm, as employed here, was proposed to be higher in patients with an increased CRS-R score 253
after 6 months39. 254
Together, this study highlights the interest of using a multimodal approach when interpreting results 255
obtained through different techniques and points towards a potential added value of the VTP3 256
paradigm in the clinical assessment of DOC patients at the single-subject level. 257
Tables and figures
258
Table 1 Demographic, BCI and FDG-PET information per patient. The clinical diagnosis of the
259
patients is based on the best CRS-R of at least five assessments that were performed within the week 260
of the BCI assessment. Fluctuations in the clinical diagnosis are presented as the proportion of best 261
diagnosis out of the total number of assessments. Median BCI performance for the two (VT2 and 262
VT3) paradigms and between brackets the number of rejected trials are presented together with the 263
FDG-PET based diagnosis. Patient MCS- 1 showed signs of response to command when assessed 264
with the BCI. 265
ID Age
range
Disease Duration
Etiology Handedness Diagnosis
stability VT2 [%] (# rejected trials) VT3 [%] (# rejected trials) FDG-PET diagnosis MCS- 1* 40-45 60m TBI Right 4/6 100 (3) 70 (1) MCS MCS- 2 20-25 40m TBI Left 6/6 20 (1) - MCS MCS- 3 55-60 8m Anoxia Right 1/6 25 (42) - MCS MCS- 4 55-60 70m TBI ? 4/6 10 (257) - MCS
UWS 1 65-70 3m Hemorrhage Right 4/4 0 (3) - MCS
UWS 2 30-35 9m TBI Left 5/5 20 (3) - MCS
UWS 3 55-60 6m Anoxia ? 5/5 75+ (0) - UWS
UWS 4 20-25 15m Anoxia ? 6/6 10 (51) - UWS
UWS 5 45-50 6m Anoxia Right 6/6 0 (23) - UWS
UWS 6 65-70 5m Anoxia Left 7/7 0 (21) - UWS
UWS 7 40-45 26m Anoxia Right 6/6 40 (480*) - UWS
UWS 8 30-35 13m TBI Right 6/6 10 (0) - UWS
* Very high amplitude response. + artifacted by mechanical artifact. 266
267
Figure 1. Preserved glucose metabolism (in red-yellow) as measured with FDG-PET for the MCS-
269
patient with signs of ‘covert command following’ compared to patients with a FDG-PET indicative 270
of MCS without signs of ‘covert command following’ (top left). Bottom left figure, mean glucose 271
uptake of the more significant cluster (in MBq/cc) for every patient (patients with a MCS FDG-PET 272
in absence of ‘covert command following’ represented with circles, the MCS- patient who did show 273
signs of ‘covert command following’ represented with a cross). Average standardized uptake value 274
for the patients without ‘covert command following’ (right top), and the standardized uptake value 275
for the patient with ‘covert command following’. 276
277
278
Figure 2. BCI performance and areas of preserved (in red-yellow) cerebral glucose metabolism
280
compared to healthy subjects (significant at <0.001 uncorrected). Results are presented for a 281
representative MCS and UWS patient without covert response to command, and for the patient with 282
covert response to command. In the ERP plot blue lines represent the P3 for the attended hand, and 283
red line represent the P3 for the unattended hand. 284
285
Conflict of Interest
287
The authors declare that the hard- and software was made available by Gtec. Author WC is 288
employed by g.tec Medical Engineering GmbH, CG is the CEO of g.tec Medical Engineering GmbH 289
and g.tec Guger technologies OG. The other authors declare no competing interests. Steven Laureys
290
is on the scientific advisory board of Gtec Medical Engineering.
291
Author Contributions
292
JA designed the work, did the acquisition, analysis, and interpretation of data for the work and 293
drafted the work. SB and NL did a significant part of the data acquisition and revised the manuscript 294
critically for important intellectual content. CC, MB, AT, WC, CG were involved in data analysis 295
and revised the manuscript. SL designed the work and revised it critically for important intellectual 296
content. All authors gave their final approval of the version to be published and agree to be 297
accountable for all aspects of the work in ensuring that questions related to the accuracy or integrity 298
of any part of the work are appropriately investigated and resolved. 299
Funding
300
The study was supported by the University and University Hospital of Liège, the French Speaking 301
Community Concerted Research Action (ARC 12-17/01), the Belgian National Funds for Scientific 302
Research (FRS-FNRS), Human Brain Project (EU-H2020-fetflagship-hbp-sga1-ga720270), 303
Luminous project (EU-H2020-fetopen-ga686764), the James McDonnell Foundation, Mind Science 304
Foundation, IAP research network P7/06 of the Belgian Government (Belgian Science Policy), the 305
European Commission, the Public Utility Foundation ‘Université Européenne du Travail’, 306
"Fondazione Europea di Ricerca Biomedica", the Bial Foundation, Belgian National Plan Cancer 307
(139), ECH2020 project ComaWare. CC is a Marie Sklodowska-Curie fellow (H2020-MSCA-IF-308
2016-ADOC-752686). 309
Acknowledgments
310
The authors would like to thank the patients and their caregivers for participation in the study and the 311
Neurology department of the University hospital of Liège for their dedication towards the patients. 312
References
313
1. Laureys S, Celesia GG, Cohadon F, et al. Unresponsive wakefulness syndrome: a new name 314
for the vegetative state or apallic syndrome. BMC Med. 2010;8(68):1–4. 315
2. Giacino JT, Ashwal S, Childs N, et al. The minimally conscious state: Definition and 316
diagnostic criteria. Neurology 2002;58(3):349–353. 317
3. Bruno MA, Majerus S, Boly M, et al. Functional neuroanatomy underlying the clinical 318
subcategorization of minimally conscious state patients. J. Neurol. 2012;259(6):1087–1098. 319
4. Thibaut A, Bruno M-A, Ledoux D, et al. tDCS in patients with disorders of consciousness. 320
Neurology 2014;82:1–7. 321
5. Bai Y, Xia X, Kang J, et al. TDCS modulates cortical excitability in patients with disorders of 322
consciousness. NeuroImage Clin. 2017;15:702–709. 323
6. Maythaler JM, Brunner RC, Johnson A, Thomas N. Amantadine to Improve Neurorecovery in 324
Traumatic Brain Injury – Associated Diffuse Axonal Injury : A Pilot Double-blind 325
Randomized Trial. J. Head Trauma Rehabil. 2002;17(August):300–313. 326
7. Schnakers C, Vanhaudenhuyse A, Giacino J, et al. Diagnostic accuracy of the vegetative and 327
minimally conscious state: clinical consensus versus standardized neurobehavioral assessment. 328
BMC Neurol. 2009;9:35. 329
8. Wannez S, Heine L, Thonnard M, et al. The repetition of behavioral assessments in diagnosis 330
of disorders of consciousness. Ann. Neurol. 2018;(4):1–20. 331
9. Rosanova M, Gosseries O, Casarotto S, et al. Recovery of cortical effective connectivity and 332
recovery of consciousness in vegetative patients. Brain 2012;135:1–13. 333
10. King JR, Faugeras F, Gramfort A, et al. Single-trial decoding of auditory novelty responses 334
facilitates the detection of residual consciousness. Neuroimage 2013;83:726–738. 335
11. Chennu S, Annen J, Wannez S, et al. Brain networks predict metabolism, diagnosis and 336
prognosis at the bedside in disorders of consciousness. Brain 2017;140:2120–2132. 337
12. Demertzi A, Antonopoulos G, Heine L, et al. Intrinsic functional connectivity differentiates 338
minimally conscious from unresponsive patients. Brain 2015;138:2619–31. 339
13. Stender J, Gosseries O, Bruno M-A, et al. Diagnostic precision of PET imaging and functional 340
MRI in disorders of consciousness: a clinical validation study. Lancet 2014;6736(14):8–16. 341
14. Bai Y, Xia X, Li X. A review of resting-state electroencephalography analysis in disorders of 342
consciousness. Front. Neurol. 2017;8(SEP) 343
15. Andrews K, Murphy L, Munday R, Littlewood C. Misdiagnosis of the vegetative state: 344
retrospective study in a rehabilitation unit. Br. Med. J. 1996;313:13–16. 345
16. Whyte J, Cifu D, Dikmen S, Temkin N. Prediction of functional outcomes after traumatic 346
brain injury: A comparison of 2 measures of duration of unconsciousness. Arch. Phys. Med. 347
Rehabil. 2001;82(10):1355–1359. 348
17. Owen AM, Coleman MR, Boly M, et al. Detecting awareness in the vegetative state. Science 349
(80-. ). 2006;313:1402. 350
18. Bardin JC, Fins JJ, Katz DI, et al. Dissociations between behavioural and functional magnetic 351
resonance imaging-based evaluations of cognitive function after brain injury. Brain 352
2011;134(3):769–782. 353
19. Monti MM, Vanhaudenhuyse A, Coleman MR, et al. Willful modulation of Brain Activity in 354
Disorders of Consciousness. N. Engl. J. Med. 2010;362(7):579–589. 355
20. Cruse D, Chennu S, Chatelle C, et al. Bedside detection of awareness in the vegetative state: A 356
cohort study. Lancet 2011;378(9809):2088–2094. 357
21. Cruse D, Chennu S, Chatelle C, et al. Relationship between etiology and covert cognition in 358
the minimally conscious state. Neurology 2012;78(11):816–822. 359
22. Perrin F, Schnakers C, Schabus M, et al. Brain response to one’s own name in vegetative state, 360
minimally conscious state, and locked-in syndrome. Arch Neurol 2006;63(4):562–569. 361
23. Li R, Song WQ, Du JB, et al. Connecting the P300 to the diagnosis and prognosis of 362
unconscious patients. Neural Regen. Res. 2015;10(3):473–480. 363
24. Sitt JD, King J-R, El Karoui I, et al. Large scale screening of neural signatures of 364
consciousness in patients in a vegetative or minimally conscious state. Brain 2014;1–13. 365
25. Chennu S, Bekinschtein TA. Arousal modulates auditory attention and awareness: Insights 366
from sleep, sedation, and disorders of consciousness. Front. Psychol. 2012;3(MAR):1–9. 367
26. Lesenfants D, Habbal D, Chatelle C, et al. Electromyographic decoding of response to 368
command in disorders of consciousness. Neurology 2016;87(20):2099–2107. 369
27. Habbal D, Gosseries O, Noirhomme Q, et al. Volitional electromyographic responses in 370
disorders of consciousness. Brain Inj. 2014;28(9):1171–9. 371
28. Charland-Verville V, Lesenfants D, Sela L, et al. Detection of response to command using 372
voluntary control of breathing in disorders of consciousness. Front. Hum. Neurosci. 373
2014;8(DEC):1020. 374
29. Wilhelm B, Jordan M, Birbaumer N. Communication in locked-in syndrome: Effects of 375
imagery on salivary pH. Neurology 2006;67(3):534–535. 376
30. Stoll J, Chatelle C, Carter O, et al. Pupil responses allow communication in locked-in 377
syndrome patients. Curr. Biol. 2013;23(15):R647–R648. 378
31. Noirhomme Q, Brecheisen R, Lesenfants D, et al. “Look at my classifier’s result”: 379
Disentangling unresponsive from (minimally) conscious patients. Neuroimage 2015;145:288– 380
303. 381
32. Ortner R, Espinosa A, Rodriguez J, et al. A BCI-based tool for detection of awareness and for 382
communication with non-responsive patients. Lect. Notes Comput. Sci. 2014;8513:527–535. 383
33. Guger C, Spataro R, Allison BZ, et al. Complete locked-in and locked-in patients: Command 384
following assessment and communication with vibro-tactile P300 and motor imagery brain-385
computer interface tools. Front. Neurosci. 2017;11(MAY):1–11. 386
34. Annen J, Frasso G, Crone JS, et al. Regional brain volumetry and brain function in severely 387
brain-injured patients. Annals 2018;Accepted a:1–28. 388
35. Goldfine AM, Bardin JC, Noirhomme Q, et al. Reanalysis of “Bedside detection of awareness 389
in the vegetative state: a cohort study.” Lancet 2013;381(9863):289–291. 390
36. Cruse D, Chennu S, Chatelle C, et al. Authors’ reply. Lancet 2013;381(9863):291–292. 391
37. Spüler M. No Evidence for Communication in the Complete Locked-in State. PLoS One 392
2018;1–4. 393
38. Jox RJ, Bernat JL, Laureys S, Racine E. Disorders of consciousness: Responding to requests 394
for novel diagnostic and therapeutic interventions. Lancet Neurol. 2012;11(8):732–738. 395
39. Spataro R, Heilinger A, Allison B, et al. Preserved somatosensory discrimination predicts 396
consciousness recovery in unresponsive wakefulness syndrome. Clin. Neurophysiol. 397
2018;129(6):1130–1136. 398
40. Estraneo A, Moretta P, Loreto V, et al. Late recovery after traumatic, anoxic, or hemorrhagic 399
long-lasting vegetative state. Neurology 2010;75(3):239–245. 400
41. Whyte J, Nakase-Richardson R, Hammond FM, et al. Functional outcomes in traumatic 401
disorders of consciousness: 5-year outcomes from the National Institute on Disability and 402
Rehabilitation Research traumatic brain injury model systems. Arch. Phys. Med. Rehabil. 403
2013;94(10):1855–1860. 404
42. Piarulli A, Bergamasco M, Thibaut A, et al. EEG ultradian rhythmicity differences in 405
disorders of consciousness during wakefulness. J. Neurol. 2016;June:1–15. 406
43. Chaudhary U, Xia B, Silvoni S, et al. Brain-Computer Interface-Based Communication in the 407
Completely Locked-In State. PLoS Biol. 2017;15(1):1–25. 408
44. Tzovara A, Rossetti AO, Juan E, et al. Prediction of awakening from hypothermic postanoxic 409
coma based on auditory discrimination. Ann. Neurol. 2016;79(5):748–757. 410