Building Performance Simulation Tools:
Selection Criteria and User Survey
Research Based Report
31 January 2010
prepared by
Shady Attia,
Architecture et climat,
Université catholique de Louvain,
Louvain La Neuve,
Disclaimer
The contents of this report are based on research conducted by Architecture et climat at
Université catholique de Louvain.
The views, opinions, findings, conclusions and recommendations contained herein are those of
the authors and should not be interpreted as necessarily representing policies or endorsements,
either expressed or implied, of Université catholique de Louvain.
Table of Contents
0. Summary... 4
1. Introduction ... 1
1.1 Problem context ... 5
1.2 Definition of problem... 6
1.3 Objective and Methodology... 6
2. Tools Selection Criteria ... 7
2.1 Major interested bodies... 7
2.2 Previous studies... 8
2.3 Tools selection criteria... 9
2.3.1 Usability and Information Management of the interface ... 9
2.3.2 Integration of Intelligent design Knowledge-Base... 9
2.3.3 Accuracy and Ability to simulate Detailed and Complex building Components... 10
2.3.4 Interoperability of Building Modelling ... 10
2.3.5 Integration of tools in Building Design Process... 11
3. Questionnaire... 12
3.1 Survey 1 ... 12
3.2 Survey 2... 13
4. Analyzing Results... 13
5. Discussion ... 22
5.1 Tools selection criteria ... 22
5.2 The Gap ... ... 25
6 Conclusions ... 27
7 References ... 28
Summary:
This report reviews potential challenges and opportunities for using Building Performance Simulation (BPS) tools. After reviewing current trends in building simulation, it outlines major criteria for BPS tools selection and evaluation based on analyzing user’s needs for tools capabilities and requirement specifications. The research methodology is based on a literature review and two online surveys. The findings are based on an inter-group comparison between architects’ vis-à-vis engineers’. The aim is to rank BPS tools selection criteria and compare ten state-of-the-arts BPS tools in the USA market. Lastly, the paper presents five criteria composed to stack up against theories and practices of building performance simulation. Based on the experience gained during the survey, the suggested criteria is critically reviewed and tested. The final results indicate a wide gap between architects and engineers priorities and tools ranking. This gap is discussed and suggestions for improvement to current BPS tools are presented.
1. Introduction
1.1 Problem context
Since the inception of the building simulation discipline it has been constantly evolving as a vibrant discipline that produced a variety of Building Performance Simulation (BPS) tools that are scientifically and internationally validated. The foundation work for building simulation was done in the 60s and 70s focusing on building thermal performance addressing load calculation and energy analysis (Kusuda, 1999; Clarke, 1985; Kusuda, 1970). In the late 70s, and continued through the 80s, efforts were invested into analytically validated and experimental testing methods for codes for simulation tools (Augenbroe 2002). This foundation work was developed mainly within the research community of the mechanical engineering domain. Simulation tools were developed by technical researchers and building scientist aiming to address the needs of engineers. During those early days, the user base of BPS tools was mainly limited to researchers and experts who are concerned with detailed energy analysis applied during design development phases. For example, simulations were performed to estimate peak hourly loads for heating and cooling seasons or predict the annual consumed energy in order to size and select mechanical equipments for large buildings.
It was until the 90s that the building simulation discipline reached a certain level of maturation offering a range of tools for building performance evaluation (Hensen, Lamberts et al. 2002). The beginning of the 90s manifested the shift from an energy consumption focus to many other building performance characteristics (Augenbroe 1992). For example, the integrated modelling whereby the heat and mass transfer, air flow, visual and acoustic aspects of performance were considered. This shift led to a the development to a relatively large range function complete tools (Clarke, Hensen et al. 1998). By the end of the 90s, a range of simulation applications spinned out from the research community to professional practice allowing a diverse tools landscape for a variety of users. For the first time, analytical simulation power became at the finger tips of building designers (Papamichael, LaPorta et al. 1996; Tianzhen, Jinqian et al. 1997).
This maturation of building simulation had a major influence on the building design profession and resulted into four major changes namely: • Diversifying tools users and addressing more
the whole design team
• Modifying the tools to suite early and late design phases
• Increasing the number of tools and developing a large range of function complete tools • Localizing the tools capabilities
The first major change was the trend to encourage the whole design team to use BPS tools. The increased complexity of building delivery process has led to a broader view of
BPS which resulted in a broader user’s base. Simulation tools moved progressively towards all professions involved in design of buildings including architectural designers. Architects, who have been regularly described in literature as non-specialist, non-professional, non-experts, novice or generalist (Morbitzer et al., 2001, Ibarra and Reinhart, 2009, Schlueter and Thesseling, 2009, Augenbroe, 2002, Hand and Crawley, 1997, Mahdavi, 2005) became engaged in the BPS community. Recognizing the implications of design decisions made by the different team members on the energy and environmental performance of the building, engaged all design team members in performing simulations. As a consequence, simulation tools became recognized as design support tools within the Architecture-Engineering-Construction (AEC) industry. In fact, simulation became an integrated element of the design process (Augenbroe 1992; Mahdavi 1998). This resulted into a diverse growing user’s uptake addressing more the whole design team.
The second major change was the trend to progressively move towards early design phases. Due to the increasing importance of the decisions made early in the design process and their impact on energy performance and cost, several BPS tools have been developed to help architects perform early energy analysis, and create more energy efficient more sustainable buildings (Hensen 2004).
The third change was the rapid sprawl of BPS tools. Today we have a diverse tool landscape for all building design professionals. The U.S. Department of Energy (DOE) maintains an up-to-date listing of BPS tools on the Building Energy Software Tools Directory (BESTD) website ranging from research software to commercial products with thousands of users (http://apps1.eere.energy.gov/buildings/tools_dire ctory/) (Crawley 1997). In 2009, the number of tools reached more than 378 tool (US-DOE 2009). Between 1997 and 2009 the number of tools has almost quadrupled. Figure 01 documents the number of developed tools listed on the BESTD DOE for that period.
Figure 01, BPS tools developed between 1997- 2009
The forth major change was the localization of tools capabilities. With the localization of BPS tools incorporating local weather data and provision of local building materials, construction and codes the number of tools users is growing
enormously. High quality thermal models are uploaded on earth viewer software (Google Earth) and positioned on 2D and 3D satellite images of terrain and cities. We literally can simply fly over any location on earth and come to a model and run it using BPS tools. With the rapid advances of computer technology, internet and building information technology, building simulation will be more often and more widely applied in building design and analysis worldwide offering design solutions, economic analysis, comparing & optimizing designs, computing performance and verifying compliance{Ellis, 2002 #138}.
1.2 Definition of problem
By examining those four major changes we generally can observe that BPS tools are and will continue penetrating the building design practice. Simulation tools became recognized as design support tools within the AEC industry. In fact, simulation became an integrated element of the design process (Augenbroe 1992; Mahdavi 1998).
However, a deeper examination to those previously mentioned changes, we notice that they happened so quickly and resulted into a growing landscape of tools that is considered in itself as barrier. Today, the continuing growing number of BPS tools reflects a broader variety of tools abilities but it does not necessarily reflect a wider penetration within the building design community. Already there is replication of many tools that have striking similarities with no attempt to develop design team friendly, effective and efficient design decision support applications. Most BPS tools are difficult and cumbersome to use, and cater more for engineers. The scope of most existing tools is mainly still oriented towards final design stages. Moreover, most tool developers use engineers’ feedback to develop architect friendly tools. The rapid changes could not bridge the mono-disciplinary R&D inheritance, mostly lacking the architects’ viewpoint, which does not make BPS suitable for the design (Attia, 2009). Attempts to address the architects and engineers use of BPS tools have been proposed separately by many researchers. Very little effort has been carried out to develop BPS tools with adaptive interfaces that cater for both groups, namely architects and engineers.
More importantly, there is no independent evaluation and classification of tool usability and functionality in practice versus users’ type and needs (Clarke, 2009). Tools developers rarely state the tools capabilities and limitations (Reinhart, 2006). Potential user is faced with difficulty of choosing a suitable program among this growing BPS tools pool.
In brief, we need to identify clearly the needs of different users and identify BPS capabilities and limitations in order to cross the previous mentioned barriers.
1.3 Objective and Methodology
Therefore, this study seeks to identify and study architects and engineers’ requirements and
selection criteria for BPS tools in the architectural and engineering practice. The overall objective is identify the barriers that hinder engineers and architects from integrating BPS tools in practice. Thus the goals of this study are:
(a) Ranking and identifying generic BPS tools selection criteria
(b) To conduct an inter-group comparison between architects vis-à-vis engineers (c) To compare the potential challenges and opportunities of using existing BPS tools (d) To compare ten state-of-the-arts BPS tools in the USA market
In order to rank and identify the selection criteria we conducted a literature review that forms the basis for achieving the other goals (b-d) through an online survey.
The final goal of this paper is to provide guidance and feedback to BPS tool developers, with particular focus on the different expectation of architects’ vis-à-vis engineers’ needs. This study will allow user feedback to get main knowledge into application. The paper provides also an up-to date comparison of ten major BPS tools: ECOTECT, HEED, Energy 10, Design Builder, eQUEST, DOE-2, Autodesk Green Building Studio, IES VE, EnergyPlus and Open Studio. This can provide a resource for simulation tools developers about architect and engineers needs. Comparing tools is performed to generate use cases that allow recording and identifying the BPS functions required by both groups, in order to present a checklist that forms a design basis for software developers. Finally, the study is providing a glimpse into the future, in order to allow the evolution of architecture and engineering education and profession aiming to bridge the gaps between architects and engineers in the professional design practice.
The paper is organized into six sections. The first section is positioning the research problem within the BPS community. The second section screens the selection criteria and requirements specifications of tools regarding their usability and functionality. These criteria are reviewed and collected from literature and are classified in the second section forming the basis for the two online surveys discussed in the third section. The analysis of the results and the survey findings are presented in chapter four. This includes ranking of the ten tools and comparison of different priorities and preferences of architects’ vis-à-vis engineers. The final two sections are discussing the survey findings and providing feedback to tools developers and architecture and engineering education community.
2. Tools Selection Criteria
The simulation community does not have a clear criteria to classify and evaluate the facilities offered by tools (Crawley, Hand et al. 2008). There are not yet uniform definition of tools requirements and specifications based on formal consultations with users, practitioners and tool developers (Clarke 2009). For example, there is
no common language to describe what the tools could do (Crawley, Hand et al. 2005). We note there are many nuances of the word ‘criteria’, for example, capabilities, requirements, functionality, specifications, features, factors etc… Also there is no clear methodology to compare BPS tools. Identifying the basic criteria for BPS tools can support architects and engineers creating more efficient and cost effective sustainable buildings, as well as facilitating future innovation and the progress of the AEC industry. In order to provide the necessary conditions for a evolutionary cycle of tool development; a critical review of the status quo and in-depth reflections on the tools must be achieved (Lam, Wong et al. 1999).Therefore, as part of this paper a literature review was carried out to identify, classify and group requirements and selection criteria for future development of BPS tools. The following review forms an entrée into the literature. This review forms the basis that will ensure the clarity and relevance of the questionnaire content and allow tools comparison in section three.
2.1 Major interested bodies
There are various bodies that could help with building energy modelling and simulation information. On top of those bodies, stands the International Building Performance Simulation Association IBPSA, is a non-profit international society of building performance simulation researchers, developers and practitioners, dedicated to improving the built environment. IBPSA is founded to advance and promote the science of building performance simulation in order to improve the design, construction, operation and maintenance of new and existing buildings worldwide. IBPSA is not particularly busy with developing tools selection criteria; but it provides a framework and medium for R&D of BPS industry. The bi-annual conference publications are available online and provide a source for many topics including: simulation & users, software environments & paradigms in addition to tools and interfaces selection. In fact, many IBPSA paper presented attempts to set selection and evaluation criteria of BPS tools. However, most these attempts are individual and dispersed. There is no formal attempt within IBPSA to define a formal tools requirements specification for practitioners and tool developers.
Another important body involved with evaluating BPS is the American Society of Heating, Refrigerating and Air-Conditioning Engineers (ASHRAE). ASHRAE lists what factors to take into consideration when selecting energy analysis tools. According to ASHRAE Handbook the most important criterion for selecting a tool is the capability of the tool to deal with the project requirements. The second is the complexity of input and the third is the quality of output. Also the availability of weather data is a major feature of a tool. The forth concern in selecting a tool is the auxiliary capabilities, such as economic analysis. Apart from these four criteria there are general factors that must be embedded in any energy analysis method namely, accuracy,
sensitivity, versatility, speed and cost, reproducibility and ease of use(ASHRAE 2009). Additionally ASHRAE developed the standard method of test for the evaluation of building energy analysis computer programs(ASHRAE 2007). The standard specifies test procedures for evaluating the technical capabilities and ranges of applicability of computer programs that calculate the thermal performance of buildings and their HVAC systems. The standard strength lies in its diagnostic power of the procedure, which helps program authors debug and correct software errors. However, by examining ASHRAE publications we find that they have a specific focus on accuracy and validity of tools algorithms. Thus they do not rise to be a complete set of BPS tools criteria.
The third body is the International Energy Agency (IEA). The IEA has created a number of tasks for evaluating BPS tools. However, most IEA tasks were focused only on assessing the accuracy of BPS tools in predicting the performance neglecting other important criteria. Task 12 (Building Energy Analysis and Design Tools for Solar Applications) has created a number of procedures for testing and validating building energy simulation programs. Task 22 (Building Energy Analysis Tools: Analyzing Solar and Low-Energy Buildings) assessed the accuracy of BPS tools in predicting the performance of widely used solar and low-energy concepts. Task 30 (Bringing Simulation to Application) was aiming to investigate why BPS tools were not widely used in the design process and to identify ways of overcoming this problem (Warren 2002). Task 34 (Testing and Validation of Building Energy Simulation Tools) is evaluating the accuracy and capability of analysis and design tool algorithms and developed the BESTEST procedure (Judkoff and Neymark 1995). However, most the tasks focus on quantitative evaluation measures and the audience for most IEA Tasks that are concerned with BPS tools is limited developers, and energy standards development organizations (i.e. ASHRAE, BESTEST and CEN). It is very difficult to estimate the benefit of the IEA tasks on tool users, such as architects, engineers, energy consultants, product manufacturers, and building owners and managers.
In brief, and based on the overview of the three major bodies that contribute to shape and organize the BPS domain, we do not have a body that is working to develop tools selection criteria and requirement specifications. There is a common focus among the bodies to guarantee a minimum level of reliability through simulation model validation and accuracy. Similar effort should be taken to create a framework that regulates the world of BPS tools development and assist users to select and evaluate based on other important criteria. There are many other criteria that need to be addressed and accumulated to form a consistent selection and evaluation process. The DOE BESTD provides a good start for communicating basic information on different tools including their validation,
required expertise, audience, input, output, strength and weaknesses.
2.2 Previous studies
A number of studies and surveys have been carried out in the past that were concerned with the criteria and requirements of BPS tools. In August 1995 and June 1996 the DOE sponsored workshops to provide input from developers and users to future planning efforts on future generation BPS tools (Crawley and Lawrie 1997). The developer’s workshops focused on applications, capabilities and methods and structures. The user’s workshops focused on application, capabilities, and interfaces. However, the user’s workshop group included mainly software experts, researchers and engineers. Also the workshops did not address the different requirements for different design phases. In fact, the final results focused mainly on identifying criteria for the development of a heart or calculation engine of EnergyPLUS. User interface issues were postponed for the future (Crawley and Lawrie 1997).
Ten years later, when Crawley et al compared the features and capabilities of twenty major BPS tools. they grouped the comparison criteria into 18 category including: results reporting; validation; and user interface and links to other programs (Crawley, Hand et al. 2005; Crawley, Hand et al. 2008). The grouping was based on vendor-supplied information with no uniform and standard selection criteria.
Aiming to identify the vital capabilities of BPS tools, Tianzhen Hong identified five vital criteria. The first capability is the usability. The second relates to computing capability. The third is the data exchange capability. The fourth is the database support. In the final notes of his research, published in the year 2000, the author highlighted five additional trends that are on the road ahead. The first is the knowledge-based systems. The second is the BPS for early design stages. The third is the information monitoring and diagnostic system. The fourth is the interested building design system. The fifth is the virtual reality (Hong et al., 2000).
In 2002, Augenbroe presented an overview of the trends in building simulation. In his paper the author highlighted the changing team context of simulation and how BPS tools need to be brought into the nucleus of the design team. Also the author addressed the interoperability as an emerging trend. In his paper, Augenbroe referred to functional criteria including, the usability and friendliness of interfaces, for example GUI, documentation, output presentation, error diagnostics, learning curve, adaptive usability, in addition to the integration of knowledge base within tools. Accountability and confidence in tools results was also discussed including issues such as validating the model assumption, performing sensitivity analysis, uncertainty and risk analysis, methods to assert correct data input and post-processing of output data to generate performance indicators. On the other hand, the paper addressed process related criteria
including the adaptability and integration of the tool for different design phases, users and different design iterations. Finally, the author reviewed a wish list of simulation tools and identified what remains unfulfilled of this list including the ability run perform rapid evaluation of alternatives, support decision-making, support incremental design strategies for design refinement cycle, detect when the tool is used outside its validity range and the robustness of nonlinear, mixed and hybrid simulation solvers {Augenbroe, 2002 #41}.
In 1996, Lam et al. carried out a survey on the usage of performance-based building simulation tools in Singapore (Lam, Wong et al. 1999). With one hundred and sixty four valid responses, including architects and engineers, the survey was organized around six main questions. The questions were simple and direct asking about the reasons of using or not using the tools and asking for the major limitations and obstructions. Except the question about the ability of the tools to enhance the design process, no other question could be considered as major BPS tools selection criterion.
Then in 2004, Lam conducted a study that involves the development of a comprehensive classification schema for comparing five tools and running a comparative analysis by graduate students. Lam conducted a literature review on well-known energy modelling tools that exist. A comparison of 22 tools was made based on four major criteria, namely, usability, functionality, reliability and prevalence. Under the usability criteria he listed the system requirements, Interoperability, user interface, learning curve, effort to update model, conducting parametric studies and processing time. Then, under the functionality criteria he listed the comprehensiveness of geometric and system modelling, types of energy calculations, types of data analysis and presentation and availability of other environmental domain simulations (e.g., lighting). The third criteria namely reliability included consistency of results and accuracy of results. The forth criteria was the prevalence including compliance with industry standards, documentation, user support and pricing & licensing{Lam, 2004 #190}.
In 2005, Hopfe et al identified the features and capabilities for six software tools and interviewed designers to screen the limits and opportunities for using BPS tools during early design phases (Hopfe, Struck et al. 2005). The tools classification was based on six criteria namely the capabilities, geometric modelling, defaulting, calculation process, limitation and optimization. However, the authors did not report what methodology was used to compile these criteria.
In 2005, Punjabi et al, identified major BPS tools usage problems undertaken an empirical using testing. The usability testing was based on usefulness, effectiveness, likeability and learn ability(Punjabi and Miranda 2005). The research defines six indicators for usability and information management including interface design, navigation, saving and reviewing, database
creation and learnability. However, the research was only limited to usability and did not include other tools evaluation criteria.
Summing up, bodies and previous surveys were capable of identifying general trends and needs in the BPS community. However, all these efforts are dispersed and based on individual initiatives without a unified consensus based framework. There is not yet a uniform and clear methodology or outline to assess and define tools specifications and criteria for developers, practitioners and tools users. The following section presents the five selection criteria that under grid current notion of how we can classify and evaluate the facilities offered by BPS tools.
2.3 Tools selection criteria
Summarizing the literature findings we found that the simulation community at large is thinking about and discussing at least five major challenges. As shown in Figure 02 they are namely, the (1) Usability and Information Management (UIM) of interfaces, (2) Integration of Intelligent design Knowledge-Base (IIKB), (3) Accuracy of tools and Ability to simulate Detailed and Complex and building Components (AADCC), (4) Interoperability of Building Modelling (IBM) and the (5) Integration with Building Design Process (IBDP) as. Under those five titles we classified the sub criteria and challenges, found in literature, that correspond to the five topics.
The goal in examining these challenges and criteria is not to conduct an exhaustive analysis. Instead, it is to tease out broad yet critical underlying premises to see if common ones exist. This paper does this and then applies the results to the surveys to assess how the criteria compare.
Figure 02: The five selection criteria
2.3.1 Usability and Information Management (UIM) of the interface
The usability and information management of the interface refers to the human-computer interaction. A fundamental feature of a simulation tools is to incorporate adaptive GUI that enhance the human-computer interaction and overall system effectiveness of simulation (Hefley and
Murray 1993 ). This means express information using presentation techniques and media to achieve communicative purposes and support users performing their task (Maybury and Wahlster 1998). In fact, usability is a broad term that incorporates better graphical representation of simulation input and output, simple navigation and flexible control. Users would like to see results presented in a concise and straightforward way, with a visual format or 3D spatial analysis preferred to numerical tabulation (Attia, Beltran et al. 2009). For example, CFD is very appealing to architects, engineers and even clients because of the tremendous explanatory power of graphical output. Moreover, usability entails being adaptive. This means that GUI has to adapt to certain users and certain design phases. Also usability entails the ability to learn easily, quickly and to support the user with training, online help, look-up tables and error-traps.
More to this criterion emerges information management, as a growing concern for tool users. Information management is responsible for allowing assumptions, using default values and templates to facilitate data entry (Donn 2001). Issues such as simulation input quality control, comparative reports creation, flexible data storage, user customization, simple input review as well as input modification are all considered as part of the information management features of any simulation interface (Crawley, Hand et al. 2005).
2.3.2 Integration of Intelligent design Knowledge-Base (IIKB)
The second criterion that generated several debates during the last years is the Integration of Intelligent design Knowledge-Base (IIKB) within the tool. The concept of IIKB today trades in other realms under such names as design decision support and design optimization. Since the ultimate wish of BPS users is to have tools that support the design process, the knowledge-base (KB) supports the decision making (Yezioro 2008). It should give quantitative answers regarding the influence of the design decisions (Ellis and Mathews 2002) (Lam, Wong et al. 1999). A common observation from the literature is that designers cannot estimate the relative importance of design criteria. “They feel it continuously throughout the design process, reformulating it as they compromise between what is desired and what is possible” (Papamichael and Protzen 1993). Therefore, the importance of integrating KB into tools lies in its ability to provide the user with valuable insights and directions during the design process. With the complexity of the design, next generation of simulation tools must embrace KB. This will add real power to BPS tools that will contain descriptive explanations, templates, building and components examples and procedural methods for determining appropriate installation and systems, e.g. guidelines, case studies, strategies etc… KB comprising facts and heuristic/prescriptive rules for decision taking at
least on the level of compliance with building codes (e.g. ASHRAE, IECC) and rating systems (e.g. LEED®, EnergyStar® and Green Globes®), in addition to be able to assist in adjusting the design parameters to the needs within the framework of existing codes. Despite the criticism to existing BPS tools, which incorporate expert or knowledge-based systems, that they may mislead designers due to defaulting subjective preferences (Papamichael and Protzen 1993) or the limited pre-processed rules of thumb (Donn, Selkowitz et al. 2009), there is great advantage of incorporating knowledge-base in simulation tools as an educational means that help more understanding the complex thermo physical processes and interactions within building and environmental control systems (Hand and Crawley 1997). A knowledge-base plays the role of justifier that rationalize and explain the building behaviour and in the same time guide the user during the decision making process.
Another very practical ramification of IIKB is the intelligence that is namely defined as design optimization. The intelligence entails finding quantifiable answers to design questions in order to create context specific analysis, evaluate complex design strategies, optimize design solutions, engage ‘what if’ scenarios, verify compliance and analyze life cycle (LC) and economical aspects. With the increasing analytical power of BPS tools we can examine sensitivity and uncertainty of key parameters in relation to design-decisions (Bambardekar and Poerschke 2009), compare various concepts, rank, quantify parametric and even generate semi-automatically design alternatives (Hensen 2004 ). BPS will never replace good design judgment, but it will calibrate and inspire it. Thus, one of the most important selection and evaluation criteria of BPS in future is the ability to assist design teams and answer qualitative and quantitative design questions during the design process.
2.3.3 Accuracy and Ability to simulate Detailed and Complex building Components (AADCC)
The Accuracy and Ability to simulate Detailed and Complex building Components (AADCC) is the most popular criterion found in literature for selecting and evaluating BPS tools. Under this criterion we meant to include all aspects regarding the validity and quality of simulation models and their resolution. Since the inception of BPS discipline, research has been carried out to provide analytical verification, empirical validation and comparative testing studies (ASHRAE, 2007; Judkoff, 1995). Since, all building models are simplification and abstraction of reality therefore there is no such thing as a completely validated BPS tool. However, the importance of this criterion is that it guarantees a changing common-accepted agreement representing the state-of-the-art in whole BPS programs. BPS tools are eminently challenged to represent physics accurately by the mathematical and numerical models. Thus the term ‘accuracy’
is concerned with all the aspects connected to empirical validation, analytical verification and calibration of uncertainty, as defined by IEA and BESTEST procedure, in order to provide liability and a level of quality assurance to the simulation results (Judkoff, 1995).
Another important feature incorporated under this criterion is the ability to simulate complex and detailed building components, in other words, the ability of BPS tools to perform various and specific functions with higher model resolution. With the rapid changing building technologies as well as knowledge explosion BPS are providing new features and functions allowing simulating the performance of passive design strategies (e.g. natural ventilation, shading etc...), renewable energy systems, HVAC systems, energy associated emissions, cost analysis, life cycle cost analysis (LCCA) in addition to new building elements such as green roofs, double skin facades, chilled beams, atria, concrete core conditioning etc... Therefore, we defined this criterion (AADCC) as a pervasive and persistent criterion for tools selection and evaluation.
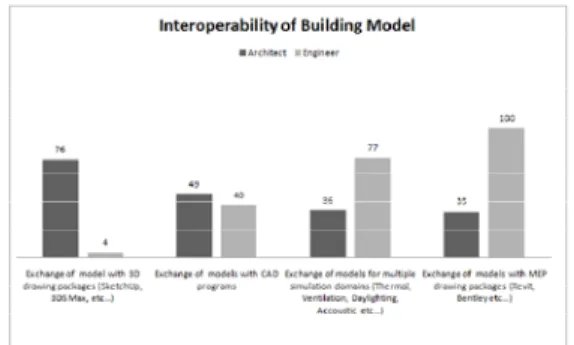
2.3.4 Interoperability of Building Modelling (IBM)
Next, we define a criterion that incorporates data exchange and the interoperability of building model. The Interoperability of Building Modelling (IBM) responds to the ability to manage and communicate building data between collaborating firms and within individual companies design, construction and maintenance. The IBM is a fundamental criterion for assessing BPS tools because it allows multidisciplinary storing of information with one virtual representation. The need for sharing information and rapid feedback exchange between various design professions emerged in the 90s (Ellis and Mathews 2002). Significant research and development has been carried out to integrate simulation tools with computer aided design (CAD) applications. However, it has been frequently reported that software application process the same building in different representations and formats and the integration of BPS tools with CAD application is not sufficient (Lam, Wong et al. 1999). Aiming to improve the integration and alliances between engineers, architects and even constructors to create realistically integrated projects together and overcome the differences between the logical model and the realities of AEC industry practice, the Industry Foundation Classes (IFC) standard evolved as an international information exchange standard that allows project participants to work across different software applications. It is possible to write IFC interfaces to HVAC design and simulation tools and cost estimation tools. It is also possible to import building geometry data from CAD. This allows the exchange of HVAC data and performance specification, construction properties, geometry. Comparison of performance and cost (Bazjanac 2003; Bazjanac 2004).
Later, as an application of the IFC formats, emerged the Building Information Modelling
(BIM), a model-based technology that is linked to a project information database (AIA 2007). BIM technology involves the creation and use of coordinated, consistent information about a building. It allows better decision making, documentation and accurate prediction of building performance. In the recent five years, BIM became a comprehensive depository of data that are accessible by many software applications that take part in the AEC industry projects (Bazjanac and Kiviniemi 2007). Recent market surveys show that 48% of the architectural offices in the US already use methods of building information modelling (AIA 2007). Direct links between BIM or non-BIM modelling tools, such as the SketchUpTM plug-in for IES and Energy Plus
or Revit Architecture plug-in IES and ECOTECT are an important ramification of BIM technology enabling the creation of deliverable that has an explicit relationship to each other, resulting in better coordinated and seamless data exchange that time, resources, effort and assures quality based liability and reduces risk.
However, the success of BIM is limited to the detailed design phase because it ensures access for the design team to BPS tools, only after the whole building design has been completed. The proposition to embrace BIM during early design phases will result in adding complexity by limiting and freezing the design choices during the most critical design phase (Eisenberg, Done et al. 2002; Donn, Selkowitz et al. 2009). Therefore, BPS tools still find a limited application during early design phases. Therefore, we should keep in mind that BIM is an application within the broader definition and objectives of the interoperability of building modelling. Thus, the challenge that is facing the IBM is to assure utmost interoperability by fluidizing model representation, allowing low and high resolution building models that correspond to all design phases and allow a design team based model.
2.3.5 Integration of tools in Building Design Process (IBDP)
The final criterion assesses the tool Integration in the Building Design Process (IBDP). The building design process is a dynamic process of creating concepts that involve design strategies and technologies and then predicting and assessing their performance with respect to the various performance considerations within the specific design context {Hien, 2003 #105}.
Within the building design community there is constant complains that BPS tools are not adaptive to the design process and its different phases and cannot be integrated into the design process (Morbitzer, Strachan et al. 2001; Yezioro 2008). There is evidence that existing tools lacks the capabilities to deal with the nature of design process. The tools does not match the design process (Lam, Wong et al. 1999; Ellis and Mathews 2002). According to Mahdavi (1998), the increasing complexity involved in the design process resulted into mono-disciplinary, specialist-professional approach that emerged as an attempt to address the design process
complexity. The aim was to assign due responsibilities to specialist so that they can contribute their specific knowledge. However, this move resulted into the fragmentation and compartmentalization of the design process (Mahdavi 1998). As consequence, the fragmentation has been echoed in the BPS domain. Today most BPS tools cater to only one discipline or only one design phase. Most BPS tools are still easier to use in developed design phases. They help designers to improve their basic concepts, not to create the basic concepts (Donn, 2001).
In fact Balcomb (1992), Tianzhen Hong (2000) and Ellis (2002) classified the BPS tools used during the design process mainly into two groups. The first is the advanced design stages evaluation tools mainly used by engineers. The second is the guidance tools used by architects. The early design phase tools are called design tools (DT) and the late design phase’s tools called detailed simulation programs (DSP). DTs are more purpose-specific and are often used at the early design phases because they require less and simpler input data. For example, DTs are very useful in the compliance checking of prescriptive building standards. Because DTs are easy to develop and test they proliferated. On the other hand, DSPs often incorporate computational techniques such as finite difference, finite elements, state space, and transfer function for building load and energy calculation. Besides design, DSPs are also useful in the compliance checking of performance-based building energy standards {Hong, 2000 #37} {Balcomb, 1992 #109} {Ellis, 2002 #138}.
On contrast, BPS tools should be adaptive and design process centric as proposed by many experts (Hayter, Torcellini et al. 2001; Mendler, Odell et al. 2006; De Wilde and Prickett 2009). With the growing importance in bridging this gap and integrating BPS tools during the whole building design delivery process simulation should be used as an integrated element of the design process (Augenbroe 1992; Mahdavi 1998). Experience has showed that high performance buildings (e.g. passive houses, low energy and zero energy buildings) cannot depend on intuitive design and therefore simulation tools should be an integral part of the design process (Torcellini, Hayter et al. 1999; Hayter, Torcellini et al. 2001). For example, the integration of BPS tools during early design phases can influence better design to achieve our millennium objectives (Robinson 1996; Mahdavi, Silvana et al. 2003; Morbitzer 2003). In order to encourage designers to use simulation tools, IBDP tools should be provided allowing the adaptive use for different purposes, by different users and at different design stages (Tianzhen, Jinqian et al. 1997). Thus the IBDP became a basic criterion for BPS tools selection and evaluation.
In brief, in this section we defined the five criteria that reflect the main stream in simulation community. The inherent limits to a synopsis of the five influential selection criteria are apparent. However, these five criteria are more linked than
the categorization suggest. In order to guarantee plausible and persuasive selection criteria, this categorization form the basis for the surveys questionnaire. The surveys provide the opportunity to test and critically judge the selection criteria. The next section explores the questionnaire design and execution.
3. Questionnaire:
The tools selections criteria were used to form the basis for of the survey questionnaire. The questionnaire was dedicated to gathering information from beginner simulation tools users including architects, engineers, designers and fresh graduate students who are concerned with sustainable building design in the USA. The survey aimed to probe the users’ perception of the most important criteria on the use and function of ten major USA market tools. How users utilize, and benefit from the tools during the design decision process
Prior to launching the survey the authors set up an online test version. Comments and suggestions were requested from peer reviewers. Reviewers were asked to revise the questionnaire and provide critical feedback in order to optimize the structure, clarity and relevance of the questionnaire before posting the final version online. Also reviewers were asked to screen and list top-ten BPS tools, using the U.S. BESTD list and the comparison study by Crawley et al in (Crawley, Hand et al. 2005). The selection had to represent an overview of state of the art BPS tools used by architects and engineers in the USA (DOE 2009). The list was narrowed down to those tools that are used for evaluating and analyzing the building energy performance. Lighting and CFD simulations have been excluded because they are disconnected from the energy and thermal performance realm. As a result, eight tools namely, ECOTECT (Autodesk 2008; Autodesk 2009), HEED (UCLA 2008; UCLA 2009), Energy 10 (E10) (NREL 2005; NREL 2009), Design Builder (DB) (DesignBuilder 2008; DesignBuilder 2009), eQUEST (LBNL and Hirsch 2009; LBNL and Hirsch 2009) , Autodesk Green Building Studio (GBS) (Autodesk 2008; Autodesk 2009), IES Virtual Environment Viewer plug-in (IES VE plug-in) (v.5.8.2) and SketchUP/Open Studio (OS) plug-in (Google 2009; NREL 2009) were selected plus ‘raw’ DOE-2 (LBNL and Hirsch 2008; LBNL and Hirsch 2009) and Energy Plus (EP) (DOE 2009; DOE 2009). Reviewers suggested adding DOE-2 and EP to broaden the range of examined tools. First, to allow comparing tools that are capable of making overall energy analysis in the early design phase, versus tools capable of making detailed analysis in later design phases. Secondly, to allow comparing the sensible use of tools vis-à-vis the amount of knowledge required for and by each tool. Thirdly, to compare tools with developed graphical user interface (GUI) versus tools with text based user interface.
Due to the questionnaire’s density and length, reviewers recommended a shorter version. Questions regarding IIKB and IBDP were merged
into one question group. They also advised launching two surveys during different time periods to guarantee the maximum participation of respondents. The final step, prior to launching the survey, was to include reviewers’ feedback and conduct several modifications to the format and content the two final surveys.
Participants were recruited through email invitations to the mailing lists and forums of the ten above mentioned tools, in addition to the AIA Committee on the Environment (COTE),USGBC, 2030 Challenge, 2007 Solar Decathlon entry teams and the building performance simulation mailing lists (Bldg-SIM, Bldg-RATE, IBPSA-USA). Departments and schools of architectural engineering, environmental design and architecture in addition to students’ chapters, students’ blogs and architecture firms in the USA were approached including the winning offices of the Top Ten Green Architecture Award between 2005 and 2008.
Survey 1
The first survey was hosted at eSurveyPro.Com and was launched between mid December 2008 and mid February 2009 including 22 questions. An invitation letter was included within the email body with a link to the survey web link. The questionnaire’s home page clearly stated that the questionnaire purpose, focus group and duration (see Figure 03).
Fig. 03, Survey 1: (mid December 2008- mid February 2009)
As an incentive to complete all the survey questions the respondents were promised to receive the final survey summary report. The average duration for taking the survey was approximately 8 to 12 minutes. A welcome page explained the objective of the survey, informed participants of the approximate survey duration, and defined the expected target group. Including the above mentioned issues, the page listed the tools that will be inquired. The questionnaire was structured into three parts. The first part was screening the respondent’s background and experience with BPS tools. The second and third parts of the survey focused on the following key criteria:
(1) The usability and information management (UIM) of interface and (2) the integration of intelligent design knowledge-base (IIKB), including the (3) IBDP. The respondents were asked not only to judge the relevant importance of the above mentioned criteria, but also to share their experience by comparing longitudinally the
ten selected tools. An open question followed every part of the questionnaire in order to allow respondents to share their thoughts and comments. At the end of the survey respondents were invited to post their ideas about current limitations or improvements that should be avoided or integrated in the future development of BPS tools.
Survey 2
The second survey was launched between mid July 2009 and mid October 2009, including 16 questions. Both surveys were structured to include the same introduction entailing eight questions. The eight questions were addressing the respondent’s background and experience with BPS tools. The second and third part of the survey focused on the following key criteria: (3) Interoperability of Building Modelling (IBM), (4) Accuracy of tools and Ability to simulate Detailed and Complex and building Components (AADCC) as shown in Figure 04.
Figure 04: Survey 2: (mid July mid October 2009)
4. Analyzing Results:
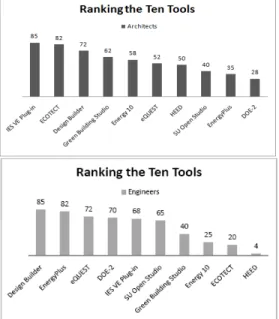
The first survey was closed after two months. The second survey was closed after three months to ensure a balanced participation compared to the first survey sample. The user’s responses were stored and results summaries were automatically generated. The first survey attracted over 800 interested visitors. However, the automatic report filtering generated only 481 eligible respondents. The second survey attracted over 750 interested visitors with 417 eligible respondents. Many respondents opted not to complete the survey till the end. The responses came from various IPs of users that answered the survey. IP responses from outside the USA and uncompleted responses were excluded. Questions 4.1-4.8 are representing the 8 introduction questions for both surveys. The results of both surveys are summarized below. Questions 4.9-4.11 are representing the UIM. Questions 4.12-4.14 are representing the IIKB and IBDP. Questions 4.15-4.17 are representing the AASDC. Questions 4.18-4.19 are representing the IBM. Then question 4.20 ranks the most important features of BPS from the point of view of architects and engineers. Finally, Figure 21 and 22 compiles the respondents’ choices and ranks the ten tools automatically according to the two different groups’ preference.
Thus, prior to analyzing the survey results it is very important to question the statistical significance of the survey. In fact, the
questionnaire is based on an open sample and therefore, the four respondents sample groups cannot be proven to be representative for the engineering or architecture community. However, the number of respondents of both surveys was quite reasonable to allow the identification of patterns and conduct cross-discipline analysis (Pilgrim, Bouchlaghem et al. 2003).
4.1 How do you describe your current position? This question allowed the respondents to choose from 12 available categories including architect, engineer, architecture or engineering designer, interns, educators, graduate student and) undergraduate student. Remarkably under the “Other” option a number of construction management professionals and students provided complete responses. However, in order to conduct the inter-group comparison between architects and engineers all categories were binned into two main groups. Participants that did not fall into any of the 12 categories were excluded. This step was necessary in order to detect any disciplinary difference between both tools users. Figure 05 shows the number of respondents grouped for each survey. The sample size of each group in both surveys was almost equal. Thus, we could say that on average the magnitude of each group is balanced which allows us to compare votes.
Figure 05: Number of respondents in both surveys 4.2 Which of the following affiliations apply to
you?
The second question revealed the participants’ affiliation. In the first survey, 18% of the architects were AIA accredited with almost the same proportion (17%) in the second survey. On the other hand, more than a quarter of engineers (27%) were ASHRAE Professional Engineers (PE) in the first survey, with a higher representation in the second survey (30%). Next, 21% of the first survey respondents and 19% of the second survey respondents were LEED accredited professional including architects and engineers. The summary report indicates the participation of 44 LEED AP architects in the first survey and 31 in the second survey. Surprisingly LEED AP engineers were more than architects. However, the encouraging finding here is that both groups are acknowledging LEED, as a common ground, and are seeking for professional accreditation.
Figure 06: Respondents’ affiliations and certifications. 4.3 What of the following energy simulation tools
do you use?
As seen in Figure 07, most architects have used ECOTECT. eQUEST, DB and IES plug-in were also commonly used among the architects samples. On the other hand, most engineers have used EP and eQUEST. DB, DOE-2 and IES plug-in came in the second category of usage. This question was not aiming to rank the tools. The aim was to get a snap shot of the current use of tools by architects and engineers. Notably, eQUEST, DB and IES plug-in were used by both groups. This match does not necessary demonstrate a preference of usage by each group it rather represents a potential for developing tools that suits and incorporates architects and engineers.
Figure 07: Used tools by architects and engineers 4.4 What CAD/3D modelling software do you
use?
Due to the advent of BIM and the frequent announcements of direct links between BIM drawing tools and BPS tools, engineers and architects have to identify the drawing they use frequently for geometric modelling. The objective of this question was to trace the mismatch between geometric and thermal modelling.
The majority of architects (36% and 40%), in both surveys, were using Google SketchUpTM for geometric modelling. The second most used software was AutoCAD with an agreement of 31% and 35% of the respondents of both surveys. Revit came in the third place being used by 21% and 15% of respondents of both surveys. ArchiCAD (10% and 7%) came at the last place. On the other hand, the majority (48% and 47%) of engineers were using AutoCAD followed by Revit (27% and 30%). In fact, the existing categories of this question did not offer enough choices for engineers. Under the “Other” option Revit MEP, DDS-CAD and Bentley Microstation products were numerously listed.
Figure 08: Geometric modelling tools used by both groups
Figure 08 indicates a remarkable difference between architects and engineers. Both groups use different tools for geometric modelling. Architects are more in favour of SketchUp while engineers are in favour of CAD applications. Therefore, finding a common geometrical modelling medium is still a challenge. Geometrical modelling should not only cater for the whole design team but also cover aspects of buildings performance (Mahdavi 1998).
4.5 How many tools do you use when performing simulations for a project?
As shown in figure 09, the number of tools used per project varies widely. The majority of architects use one tool per project (49% of first survey and 45% of the second survey). However, a large proportion (38% and 43%) uses two tools. Conversely the majority of engineers, 38% and 36% use at least two BPS tools per a project. In the first survey 29% confirmed the usage of only one tool and 10% confirmed the usage of three tools. In the second survey 30% confirmed the usage of three tools followed by 25% confirming the usage of only one tool per project.
There is merit among architects to use one simulation tools. Perhaps this due to that most architects use BPS tools less frequently and only during early design stages. On the other hands, building services engineers use tools during different design phases, are more acquainted with BPS tools and rely more on tools for thermal energy calculation, systems sizing and energy compliance issues. In fact, simulation tools for building services engineers are almost a mandatory instrument assumed to be a ‘sine-qua-non’ in the engineering practice (De Wilde and Prickett 2009).
Figure 09: Number of tools used per project 4.6 What is your primary building type you
model?
The majority of architects are running building simulations for residential buildings followed by office buildings and educational
buildings. For engineers, the most common building type is office building followed by educational buildings and retail buildings. Residential buildings came in the last place. Under the others option engineers listed other types namely, medical, laboratory and religious buildings.
The results in figure 10 indicate that most architects’ simulation experience is with residential buildings while engineers are larger buildings. In fact, this is a true reflection to what happens in practice. Most residential buildings are designed by architects who have no budget or time to hire a consultant and therefore rely on in-house experience. On the other side, large scale projects such as office, retail and educational buildings require simulation experts HVAC engineers and receive the attention and resources to be major player of the design team.
Figure 10: Different simulated building types by architects and engineers
4.7 For which design phase would you use the following programs?
In a follow up question, respondents were asked to justify the design phases for every tool they use. Figure 11 indicates the typical usage phases for the ten tools. There was no difference between architects and engineers classification and therefore all responses are binned in figure 11. HEED, Energy 10 and GBS were considered as early design tools that might be used during the pre-schematic design phases followed by ECOTECT and eQUEST which are classified to be used during the schematic design phase. DB, EP SU, EP and DOE-2 were considered as extensive tools that are used for detailed analysis during design development and design optimization phases.
Figure 11: Ranking the tools according to design phases
4.8 What are the parameters you focus on the most, when performing simulation?
This question reveals another contradiction between architects and engineers priorities. Both groups were asked to classify and rank 15 design parameters. There was an agreement from both groups that the energy consumption is the most
important parameter as shown in Figure 12. For architects, comfort, shading, passive solar heating, orientation and natural ventilation filled the rank from 2 to 6. The three least important parameters were efficient lighting, building tightness and controls. On the other hand, engineers ranked HVAC systems, controls, comfort, lazing and openings in the top five after the energy consumption. The three least important parameters were natural ventilation, daylighting and photovoltaic.
A common observation, that comfort was considered by both groups in the top of both lists. But surprisingly the largest difference was recorded for ranking Controls and HVAC systems. Engineers ranked them in the top of the list and architects suited them at the bottom despite prioritizing the energy consumption parameter. This question indicates a huge gap between both users’ preferences. Perhaps the separate building design practice among engineers and architects is the reason (Deru and Torcellini 2004). Architects are concerned with building design issues such as geometry, orientation, natural ventilation and daylighting while engineers are concerned with mechanical systems and controls.
Figure 12: Ranking the importance of output parameters
Part I - USABILITY and GRAPHICAL VISUALIZATION of the interface
4.9 Indicate how important you think each of the following objectives is, concerning usability and graphical visualization of the interface.
Ranking the sub criteria was identical for both disciplines. As shown in Figure 13, 23% of architects and 26% engineers agreed that the graphical representation of the output results is the most important feature concerning the usability and graphical visualization of the interface. Also there was consensus that the flexible use and navigation (17% architects and 22% engineers) is the second most important feature followed by the graphical representation of the results in 3D spatial analysis (16% architects and 17% engineers). Surprisingly, both groups agreed that the easy learnability and short learning curve of simulation tools is the least important feature. The result of this question
indicates the importance and urgency of representing the simulation results graphically in a way that can be clearly and easily interpreted. However, it is important to point to the risk of being seduced by the graphic output that impede the critical examination of outputs results (Donn, 2001 ).
Figure 13: Ranking criteria concerning usability and graphical visualization of BPS interfaces 4.10 . Indicate how important you feel each of the following objectives is, concerning information management of the interface.
Figure 14 compares the different preferences of both groups. Architects first priority (28%), concerning the information management of the interface, is the ability to create comparative reports for multiple alternatives. Quality control of simulation input comes in the second place with approximately 24% of the architects vote. However, it is very difficult here to draw conclusions because the last three features came very close comes in the number of votes representing 18% for allowing assumptions and default values to facilitate data entry, 16% for flexible data storage and user customizable feature and 14% for flexible data storage and user customizable feature. On the other hand, engineers’ first priority (39%) was the quality control of simulation input. Flexible data storage and user customizable features came on the second place with 20% of the engineers votes. The creation of comparative reports for multiple alternatives collected 18% of the votes and 16% for the ability to allow assumptions and default values to facilitate data entry.
This question revealed an important finding. Engineers clearly identified the quality control of simulation input as the most important feature concerning information management of the interface. This is not surprising because the issue of attaining quality insurance of simulation input is repeatedly highlighted in literature (Donn 2001; Augenbroe 2002; Pilgrim, Bouchlaghem et al. 2003; Hensen and Radošević 2004; Ibarra and Reinhart 2009; Tian, Love et al. 2009). However, architects prioritized the ability to create comparative reports for multiple alternatives above the input quality control. This means that the issue of assigning meaning and accurate input data is not a priority. An explanation to that might be that architects are more involved with BPS tools during early design tools and use the tools for decision making and design optimization. As mentioned by Donn {1987 #192}, precision is not so important to architects if all they are looking for is an answer to a ‘what-if’
question. Therefore, both groups’ choices are different due to the different design phase they work on and the different type of knowledge they require and process.
Figure 14: Ranking criteria concerning information management of BPS interfaces
4.11 . What other features should be improved in the future development of Building Energy Simulation Tools concerning friendliness, usability and information management of the Interface? (optional)
The last question for this part was an open ended question aiming to give participant the opportunity to share or clarify their opinions. The respondents reported a range of comments that were classified for each group as follows.
Architects’ comments include: • Regarding skill level of user
• Allowing debugging and need wizard like assists in data entry: ready examples, etc. • Defaults templates, but also front-and-center
delineation and ability to create/modify those templates
• Error-checking to ensure models are correct • Mismatch between the common form of
input/output in most tools and the architects expectations
• User friendly HVAC templates
• 3D visualization of design strategies, for e.g. daylighting
• Graphical representation of design parameters (use the language of architects)
• Easy searchable building inputs database • Balance between extensive (deep) and quickly
(basic) guaranteeing meaningful input data • Modify the floor plan after it is initially drawn,
ability to add/remove building features with ease, ability to make custom reports, ability to easily navigate all components with ease. Engineers’ comments include:
• Provide echo-print of input in a readable format • Mapping data entry trees and limiting access to
relevant paths to objectives
• Have a huge amount of customizability in terms of output. It would be great to be able to select output format, delimiters, etc, so that one could optimize output for input into any visualization package one wished with scripting capabilities • Transparent default options, no more black box,
more background information through links • The number of available input parameters in
almost certain that errors (some minor, some major) will exist.
• Convert SI to IP units and vice versa • Supporting database management
Part II - Integration of KNOWLEDGE-BASE
4.12 . Indicate how important you think each of the following objectives is, concerning Integration of Knowledge-Base
Figure 15 shows an agreement among architects and engineers. Both groups identified the ability to provide guidelines for buildings codes and rating systems compliance as the most important feature in BPS tools. The ability to provide case studies database for decision making came in second place. The result is not surprising and there is a common ground between both disciplines concerning the integration of knowledge-base.
Figure 15: Ranking criteria concerning the integration of Knowledge-base systems in BPS tools
4.13 . Indicate how important you feel each of the following objectives is, concerning Intelligent Knowledge-base and Design Process
As shown in Figure 16, architects top priority, concerning the integration of the intelligent knowledge-base and compatibility with design process, was the ability to provide quick energy analysis that supported their decision making (33%). The next priority was the ability to examine sensitivity and uncertainty of key design parameters (29%) followed by the ability to analyze weather characteristics and suggest suitable climatic design strategies (20%). The fourth and last criterion was the overall embracement of design during most design stages. However, engineers had a different order of priorities. The most important feature was the examination of sensitive analysis and uncertainty of key design parameters receiving 55% of the votes. The ability to provide quick energy analysis to support decision making came in second place with 23 % of the votes. The last two sub criteria had the same ranking like architects.
By observing Figure 16 we can find a contradictory finding. Architects are favouring the ability of to support the decision making while engineers are favouring the ability to examine the sensitivity and uncertainly of the design parameters. Despite that both questions seems to be different but a closer look to the wording and semantics reveals that they convey the same message. Architects chose the words ‘support decision making’ and ‘quick analysis’ while engineers chose the word ‘sensitivity and uncertainly’ and ‘design parameters’. In fact, both
criteria support the same thing, which is decision making, however, architects chose the general terms and engineers chose a specific issue. Perhaps most architects did not know what does sensitivity and uncertainly mean or perhaps engineers found the word ‘support the decision making’ too vague.
Another remark is related to the last sub criteria. The number of architects who chose the ability to embrace overall design during most design stages is three times the number of engineers. Despite that the total number of architects is 249 versus 232 engineers’ respondents, the comparison is still valid and a clear difference can be identified. This specific sub criterion is highlighting a very important issue that might be veiled behind the limitation of the question type and method. Architects are seeking tools that embrace the overall design during early and late design phases (Attia, Beltran et al. 2009).
Figure 16: Ranking criteria concerning knowledge-base systems and design process
4.14 . What other features should be improved in the future development of Building Energy Simulation Tools concerning Integration of Intelligent Design Knowledge-Base?
The last question for this part was an open ended question aiming to give participant the opportunity to share or clarify their opinions. The respondents reported a range of comments that were classified for each group as follows.
Architects’ comments include:
• Scenario/Alternatives based design approach • Define the most influential design parameters in
early design phases and their sensitivity range • Assisting decision making process through
guidance
• Cases of low-cost, ultra energy efficient buildings and LEED buildings
• Guidance and rules of thumb on passive design • Passive system – simulation , Simulation of
traditional passive design strategies and free-running buildings
• Guide users into sound building science designs the way the Passive House Standard training does.
• Assist decision on materials to be used in the design
• Conform to codes and rating systems • Large design components libraries e.g. double
façade, green roof


![HISTOIRE ET GÉOPOLITIQUE DES TERRITOIRES IRAKIENS [History and geopolitics of Iraqi territories]](data:image/gif;base64,R0lGODlhAQABAIAAAP///wAAACH5BAEAAAAALAAAAAABAAEAAAICRAEAOw==)