C 1s and N 1s core excitation of aniline: Experiment by electron impact and ab initio calculations
D. Duflot and J.-P. Flament
Laboratoire de Physique des Lasers, Atomes et Molécules (PhLAM), UMR CNRS 8523, Centre d’Études et de Recherches Lasers et Applications (CERLA, FR CNRS 2416), Université des Sciences et Technologies de Lille, F-59655 Villeneuve d’Ascq Cedex, France
A. Giuliani
DISCO Beamline, SOLEIL Synchrotron, BP 48, L’Orme des Merisiers, 91192 Gif-sur-Yvette Cedex, France and Cepia, Institut National de la Recherche Agronomique, BP 71627, 44316 Nantes Cedex 3, France
J. Heinesch, M. Grogna, and M.-J. Hubin-Franskin
Laboratoire de Spectroscopie d’Électrons diffusés, Université de Liège, Institut de Chimie B6c, B-4000 Liège 1, Belgium 共Received 20 January 2007; revised manuscript received 14 March 2007; published 30 May 2007兲
Core shell excitation spectra of aniline at the carbon and nitrogen 1s edges have been obtained by inner-shell electron energy-loss spectroscopy recorded under scattering conditions where electric dipolar conditions domi-nate, with higher resolution than in the previous studies. They are interpreted with the aid of ab initio configuration interaction calculations. The spectrum at the C 1s edge is dominated by an intense * band. The calculated chemical shift due to the different chemical environment at the carbon 1s edge calculated is in agreement with the experimental observations within a few tenths of an eV. The transition energies of the most intense bands in the C 1s excitation spectrum are discussed at different levels of calculations. In the nitrogen 1s excitation spectrum the most intense bands are due to Rydberg-valence transitions involving the *-type
molecular orbitals, in agreement with the experiment. This assignment is different from that of extended Hückel molecular orbital calculations. The geometries of the core excited states have been calculated and compared to their equivalent core molecules and benzene.
DOI:10.1103/PhysRevA.75.052719 PACS number共s兲: 32.80.Hd, 34.80.Gs
I. INTRODUCTION
One of the most important properties of aniline is to po-lymerize easily in polyaniline. This polymer is relatively easy to synthesize and can get, under specific conditions, interesting electric conducting properties关1兴. This is also in-volved for the synthesis of molecular systems having poten-tially large nonlinear optical responses关2兴.
The physicochemical properties of polyaniline are related at least partly to the molecular orbitals in the valence bands but also in the empty levels. In a general way these are expected at least for thin films to be predicted to be not too different from the individual molecule constituting the unit.
To our knowledge core excitation spectra of aniline have been reported by only two experimental studies previously, namely x-ray photoabsorption 关near-edge x-ray-absorption fine-structure共NEXAFS兲兴 of the condensed multilayer solid 关3–5兴 and inner-shell electron energy-loss spectroscopy 共ISEELS兲 of aniline in gas phase 关6兴. Calculations of the core excitation spectra have been reported using the extended Hückel molecular orbital共EHMO兲 method 关6兴, the multicon-figuration self-consistent-field共MCSCF兲 method for the car-bon first* transitions 关5兴, and the static exchange 共STEX兲
method关7,8兴. In Ref. 关7兴, the assignments of the main fea-tures of the spectra were briefly discussed, while in the later work, no detailed discussion was given.
In the present work the electronic structure of aniline, and much more specifically the unoccupied levels, have been in-vestigated by core shell excitation and ab initio calculations. Inner-shell electron energy-loss spectroscopy has been used to record the C 1s and N 1s excitation spectra of aniline. The experimental conditions—high electron impact energy and
quite small scattering angle—are such that electron energy-loss spectra are expected to exhibit the same features with quite similar relative intensities to those of the corresponding ones in photoabsorption.
The core excitation spectra have been measured for gas-eous aniline with higher energy resolution than in the previ-ous studies. Ab initio configuration interaction共CI兲 calcula-tions have been performed to assist in the spectral assignments and to discuss aspects of the unoccupied molecular-orbital electronic structure.
II. EXPERIMENTAL PART
The inner-shell electron energy-loss spectra were obtained with a Vacuum Science Workshop Ltd. spectrometer which has been adapted for gas studies and high-energy electron beams and has been equipped with a home-made position sensitive multidetector system in order to improve data col-lection times. The experimental apparatus and procedure have been described in detail previously关9–11兴.
Briefly the spectrometer consists of an electrostatic 180° monochromator operating in the constant pass energy mode, a collision chamber, and an electrostatic analyzer identical to the monochromator. The monochromatized incident elec-trons are accelerated up to 2 keV and focused into the colli-sion chamber using a four-element electron lens. The elec-trons are slightly deflected共0.02 radians兲 by two sets of X-Y plates inside the collision chamber. The scattered electrons are energy analyzed and focused onto the entrance slit of the analyzer by a lens similar to that used for acceleration.
In the collision conditions of quite low momentum trans-fer 共i.e., high incident energy and quite small scattering
angle兲, only electronic electric-dipolar transitions are ex-cited. Inside the vacuum vessel, a residual pressure of less than 1⫻10−8Torr is maintained by a cryogenic pumping
system. The electron gun and the analyzer regions are differ-entially pumped by turbomolecular pumps, respectively. The spectra have been recorded with 0.040- and 0.020-eV steps. In order to take into account valence and lower-energy inner-shell excitation cross section, a linear background has been subtracted from the raw spectra by extrapolating a least-square fit of the pre-edge experimental data points.
The absolute energy scale has been calibrated at both edges relative to CO and the C 1s→* 共
⬘
= 0兲 band at287.40± 0.02 eV 关12兴 recording the spectra with 0.01-eV steps and the mean value of 400.99± 0.09 eV between the N 1s→*共
⬘
= 0兲 at共400.88 eV and the N 1s→* 共⬘
= 1兲 at401.1 eV关12兴 recording the spectra with 0.02-eV steps. The sample has been provided by ACROS Organics with a stated purity better than 99.5%. It was used directly with-out further purification except for repetitive freeze-pump-thaw cycles in order to eliminate air and other volatile im-purities in the sample.
III. COMPUTATIONAL METHOD
Since the computational method used has been described in detail elsewhere关13兴, it will be briefly outlined. The start-ing hypothesis关14兴 is that, due to the important relaxation of the electronic density following the creation of the core hole, the molecular orbitals 共MOs兲 of the core ionized molecule are a better approximation for the description of the core excited states than the ground state MOs. Formally, the en-ergy of a given 1s→i*core excited state may be obtained by correcting the core ion energy in the following manner:
E共1s → i*兲 = E共1s → ⬁兲 + i*+ Pi*+ Ci*,
wherei*is the Hartree-Fock monoelectronic energy of the i* MO. E共1s→⬁兲 is the core ion energy, obtained using the ROHF-GVB method implemented in theGAMESS-US pack-age关15兴. The Pi* and Ci*terms represent the residual relax-ation and valence correlrelax-ation effects of the i* electron with
respect to the core ion, respectively. The relaxation term is taken into account by performing a configuration interaction 共CI兲 calculation in the monoexcitation space of the lowest-lying core states, obtained by a preliminary diagonalization of the full 1s→i* CI matrix. In order to evaluate the C
i*
term, the calculated CI wave functions serve as the zeroth-order space for a multireference MP2 calculation using the three-class diagrammatic CIPSI method 关16,17兴. To spare computational time, an extrapolation procedure关18兴 was em-ployed, using six thresholds between 97.0 and 99.5 % of the exact wave functions. Finally, the dipolar electric transition oscillator strengths with respect to the ground state of the molecule were computed, using the length gauge.
The Gaussian atomic orbitals 共AOs兲 used are the TZP basis set taken from Dunning关19兴. For the calculation of the core excited states, a set of Rydberg orbitals共5s,5p,2d兲 was added to the core excited atom basis set. The first exponents were taken from Dunning and Hay 关20兴 and the last ones
were determined in an “even-tempered” manner. In the fol-lowing, the basis set with diffuse functions will be named “ TZP+ R.” The theoretical width of the bands was set to the experimental resolution 共0.17 eV兲 and a Gaussian profile was used in the comparison of the calculations and the ex-periment.
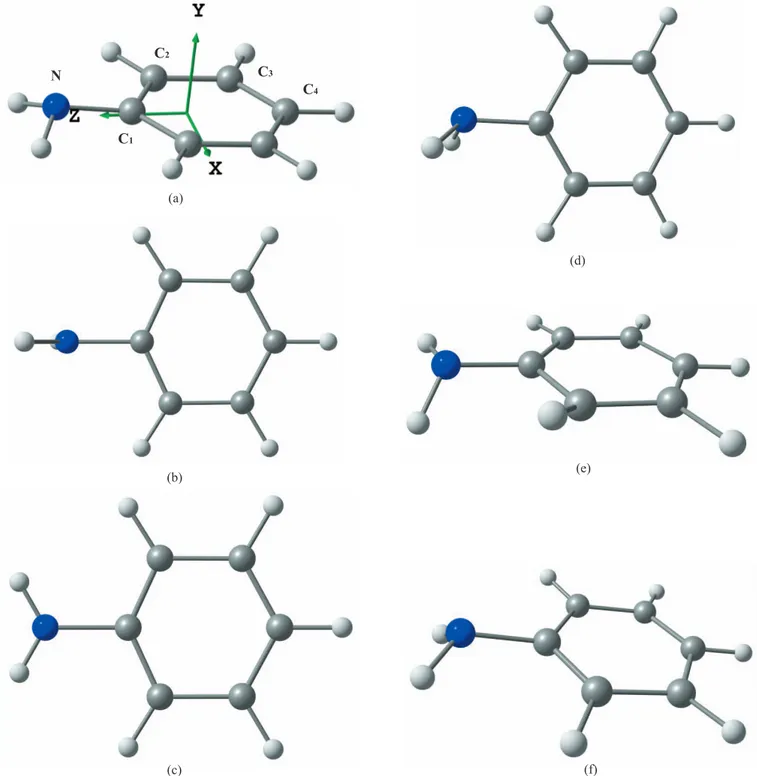
The aniline molecule contains four chemically nonequiva-lent carbons and one nitrogen atom共see Fig.1for labeling兲. For the calculation of the core ionized MOs at both edges, core hole localization was assumed and the coupling be-tween excitations from different core holes was neglected.
IV. RESULTS AND DISCUSSION
It is now well known that aniline is nonplanar in its ground electronic state关21,22兴, the amine group being pyra-midally distorted 关Fig. 1共a兲兴. The symmetry point group is therefore Cs, with the symmetry plane corresponding to the 共yz兲 plane using the frame of Fig.1共a兲. The energy difference between the planar关Fig.1共a兲兴 and nonplanar 关Fig.1共c兲兴 con-formations is rather small, with proposed values of 524.4 cm−1 关23兴, 454 cm−1关24兴, and 509.0 cm−1 关25兴. From
the theoretical point of view, this quantity is very sensitive to the basis set and method employed 关26,27兴. In the present work, the inversion barrier is calculated to be 388 cm−1 at the HF level and 710 cm−1 at the MP2 level.
In the present work, as in previous theoretical studies of core excited aniline 关5,6,8兴, the planar conformation was used. This geometry reduces the computational cost and al-lows calculating a larger number of states. Moreover, the high symmetry facilitates the assignment of the core states. The calculation of valence electronic spectrum for nonplanar and planar conformations关28兴 showed very small differences for the energies and intensities共Fig. 3 of 关28兴兲. Therefore for N and C4atoms, the calculations were performed in the C2v group of planar aniline. For C2and C3, because of assumed
core hole localization, the C2vsymmetry was reduced to Cs, but with the symmetry plane being the共xz兲 plane of Fig.1. Thus it should be kept in mind that the共xz兲 symmetry plane used for C2 and C3 is in fact perpendicular to the true 共yz兲
symmetry plane of the molecule, resulting in an inversion between A
⬘
and A⬙
irreducible representations.The use of C2vsymmetry also has some consequences on the allowed dipole electric transitions: the 1s共a1兲→*共a
2兲 or
nd共a2兲 transitions are forbidden while all transitions should be allowed in the nonplanar 共Cs兲 conformation. However, their intensities should be small when compared to other transitions.
The calculated HF electronic configuration of the neutral ground state of aniline for the planar molecule is
1a122a123a121b222b224a125a126a127a123b228a124b229a12 ⫻10a1
2
5b2211a1212a126b227b221b2113a128b222b121a223b12. The seven first MO’s共molecular orbitals兲 are the 1s orbit-als of the nitrogen atom and of the six carbon atoms. There are four occupied-type MO’s, namely the 1b1, 2b1, 1a2,
and 3b1. The 1b1 MO corresponds to the nitrogen lone pair, with C1 and C2 bonding character; the 2b1共1兲 MO has
C3-C4 bonding character, and antibonding with the N lone
pair; the 1a2共2兲 is essentially the共C2-C3兲 MO and finally,
the 3b1共3, HOMO兲 has C3-C4 and C1-C2 bonding
charac-ter, with C2-C3 and C1-N antibonding character. There are
three unoccupied * MO’s: 2a
2 共1*, lowest unoccupied
molecular orbital兲, 4b1 共2*兲, and 5b1 共3*兲 共see Fig. 8 of
Ref.关3兴兲.
The HF and MP2 optimized geometries of the ground state, obtained for both C2vand Cs conformations, are com-pared with previous experimental 关22兴 and theoretical 关29兴
works in the supplementary data of this paper关30兴 共see also 关27兴兲. The Cs MP2 results agree quite well with the experi-ment. The pyramidalization of the amine group is usually measured via the angle between the H-N-H bisector axis and the C1C4axis. Our calculated MP2value of 41.41° is
slightly larger than the earlier measures 共37.5° in 关22兴兲, partly due to the fact that in some previous studies, the N, C1, and C4atoms were supposed to be aligned. Other deter-minations are very close to our calculations: 42.17° in关23兴, 42° in关24兴, and 41.7° in 关25兴. N C1 C2 C3 C4 (a) (b) (c) (d) (e) (f)
FIG. 1. 共Color online兲 共a兲 Labeling of atoms in aniline and ground-state geometry. 共b兲–共f兲 Possible geometries for core ionized and excited states of aniline and their Z + 1 equivalent.
A. Core ionization energies
The calculated core ionization energies obtained at the ⌬MP2 and ⌬SCF levels are given in TableI and compared with the ⌬SCF results of Carravetta et al. 关8兴 and the XPS experimental values关31兴. Since in MP2 calculations, several possible definitions of the zero-order Hamiltonian for open-shell systems are possible 关32兴, the ⌬MP2 values of the present work were obtained using three different models: RMP关33,34兴, ZAPT 关35,36兴, and CIPSI. The two ⌬SCF are nearly identical because Carravetta et al. 关8兴 employed the same basis set as in the present work. While RMP and ZAPT methods are very similar, the CIPSI values are slightly dif-ferent. All results are within 0.5 eV of the experimental val-ues.
In order to test the influence of using a planar geometry on core energies, the calculations were done in both planar 共C2v兲 and nonplanar 共Cs兲 conformations. As shown in the EPAPS document关30兴, using the nonplanar geometry affects the core ionization energies by at most 0.18 eV, although the variation is different for each atom. For carbon atoms, the nonplanar absolute energy values are closer to experiment
than the planar results. The situation is reversed for nitrogen. Globally, for both geometries, chemical shifts are in good agreement with experiment, while most calculated absolute energies are too large by a few tenths of an eV. A similar trend will be found in the calculation of the core excitation spectra共see next sections兲. In order to remain consistent with the calculation of the core excited states, the CIPSI values obtained in the planar geometry will be used as a reference in the following.
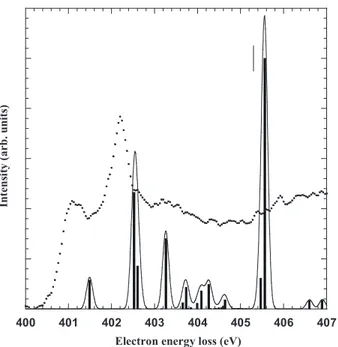
B. Nitrogen K-shell electron energy-loss spectrum The electron energy-loss spectrum measured experimen-tally at the N 1s edge is displayed in Fig. 2. The lowest energy bands are a little bit better resolved than in previous work关6兴 thanks to the higher resolution in the present study. The energies are given in TableIIand are in excellent agree-ment with those obtained by Turci et al.关6兴. Table IIgives also the assignments proposed by Turci et al.关6兴. The results of the calculations are given in TableIII. Only the transitions with intensities larger than 1.5% of the most intense band are shown, except for A2 transitions. As for the core ionization
TABLE I. Core ionization energies共eV兲 of aniline at the N 1s and C 1s edges.
⌬SCFa Shifta ⌬MP2 共CIPSI兲b Shiftb ⌬MP2 共ZAPT兲b Shiftb ⌬MP2 共RMP兲b
Shiftb ⌬SCFc Shiftc STEXd Shiftd Expt.e Shifte
C1 291.77 2.00 291.52 1.73 291.64 1.74 291.62 1.73 291.77 2.00 291.53 1.92 291.3 1.6 C2 289.94 0.17 289.99 0.20 290.11 0.21 290.09 0.20 289.96 0.19 289.77 0.16 289.9 0.2 C3 290.39 0.62 290.13 0.34 290.24 0.34 290.23 0.34 290.41 0.64 290.31 0.70 290.2 0.5 C4 289.77 0.00 289.79 0.00 289.90 0.00 289.89 0.00 289.77 0.00 289.61 0.00 289.7 0.0 N 405.30 405.47 405.60 405.59 405.30 405.41 405.3 a
This work. Gas phase values calculated at the TZP/RHF optimized geometry using the TZP+ Rydberg basis set.
bThis work. Gas phase values calculated at the TZP/MP2 optimized geometry using the TZP+ Rydberg basis set. c Reference关8兴. dReference关7兴. e Reference关31兴. In ten sit y (ar b.u nit s) 425 420 415 410 405 400
Electron energy loss (eV) F A C E B D 401 402 403 404 A B C D
FIG. 2. The electron energy-loss spectrum aniline recorded at the nitrogen K-edge with an en-ergy resolution of 0.17 eV, steps of 40 meV. Inset: lowest energy region recorded with 20-meV steps.
energy, the calculated values seem to be overestimated by a few tenths of an eV. This implies that the calculated term values共TV’s兲 should be in better agreement with experiment than the absolute energies. Therefore TV’s of TablesIIand IIIwill be used for the assignment of the spectrum.
The first band A is observed at 401.1 eV 共TV=4.2 eV兲 and is only partly resolved from the most intense one. It was assigned by Turci et al.关6兴 to the N 1s→3s transition.
Plash-kevych et al.关7兴 suggested p*共a
1兲 MO with s character. As
shown in Table III, the calculations confirm partially this assignment: the N 1s→3s/*共NH2兲 transition is
calcu-lated at 401.49 eV共TV=3.98 eV兲 but its rather large inten-sity is due to the important*共NH
2兲 valence character of the
3s Rydberg orbital.
The next band B is located at 402.2 eV共TV=3.1 eV兲 and was assigned to the N 1s→3p/*共NH
2兲 共2*, 4b1兲
transi-TABLE II. Experimental energy values 共eV兲 of the spectral bands in the N 1s excitation spectrum of aniline and previous proposed assignments.
Band E共eV兲a TV共eV兲b E共eV兲c TV共eV兲c Assignmentc
A 401.1 4.2 400.7 4.6 3s B 402.2 3.1 402.2 3.1 3p /*共NH 2兲 共2*, 4b1兲 C 402.72 2.58 D 403.24 2.06 404 1.3 *共NH 2兲 E 406.1 −0.8 F 407.6 −2.3 407.6 −2.3 *共CN兲 aThis work. b
This work using ionization energy of Ref.关31兴. cReference关6兴.
TABLE III. Calculated energies, term values共TV兲, relative intensities, and assignments of N 1s core excited states of aniline.
State E共eV兲 TV共eV兲 Intensitya Main configurationsb 具r2典
A1 401.49 3.98 0.114 0.97 N 1s→3s/*共NH 2兲 133 B2 402.53 2.94 0.465 0.97 N 1s→3p/*共NH2兲 144 A2 402.60 2.87 0.000c 0.45 N 1s→1*共2a 2兲 86 +0.43 N 1s→3d B1 402.61 2.86 0.171 0.54 N 1s→2*共4b 1兲 89 +0.24 N 1s→3p +0.11 N 1s→4p/2* B1 403.26 2.21 0.281 0.74 N 1s→3p 181 +0.17 N 1s→2*共4b 1兲 A1 403.66 1.81 0.024 0.95 N 1s→4s 309 B2 403.73 1.73 0.086 0.98 N 1s→3d/*共NH2兲 244 A2 403.98 1.49 0.000c 0.54 N 1s→3d 274 +0.43 N 1s→1*共2a 2兲 B1 403.99 1.47 0.023 0.96 N 1s→3d 275 B2 404.09 1.38 0.072 0.98 N 1s→4p/*共NH2兲 432 B1 404.26 1.21 0.098 0.77 N 1s→4p/2*共4b 1兲 524 A2 404.52 0.94 0.000c 0.90 N 1s→4d 589 B1 404.64 0.83 0.036 0.92 N 1s→5p 985 405.47 0.00 Ion A1 405.47 0.00 0.123 096 N 1s→*共NH 2兲 274 B2 405.56 −0.09 1.000d 0.96 N 1s→*共NH2兲 220 B1 406.60 −1.13 0.033 0.56 N 1s→3*共5b 1兲 110 B2 406.90 −1.43 0.034 0.80 N 1s→*共C3H兲 147 a
Relative intensity to the most intense band.
b
Main configuration of the CI wave function.
cDipole-electric forbidden transition. d
tion by Turci et al.关6兴 and to a p*共b
2兲 MO by Plashkevych
et al.关7兴. The present calculations of TableIIIshow a much more complex situation, since there are three transitions pre-dicted to have a TV around 2.9 eV. The most intense one, calculated at 402.53 eV共TV=2.94 eV兲, is due to the N 1s →3p/*共NH
2兲, i.e., an in-plane 3p with an important *共NH
2兲 valence character. The two other states are nearly
degenerate and correspond to transitions to the 1*共2a 2兲 and
2*共4b
1兲 MO’s. For both states, the CI wave functions
ap-pear to be a mixing between*and Rydberg MO’s共3dfor
1*and 3p/ 4pfor 2*兲. However, the low values of the 具r2典 parameters 共86 and 89 a.u.2兲 prove without ambiguity
the two transitions to have a valence character and corre-sponding to the 1* 共2a2兲 and 2* 共4b1兲 transitions. It
should also be noticed that if the nonplanar geometry had been used, the A2transition would have A
⬙
symmetry whilethe B1 transition would be A
⬘
. The A2 transition would then be allowed but its intensity should be weak. Experimentally, the/ nature of band B could be confirmed by measuring the near-edge x-ray-absorption fine-structure spectra of con-densed aniline at glancing and normal incidence关4兴, as done at the C 1s edge 关3兴, or by using the symmetry-resolved method of Shigemasa et al.关37兴.A shoulder C not well resolved on the high-energy side of the most intense band is observed at 402.72 eV共inset of Fig. 2, TableII兲, corresponding to a TV of 2.58 eV. According to the data of TableIV, it involves excitation to the 3p MO, calculated at 403.26 eV共TV=2.30 eV兲. While the 具r2典 value of 181 a.u.2 identifies this transition to be of Rydberg
char-acter, its unusually high intensity共28.1% of the most intense band兲 may be explained by a mixing with the N 1s→2*
共4b1兲 excitation.
The next band D has its maximum at 403.24 eV共TableII兲 with a TV of 2.06 eV and was assigned关6兴 to the transition to a*共NH2兲 state. For TV’s below 2 eV, the calculations of
TableIIIpredict a large number of transitions, most of them being pure Rydberg states with very low intensities. A few states have larger intensities, because of a mixed Rydberg-valence character of the transition: the N 1s →3d/*共NH
2兲 transition, calculated with a TV of
1.73 eV, could be responsible for the 403.24-eV feature. The N 1s→4p/*共NH2兲 and N 1s→4p/ 2* 共4b1兲
transi-tions are also rather intense and contribute to the intensity in this energy region.
At higher energies, the Rydberg transitions converge to the continuum onset corresponding to the ionization energy,
calculated at 405.47 eV. A simple way to test the accuracy of the calculated Rydberg transitions is to perform a quantum defect analysis using the well-known Rydberg formula:
E共1s → nᐉ兲 = E共1s → ⬁兲 − R 共n −␦ᐉ兲2,
where R is the Rydberg constant, n is the principal quantum number, and ␦ᐉ is the quantum defect. Table IVshows the results of a fitting procedure using the calculated values of TableIII. For s and p transitions, the fitted ionization poten-tial共IP’s兲, located between 405.38 and 405.45 eV, are close to the experimental value 关31兴 of 405.3 eV and consistent with the CIPSI value of 405.47 eV.
According to the calculations, the two N 1s→*共NH 2兲
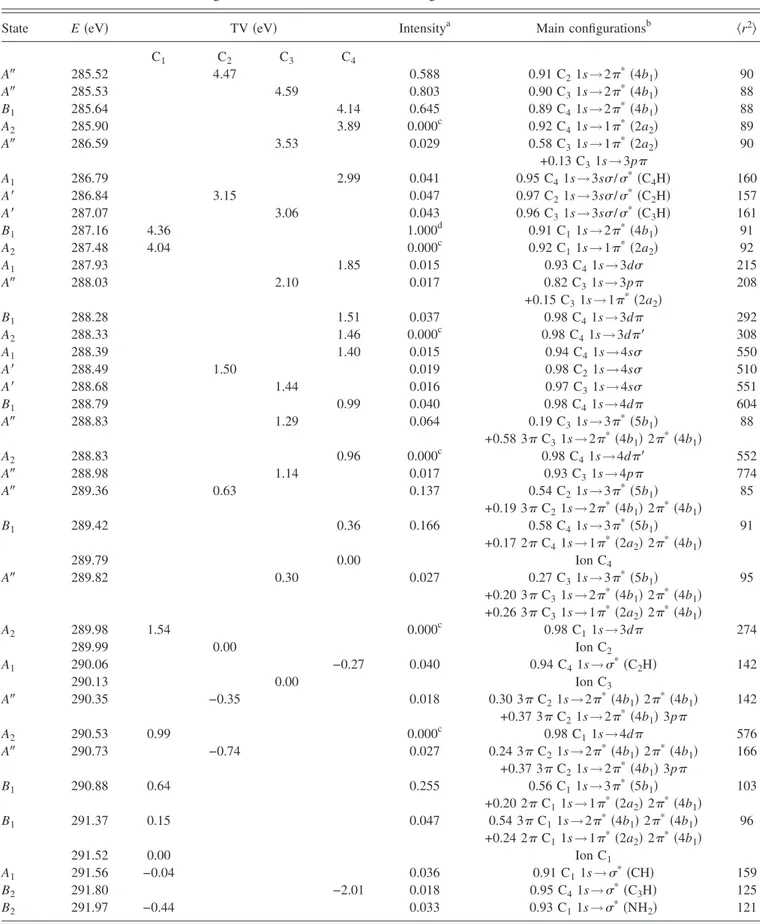
have TV’s close to zero and lie at the ionization continuum onset. One of these transitions共B2symmetry兲 has the largest intensity of the whole spectrum. It is highly probable that this proximity to the continuum induces a very short lifetime for these transitions. Consequently, the corresponding bands have probably large full width at half maximum 共FWHM兲 which might explain the flatness of the observed spectrum around 405 eV共Figs.2 and3兲.
The last two bands E and F can be seen in the experimental spectrum at higher energies 共Fig. 2兲 at 406.1 eV 共TV=−0.8 eV兲 and 407.6 eV 共TV=−2.3 eV兲. Above the ionization threshold, the present calculations may not be quantitatively accurate, since they do not take into account the coupling with the continuum states. According to TableIV, the E band could be due to the N 1s→3*and N
1s→*共C
3H兲 transitions. The N 1s→3* 共5b1兲 state is
strongly mixed with a large number of di-excitations and there is also a doubly excited state with small 3*character
calculated at 408.40 eV. A natural population analysis 关38兴 shows without ambiguity that the 406.60-eV transition is es-sentially monoelectronic. A similar mixing also occurs for the N 1s→*共C
3H兲 transition. For band F there is very
likely also a contribution from shape resonances, although this type of assignment has been questioned关39兴.
In Fig.3, the experimental spectrum is compared with the calculated one. It should be noticed that all calculated bands have been taken into account, including the low intensity transitions not shown in TableIV. There is good agreement between both sets of data, except from a slight overestima-tion 共⬃0.5 eV兲 of the calculated values, as already stated before. It should be noticed that the STEX results of Car-ravetta et al. 共Fig. 4 of Ref. 关8兴兲 were overestimated by
TABLE IV. Quantum defect analysis共energies in eV兲.
N C1 C2 C3 C4
␦ᐉ IP ␦ᐉ IP ␦ᐉ IP ␦ᐉ IP ␦ᐉ IP
ns共a1兲 1.14 405.42 ns共a1兲 0.84 291.41 ns共a⬘兲 0.97 290.12 ns共a⬘兲 0.94 290.25 ns共a1兲 0.83 289.69
np共a1兲 0.56 405.45 np共a1兲 0.60 291.47 np共a⬘兲 0.71 290.07 np共a⬘兲 0.70 290.21 np共a1兲 0.65 289.71 np共b2兲 0.84 405.45 np共b2兲 0.58 291.42 np共a⬘兲 0.68 290.14 np共a⬘兲 0.67 290.27 np共b2兲 0.48 289.66
np共b1兲 0.48 405.38 np共b1兲 0.32 291.40 np共a⬙兲 0.35 289.83 np共a⬙兲 0.43 290.07 np共b1兲 0.33 289.65
⬃1.2 eV with respect to the spectrum of Turci et al. 关6兴. This figure also shows that the 0.17-eV bandwidth used is too narrow to reproduce the observed spectrum, the most part of the broadness of the experimental bands being due to the short lifetimes of the excited species.
C. Carbon K-shell electron energy-loss spectrum The experimental excitation spectrum at the C 1s edge is presented in Fig.4. It is quite similar to that of Turci et al.
关6兴, some fine features being better resolved thanks to the higher resolution in the present study. The energy values of the observed spectral bands are given in Table V and are compared to previous studies on gaseous aniline but also on samples condensed on metallic substrates. The table also provides the assignments proposed previously for the gas phase spectra. In TableVIthe results of the calculations are given. Only the transitions with intensities larger than 1.5% of the most intense band are shown, except for A2transitions.
For the assignment of the spectrum, one has to keep in mind that the calculated values are probably slightly overestimated 共see Fig.5兲. Contrary to the nitrogen case, using TV values is more difficult, because of the four nonequivalent carbon at-oms.
The first band A, the most intense one, is observed at 285.29 eV 共Table V兲 and is assigned without ambiguity to the excitation of the 2*molecular orbital from C21s, C31s,
and C4 1s which are calculated to be nearly degenerate,
re-spectively, at 285.52, 285.53, and 285.64 eV as shown in TableVI. The largest intensity predicted is for C31s→2*.
These results are consistent with the experimental broadness of the spectral band 共Fig.4兲 which has a FWHM of about 0.9 eV. TableVIIcompares the present calculations to pre-vious theoretical studies. With the exception of the EHMO values of Turci et al.关6兴, which are underestimated by sev-eral eV, all results are slightly too high. TableVIIIconfirms that C21s→2*and C31s→2*transitions are almost
per-fectly degenerate, because they are less perturbed by the sub-stitution of a hydrogen atom by the amino group when going from benzene to aniline. On the other hand, the chemical shifts are more important for C4and of course for C1. They appear to be smaller than their equivalent in the core ions 共TableI兲.
The band B has its maximum of intensity at 286.69 eV and is highly asymmetric on the high-energy side with a not well resolved feature C at 286.88 eV as shown in the inset of Fig.4. Feature C is not mentioned by Turci et al., very likely
In te ns ity (arb. un its ) 400 401 402 403 404 405 406 407
Electron energy loss (eV)
FIG. 3. Comparison between the experimental and the theoreti-cal spectra for the pre-edge region at the nitrogen K-edge. The calculated results are convoluted by the experimental profile with 0.17 eV as the bandwidth at half maximum. The vertical lines show the measured ionization threshold.
In ten sit y (ar b.u nit s) 310 300 290 280
Electron energy loss (eV) A B D E F G H 292 290 288 286 A B C D E
FIG. 4. The electron energy-loss spectrum of aniline recorded at the carbon K-edge with an en-ergy resolution of 0.17 eV, steps of 40 meV. Inset: lowest energy region recorded with 20-meV steps.
being not resolved at all in their spectrum. The B band has been assigned to the C41s→2*共4b1兲 关6兴. The calculations
support this assignment, since the C1 1s→2*共4b1兲
transi-tion is predicted to occur at a slightly higher energy of 287.16 eV共Table VIII兲. This transition has also the highest intensity of all. The calculations also reveal the presence of many other transitions in this energy region. Some of them, being purely Rydberg, are not shown in TableVI. For C2, C3,
and C4, the transitions to the 3sMO are predicted at very
close energies共between 286.79 and 287.07 eV兲. Their rela-tively high intensity共about 4% of the most intense peak兲 is due to their *共CH兲 valence character. The corresponding transition C11s→3s/*共NH2兲 共not shown in TableVI兲 is
calculated at 288.48 eV but with a very small intensity 共0.3%兲. The four transitions have nearly identical TV’s, around 3 eV.
The calculated transitions to the 1*exhibit the same pat-terns as the 2*and 3s transitions for the four atoms: the C2, C3, and C4 transitions occur between 285.90 and
286.59 eV, while the C1 transition is calculated at
287.48 eV. There are, however, differences in the wave func-tions: for C1and C4, the wave function is purely 1*, while
for C2and C3, there is a mixing between 1* and 3pand
3d configurations. This mixing is due to the fact that C2
and C3were calculated in Cssymmetry while C2vsymmetry was used for C1and C4. It is also interesting to note that the C2and C3transitions have very weak intensities. This would
tend to confirm that the two A2transitions would have also
weak intensities in the nonplanar geometry.
The band D is observed with a maximum intensity at 289.11 eV. It presents fine features not well resolved on the low-energy side at 288.37 eV and on the high-energy side at 289.43 eV. It has been reported previously 关3,6兴 and as-signed to excitation of 3*共5b
1兲 or 3p MO’s 关6兴 or possibly *共CH兲 MO 关3兴 from C
2, C3, or C4 atoms. Plashkevych et
al.关7兴 noticed that the experimental TV would suggest a 4p rather than 3p transition in this region. The present
calcula-tions show that there are many n = 4 and 5 Rydberg transi-tions from C1, C2, and C3in this energy region. Most of them
have very low intensities and are not shown in Table VI. They contribute to the intensity on the low-energy side of the D band. In fact, according to the calculations, the D band appears to be due to the excitation to the 3*MO form C
2
and C4 and, to a lesser extent, from C3 in the low-energy side. As for N and C4, the wave functions appear to be a
mixing between 3* and valence 1s →* * di-excited configurations. Because of their 具r2典 value around 90 a.u.2,
they clearly have valence character. The configuration mix-ing might reflect the fact that the 3*virtual MO of the core
ion is not the best one to describe the core excitation, but it may also indicate the presence of a true high intensity shake-up state, as we have found recently in the N 1s K shell of s-triazine关40兴. This is especially true for C3, since there
are two states共calculated at 288.83 and 289.82 eV兲 with an important 3* character 共19 and 27 %兲 mixed with
di-excitations. In order to define the mono- or di-excited char-acter of this type of states, a natural orbital analysis关38兴 was performed. The resulting fractional occupation numbers show that for C2, C3, and C4, there are about 1.5 electrons in *MO’s, corresponding to an intermediate situation between
mono- and di-excited states. With a population of 1.8 elec-trons in*and about 0.9 electron removed from theMO’s, the second C33*state may be viewed as a “true” shake-up
state.
The next band E is located at 290.65 eV as shown in Fig. 4and is between the C2, C3, C4ionization threshold and the
C1one. Previously it has been assigned to 3*共5b1兲 关3,6兴 or *共CNH
2兲 关3,6,7兴 共TableV兲. The calculations predict an
in-tense transition at 290.88 eV involving the C11s→3*
tran-sition with an important共20%兲 2C11s→1*2*
charac-ter. According to the natural MO’s analysis, it may be considered as monoelectronic since there is 1.1 electron in * MO’s. There are also* and shake-up transitions in this
energy range but their intensities are low. The
quasidegener-TABLE V. Experimental energy values共eV兲 of the spectral bands in the C 1s excitation spectrum of aniline and previous proposed assignments.
Band E共eV兲a gas E共eV兲b gas E共eV兲c solid E共eV兲d solid Assignmentsb 共C-H兲 C1, C2, C3 共C-N兲 C4 A 285.29 285.2 285.4 285.4 2*共4b 1兲 B 286.69 286.7 286.9 286.8 2*共4b 1兲 C 286.88 D 289.11 289.0 288.7 3*共5b 1兲/3p 共290.2兲 E 290.65 290.5 290.6 3*共5b 1兲/*共CNH2兲 F 292.3 G 294.5 294.5 294.5 1* H 301 3.2 303± 1.0 2* a This work. b Reference关6兴. c Reference关3兴. d Reference关5兴.
TABLE VI. Calculated energies, TV’s, relative intensities, and assignments at the C 1s different core shell of aniline.
State E共eV兲 TV共eV兲 Intensitya Main configurationsb 具r2典
C1 C2 C3 C4 A⬙ 285.52 4.47 0.588 0.91 C21s→2*共4b1兲 90 A⬙ 285.53 4.59 0.803 0.90 C31s→2*共4b 1兲 88 B1 285.64 4.14 0.645 0.89 C41s→2*共4b1兲 88 A2 285.90 3.89 0.000c 0.92 C41s→1*共2a2兲 89 A⬙ 286.59 3.53 0.029 0.58 C31s→1*共2a 2兲 90 +0.13 C31s→3p A1 286.79 2.99 0.041 0.95 C41s→3s/*共C 4H兲 160 A⬘ 286.84 3.15 0.047 0.97 C21s→3s/*共C 2H兲 157 A⬘ 287.07 3.06 0.043 0.96 C31s→3s/*共C3H兲 161 B1 287.16 4.36 1.000d 0.91 C11s→2*共4b 1兲 91 A2 287.48 4.04 0.000c 0.92 C11s→1*共2a2兲 92 A1 287.93 1.85 0.015 0.93 C41s→3d 215 A⬙ 288.03 2.10 0.017 0.82 C31s→3p 208 +0.15 C31s→1*共2a2兲 B1 288.28 1.51 0.037 0.98 C41s→3d 292 A2 288.33 1.46 0.000c 0.98 C41s→3d⬘ 308 A1 288.39 1.40 0.015 0.94 C41s→4s 550 A⬘ 288.49 1.50 0.019 0.98 C21s→4s 510 A⬘ 288.68 1.44 0.016 0.97 C31s→4s 551 B1 288.79 0.99 0.040 0.98 C41s→4d 604 A⬙ 288.83 1.29 0.064 0.19 C31s→3*共5b 1兲 88 +0.58 3 C31s→2*共4b 1兲 2*共4b1兲 A2 288.83 0.96 0.000c 0.98 C41s→4d⬘ 552 A⬙ 288.98 1.14 0.017 0.93 C31s→4p 774 A⬙ 289.36 0.63 0.137 0.54 C21s→3*共5b1兲 85 +0.19 3 C21s→2*共4b1兲 2*共4b1兲 B1 289.42 0.36 0.166 0.58 C41s→3*共5b 1兲 91 +0.17 2 C41s→1*共2a2兲 2*共4b1兲 289.79 0.00 Ion C4 A⬙ 289.82 0.30 0.027 0.27 C31s→3*共5b 1兲 95 +0.20 3 C31s→2*共4b1兲 2*共4b1兲 +0.26 3 C31s→1*共2a 2兲 2*共4b1兲 A2 289.98 1.54 0.000c 0.98 C11s→3d 274 289.99 0.00 Ion C2 A1 290.06 −0.27 0.040 0.94 C41s→*共C 2H兲 142 290.13 0.00 Ion C3 A⬙ 290.35 −0.35 0.018 0.30 3 C21s→2*共4b1兲 2*共4b1兲 142 +0.37 3 C21s→2*共4b 1兲 3p A2 290.53 0.99 0.000c 0.98 C11s→4d 576 A⬙ 290.73 −0.74 0.027 0.24 3 C21s→2*共4b1兲 2*共4b1兲 166 +0.37 3 C21s→2*共4b 1兲 3p B1 290.88 0.64 0.255 0.56 C11s→3*共5b1兲 103 +0.20 2 C11s→1*共2a 2兲 2*共4b1兲 B1 291.37 0.15 0.047 0.54 3 C11s→2*共4b 1兲 2*共4b1兲 96 +0.24 2 C11s→1*共2a2兲 2*共4b1兲 291.52 0.00 Ion C1 A1 291.56 −0.04 0.036 0.91 C11s→*共CH兲 159 B2 291.80 −2.01 0.018 0.95 C41s→*共C3H兲 125 B2 291.97 −0.44 0.033 0.93 C11s→*共NH 2兲 121 a
Relative intensity to the most intense band.
b
Main configuration of the CI wave function.
c
Dipole-electric forbidden transition.
d
ate continuum onsets are probably responsible for the large width of this band.
The F feature at 292.3 eV appears as a shoulder on band G. It is above the C1 ionization threshold. In this energy region there are several bands with rather small intensities predicted by the calculations, involving * and shake-up
transitions. At higher energy as shown in Fig.4there are two broad bands with maximum of intensity at 294.5 and 301 eV also reported previously and assigned to* type excitation 共TableV兲. They are tentatively assigned to shape resonances 关39兴.
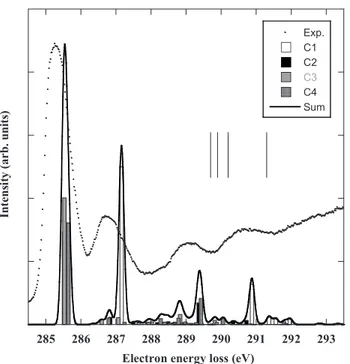
As shown in Table IV, it is also possible to perform a quantum defect analysis on the Rydberg states of the four carbon atoms. For s and p transitions, all atoms give very similar␦ᐉvalues and the fitted ionization potentials are con-sistent with the calculated CIPSI value. Finally, Fig.5 com-pares the experimental spectrum with the calculated bands. The upper spectrum shows the contributions of all carbon
atoms to the spectrum, the result of the calculations being fitted with 0.17-eV FWHM Gaussians. It should be noticed that all calculated bands have been taken into account, in-cluding the low intensity transitions not shown in TableVI. There is an excellent agreement for the relative intensities and the calculated energies seem to be slightly overestimated by a few tenths of an eV. In the STEX calculations of Plash-kevych et al.关Fig. 7共a兲 of 关7兴兴, the calculated spectrum was shifted by 1.52 eV to match the experiment of Turci et al. 关6兴.
D. Geometry of core excited aniline
Due to variational collapse of the wave function, geom-etry optimization of the core states of polyatomic molecules is a difficult task 关41–43兴, especially at the multiconfigura-tional level. In the case of benzene, Norman and Ågren关44兴 optimized the geometry of the core ion, the C 1s→1* 共1e2u兲 core state, and its equivalent core 共Z+1兲 关45兴, using a
double-dzeta quality basis state and an active space limited to MO’s. It was shown that these three states remained planar, in contradiction with early suggestions of a pyrami-dalized structure关46兴. On the whole, the equivalent core ap-proximation geometry and frequencies were very close to the true core results, except for the lowest frequencies 共“soft” modes兲.
In the case of aniline, it is interesting to study how the substitution of a NH2 group in benzene could affect the
ge-ometry of the core excited molecule. These calculations were performed with theGAMESS-USprogram at the ROHF-GVB level关47兴, using the TZP+R basis set. The nature 共minima or saddle points兲 of the structures was determined by calculat-ing analytically the harmonic frequencies at the same level. The various geometries obtained can be classified in six main types, displayed in Figs.1共a兲–1共f兲. The results of the calcu-lations are summarized in Table VIII, while the detailed structural parameters are provided in the supplementary data of this paper 关30兴. Briefly, the changes in bond lengths are consistent with the findings of Norman and Ågren 关44兴 for benzene: the core excited C-H length is shortened to a value close to a N-H bond 共about 1.0 Å兲. Similarly, the core ex-cited N-H bond is shortened to the typical O-H value共about 0.96 Å兲. When the 1s electron is excited to a Rydberg MO with*共C-H兲 valence character, this shortening is
counter-balanced by a slight increase of the bond length. Bond angles
TABLE VII. Transition energies of the most intense bands in carbon 1s excitation spectrum at different levels of theory.
CIPSIa Shifta STEXb Shiftb ⌬SCFb Shiftb Shiftc EHMOd Shiftd Expt.a Shifta
C1 287.16 1.63 287.23 1.45 287.69 1.46 1.15 282.1 1.15 286.61 1.32 C2 285.52 −0.01 285.68 0.09 286.31 0.08 0.03 281.0 0.03 ⬇0.0 C3 285.53 0.00 285.78 0.00 286.23 0.00 0.00 280.8 0.00 285.29 0.0 C4 285.64 0.11 285.89 0.11 286.51 0.28 0.29 281.2 0.40 ⬇0.0 a This work. b Reference关8兴.
cMCSCF values from Ref.关5兴. d Reference关6兴. 285 286 287 288 289 290 291 292 293 Exp. C1 C2 C3 C4 Sum
Electron energy loss (eV)
In tens it y (a rb .u ni ts)
FIG. 5. Comparison between the experimental and the theoreti-cal spectra at the carbon K-edge. The theoreti-calculated results are convo-luted by the experimental profile with 0.17 eV as the bandwidth at half maximum and compared to the experimental spectrum. The vertical lines show the measured ionization thresholds.
generally remain close to 120°. These trends are also valid for the Z + 1 molecules.
However, as indicated in TableVIII, it appears that most core states do not have the geometry of the ground state关Fig. 1共a兲兴. Core ions are either planar 关C1, C4, Fig. 1共c兲兴 or the
amino group is rotated by 90° from the ring plane关C2, C4,
Fig.1共c兲兴. For N, there is a discrepancy between the core ion predicted to have the geometry of Fig.1共b兲, while the Z + 1 approximation predicts the geometry shown in Fig. 1共d兲. Since the rotation of the NH2 group has the lowest
fre-quency, these results confirm the prediction of Norman and Ågren关44兴.
For core excited aniline, it was possible to optimize at least two states for each carbon atom. For C4, which is the
farthest from the amino group, and thus similar to benzene, the C41s→1* 共2a
2兲 core state keeps the geometry of the
ground state, while the C41s→2*共4b
1兲 state is planar. On
the other hand, for C2 and C4, the same transition leads to a pyramidalized structure 关Figs. 1共e兲 and 1共f兲兴. For C1, the
lowest transition is the*共3b1兲 and corresponds to Fig.1共d兲
but with the C1-N bond slightly out of the ring plane. Most
of the Rydberg-*共CH兲 states are planar. For carbons, there
is a perfect agreement between core states and their Z + 1 equivalent.
For nitrogen, the N 1s→3s/*共NH2兲 has the geometry
of Fig.1共d兲, while the two 3p states have the 90° rotated structure of Fig.1共b兲. The N 1s→1*共2a
2兲 state could not
be found 共the planar form had three imaginary frequencies and the nonplanar structures correspond to other transitions兲
but has probably the Fig.1共d兲geometry. As for the core ion, there are some discrepancies between the core states and their Z + 1 equivalent concerning the nature of the calculated structures. These discrepancies, which are due to the valence to core penetration neglected in the Z + 1 approximation关43兴, would be more important for nitrogen than for carbon, lead-ing to different geometries. Geometry optimizations on spe-cies containing both carbon and oxygen atoms 关48兴 show similar trends, while for cyclopropane, the Z + 1 structures and energies were found to be very close to the core states 关43兴.
V. CONCLUSIONS
The C 1s and N 1s electron energy-loss spectra have been recorded by electron impact under electric dipole interaction conditions and with higher resolution than previously. Ac-companying ab initio configuration interaction calculations have been performed in order to propose quite reliable as-signments.
The transitions to the lowest energy unoccupied MO’s of *type from the carbon atoms C
2, C3, C4are nearly
degen-erate. They are separated by about 1.6 eV from the C1 1s →2*. This suggests that the carbon atoms C
2, C3, and C4
have roughly the same chemical environment and that of C1
is about 1.6 eV different and shifting the spectral bands at higher energy. At the N 1s edge the most intense transitions are due to the strong Rydberg-valence states, involving the *-type unoccupied molecular orbitals.
TABLE VIII. Core ionized and excited states of aniline and Z + 1 equivalent molecules.
Core Z + 1
State Figure nia State Figure nia
Ion C1 2A⬘ 1共d兲 0 1A⬘ 1共d兲 0 Ion C2 2A⬘ 1共c兲 0 1A⬘ 1共c兲 0 Ion C3 2A 1共d兲 0 1A 1共d兲 0 Ion C4 2A1 1共c兲 0 1A1 1共c兲 0 Ion N 2A1 1共b兲 0 1A⬘ 1共d兲 0 C11s→3s/*共NH 2兲 1A⬘ 1共d兲 0 2A⬘ 1共d兲 0 C11s→2*共4b1兲 1A 1共d兲b 0 2A 1共d兲b 0 C21s→3s/*共C 2H兲 1A⬘ 1共c兲 0 2A⬘ 1共c兲 0
C21s→1*共2a2兲 1A 1共e兲 0 2A 1共e兲 0
C31s→3s/*共C 3H兲 1A⬘ 1共c兲 1 2A⬘ 1共c兲 1 C31s→1*共2a2兲 1A 1共f兲 0 2A 1共f兲 0 C41s→2*共4b1兲 1B1 1共c兲 0 2B1 1共c兲 0 C41s→3p/*共CH兲 1B 2 1共c兲 0 2B 2 1共c兲 0 C41s→3s/*共C4H兲 1A1 1共c兲 0 2A1 1共c兲 0 C41s→1*共2a 2兲 1A⬙ 1共a兲 0 2A⬙ 1共a兲 0 N 1s→3s/*共NH 2兲 1A⬘ 1共d兲 0 2A⬘ 1共d兲 0 N 1s→3p 1B2 1共b兲 0 2A⬙ 1共d兲 0 N 1s→3p/*共NH2兲 1B1 1共b兲 0 2 B1 1共b兲 1 N 1s→1*共2a 2兲 1A2 1共b兲 2 2A 2 1共b兲 1
aNumber of imaginary frequencies. b
Some discrepancies between the N 1s excited core states and their Z + 1 equivalent concerning the nature of their equi-librium geometries are observed. It is not the case for the carbons for which there is an excellent agreement between core states and their Z + 1 equivalent. These differences, be-ing due to the valence to core penetration neglected in the Z + 1 approximation, seem to be more important for nitrogen than for carbon.
ACKNOWLEDGMENTS
The Laboratoire de Physique des Lasers, Atomes et Molé-cules共PhLAM兲 is Unité Mixte de Recherche du CNRS. The
Centre d’Études et de Recherches Lasers et Applications 共CERLA, FR CNRS 2416兲 is supported by the Ministère chargé de la Recherche, the Région Nord/Pas-de-Calais, and the Fonds Européen de Développement Économique des Ré-gions 共FEDER兲. Parts of the computations were carried out at the CRI 共Centre de Ressources Informatiques兲, on the IBM-SP computer that is supported by the Programme de Calcul Intensif et Parallèle of the Ministère chargé de la Re-cherche, the Région Nord/Pas-de-Calais, and the FEDER. This research has been supported by the Fonds National de la Recherche Scientifique and the Patrimoine of University of Liège. The support of the COST action P9 “Radiation Dam-age in Biomolecular Systems” is also acknowledged.
关1兴 M. Magnuson et al., J. Chem. Phys. 111, 4756 共1999兲. 关2兴 N. E. Agbor et al., Sens. Actuators B 41, 137 共1997兲. 关3兴 J. L. Solomon, R. J. Madix, and J. Stohr, Surf. Sci. 255, 12
共1991兲.
关4兴 J. Stöhr, NEXAFS Spectroscopy 共Springer-Verlag, Berlin, 1992兲.
关5兴 Y. Luo et al., Phys. Rev. A 52, 3730 共1995兲.
关6兴 C. C. Turci, S. G. Urquhart, and A. P. Hitchcock, Can. J. Chem. 74, 851共1996兲.
关7兴 O. Plashkevych et al., Chem. Phys. 222, 125 共1997兲. 关8兴 V. Carravetta, O. Plashkevych, and H. Ågren, Chem. Phys.
263, 231共2001兲.
关9兴 C. Hannay et al., Meas. Sci. Technol. 6, 1140 共1995兲. 关10兴 M.-J. Hubin-Franskin et al., J. Chem. Phys. 106, 35 共1997兲. 关11兴 M.-J. Hubin-Franskin and J. Heinesch, Nucl. Instrum. Methods
Phys. Res. A 477, 546共2002兲.
关12兴 R. N. S. Sodhi and C. E. Brion, J. Electron Spectrosc. Relat. Phenom. 34, 363共1984兲.
关13兴 D. Duflot et al., J. Chem. Phys. 118, 1137 共2003兲.
关14兴 S. Bodeur, P. Millié, and I. Nenner, Phys. Rev. A 41, 252 共1990兲.
关15兴 M. W. Schmidt et al., J. Comput. Chem. 14, 1347 共1993兲. 关16兴 B. Huron, J. P. Malrieu, and P. Rancurel, J. Chem. Phys. 58,
5745共1973兲.
关17兴 R. Cimiraglia, J. Chem. Phys. 83, 1746 共1985兲. 关18兴 C. Angeli et al., Theor. Chem. Acc. 98, 57 共1997兲. 关19兴 T. H. Dunning, Jr., J. Chem. Phys. 55, 716 共1971兲.
关20兴 T. H. Dunning, Jr. and P. J. Hay, in Methods of Electronic Structure Theory, edited by H. F. Schaefer III共Plenum Press, New York, 1977兲, Vol. 3, p. 1.
关21兴 D. G. Lister and J. K. Tyler, Chem. Commun. 共London兲 6, 152 共1966兲.
关22兴 D. G. Lister et al., J. Mol. Struct. 23, 253 共1974兲.
关23兴 N. W. Larsen, E. L. Hansen, and F. M. Nicolaisen, Chem. Phys. Lett. 43, 584共1976兲.
关24兴 M. Quack and M. Stockburger, J. Mol. Spectrosc. 43, 87 共1972兲.
关25兴 J. Pyka and M. Kreglewski, J. Mol. Spectrosc. 109, 207
共1985兲.
关26兴 O. Bludský et al., J. Chem. Phys. 105, 11042 共1996兲. 关27兴 M. Alcolea Palafox, J. L. Nunez, and M. Gil, J. Mol. Struct.:
THEOCHEM 593, 101共2002兲.
关28兴 Y. Honda et al., J. Chem. Phys. 117, 2045 共2002兲.
关29兴 P. M. Wojciechowski, W. Zierkiewicz, and D. Michalska, J. Chem. Phys. 118, 10900共2003兲.
关30兴 See EPAPS Document No. E-PLRAAN-75-069704 for de-tailed structural and energy information on the ground, core ion, and core excited states of aniline. For more information on EPAPS, see http://www.aip.org/pubservs/epaps.html
关31兴 T. Ohta, T. Fujikawa, and H. Kuroda, Bull. Chem. Soc. Jpn.
48, 2017共1975兲.
关32兴 T. D. Crawford, H. F. Schaefer III, and T. J. Lee, J. Chem. Phys. 105, 1060共1996兲.
关33兴 P. J. Knowles et al., Chem. Phys. Lett. 186, 130 共1991兲. 关34兴 W. J. Lauderdale et al. Chem. Phys. Lett. 187, 21 共1991兲. 关35兴 T. J. Lee et al. J. Chem. Phys. 100, 7400 共1994兲.
关36兴 T. J. Lee and D. Jayatilaka, Chem. Phys. Lett. 201, 1 共1993兲. 关37兴 E. Shigemasa et al., Phys. Rev. A 66, 022508 共2002兲. 关38兴 P.-O. Löwdin, Phys. Rev. 97, 1474 共1955兲.
关39兴 M. N. Piancastelli, J. Electron Spectrosc. Relat. Phenom. 100, 167共1999兲.
关40兴 D. Duflot et al., Eur. Phys. J. D 35, 239 共2005兲.
关41兴 S. Shirai, S. Yamamoto, and S.-a. Hyodo, J. Chem. Phys. 121, 7586共2004兲.
关42兴 A. B. Trofimov et al., J. Chem. Phys. 113, 6716 共2000兲. 关43兴 D. Duflot, S. Zeggari, and J.-P. Flament, Chem. Phys. 327,
518共2006兲.
关44兴 P. Norman and H. Ågren, J. Mol. Struct.: THEOCHEM 401, 107共1997兲.
关45兴 W. L. Jolly and D. N. Hendrickson, J. Am. Chem. Soc. 92, 1863共1970兲.
关46兴 Y. Ma et al., Phys. Rev. Lett. 63, 2044 共1989兲.
关47兴 G. Chaban, M. W. Schmidt, and M. S. Gordon, Theor. Chem. Acc. 97, 88共1997兲.