5706
Estimation of Better Parent and Economic Heterosis
for Yield and Associated Traits in Common Beans
Mulugeta Atnaf Tiruneh1,*, Hussein Mohammed Ali2, and Habtamu Zelleke3
1Ethiopian Institute of Agricultural Research, Pawe Research Center, P. O. BOX 25, Ethiopia 2Hawassa University, College of Agriculture, P.O.BOX 05, Hawassa, Ethiopia
3Haramaya University, College of Agriculture, P.O.BOX 138, Dire Dawa, Ethiopia
*Corresponding author: [email protected]; cell phone +251 919 157054; fax +251 585 500272 Original submitted in on 19th July 2013 Published online at www.m.elewa.org on 30th November 2013. ABSTRACT
Objective: A study to estimate better parent and economic heterosis in an 8x8 diallel crosses of common beans (Phaseolus Vulgaris L.) was undertaken at Mandura, North Western Ethiopia.
Methodology and Results: Eight parents and their 28 F1 diallel crosses were grown in a randomized complete
block design. Yield and its components, architectural, and phenological traits were considered. Statistically significant differences were observed between the 36 genotypes for most of the traits studied. Analysis of better parent and economic heterosis respectively revealed 16 and 14 crosses out of 28 showed significant heterosis for yield per plant. Among which 12 and 7 crosses in the same order were positive. The extent of better parent heterosis for yield ranged from -31.14% (Dimtu x Tabor) to 114.1% (MAM-41 x Tabor). The maximum economic heterosis (60.58 %) was observed from the hybrid MAM-41 x Tabor .Significant (P<0.05 or P<0.01) better parent heterosis was also observed for yield-associated traits.
Conclusions and recommendation: In this study, expression of significant better parent heterosis for grain yield and other important traits was frequent in combinations of parents from different growth habits (MAM-41 x Tabor, Roba-1 x SK 93263), seed color (Tabor x Red wolayta, BELDAKMI RR 5 x SK 93263, Dimtu x Zebra), and seed size (Roba-1 x Tabor). The extent of percent better parent and economic heterosis like in the cross MAM-41 x Tabor with 114.103 % seed yield better parent heterosis and 60.6 % economic heterosis suggested that this hybrid could be further considered in the breeding program aiming both for segregant breeding and hybrid development.
Key Words: Better parent heterosis, diallel, economic heterosis, Phaseolus vulgaris L. INTRODUCTION
Common beans (Phaseolus Vulgaris L.) are an important legume crop for direct food consumption and market transactions in the regions of Eastern, Central, and Southern Africa. They are recognized as the second most important source of human dietary protein and the third most important source of calorie of all the agricultural commodities produced in the region (Schoonhoven & Voysest,
1991; Kemani, 1999). The crop is mainly cultivated by small holders and being used as an inexpensive source of protein and an important source of cash, (Pachico, 1993; CIAT, 1995). Despite the role beans are playing, its productivity is quite low in this region. For example, the national average in Ethiopia is 0.9 tons per hectare (Negash, 2007). It is constrained by several biotic and abiotic factors (Katungi et al.,
Journal of Applied Biosciences 71:5706– 5714
5707 2010). Any breeding strategy aiming to develop improved varieties with required merits in productivity, market preference, and nutrition should target those major constraints. The success of common bean breeding programs is intimately related to the appropriate choice of divergent parents which, when crossed, must provide wide genetic variability to be used for selection. Diallel analysis provides a systematic approach for the detection of appropriate parents and crosses as it allows estimation of different genetic parameters including the expression of heterosis in early generations. Greater bean grain yield could be obtained by hybridizing superior cultivars.
Heterosis, which is the superiority in performance (increased vigour, size, fruitfulness, speed of development, resistance to pests, or to climatic rigors of any kind) of hybrid individuals compared with their parents (Shull, 1952) has been reported for a wide range of crop species including both self and cross-pollinated crops. Expression of heterosis for various agronomical characters in beans has been determined by several investigators. It was
confirmed in various studies that genetic divergence plays a significant role in the expression of heterosis. In a nine-parent diallel cross of common beans carried out at Centro International de Agricultura Tropical head quarter (CIAT, 1984), better parent yield heterosis was as high as 35.9%, and an increasing heterotic value was noted in crosses between parents of increasingly divergent growth habit. Nienhuis and Singh (1983) tested F1 hybrids of
bush beans (Phaseolus vulgaris L.) and found significant better parent yield heterosis in 17 of the 36 families. In another study involving bean lines of different growth habits, Nienhuis and Singh (1986) reported, significant better parent yield heterosis and it was as high as 29.5 percent.
The present study was executed to estimate the level of percent better parent heterosis and economic heterosis among diallel cross F1 hybrids of
eight common bean varieties. This information would be useful to investigate the performance and relationship of F1 hybrids and parents and to select suitable parents and population for designing an effective breeding programme.
MATERIALS AND METHODS
The study was conducted at Mandura, Northwestern Ethiopia in 2006. Eight parents and their 28 F1 diallel crosses were studied in two replicates of randomized complete block design. Diallel crosses were made by hand at Melkassa Agricultural Research Center in the central rift valley of Ethiopia during the dry season (March
to June, 2005) under furrow irrigation and during the rainy season (July to September, 2005) to ensure enough F1 seed for planting. The parents were from different heterotic groups based on seed color, shape and size, and growth habit, Table 1.
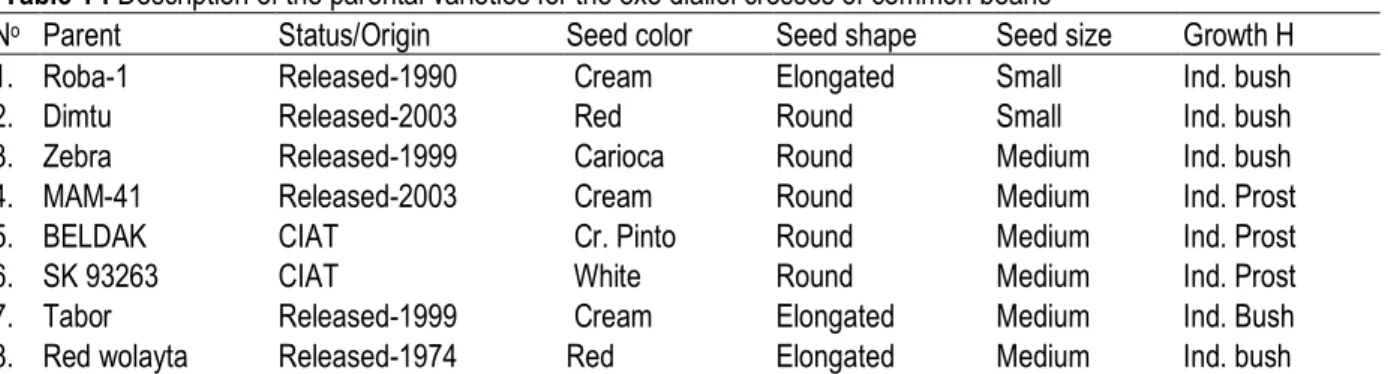
Table 1 : Description of the parental varieties for the 8x8 diallel crosses of common beans
No Parent Status/Origin Seed color Seed shape Seed size Growth H
1. Roba-1 Released-1990 Cream Elongated Small Ind. bush
2. Dimtu Released-2003 Red Round Small Ind. bush
3. Zebra Released-1999 Carioca Round Medium Ind. bush
4. MAM-41 Released-2003 Cream Round Medium Ind. Prost
5. BELDAK CIAT Cr. Pinto Round Medium Ind. Prost
6. SK 93263 CIAT White Round Medium Ind. Prost
7. Tabor Released-1999 Cream Elongated Medium Ind. Bush
8. Red wolayta Released-1974 Red Elongated Medium Ind. bush
Cr. pinto = Cream pinto, Ind. bush = Indeterminate bush, Ind. prost = Indeterminate prostrate, Growth H= Growth habit, BELDAK = BELDAKMI RR 5, Seed size based on 100 seed weight: 1 to 24 g = small seed; 25 to 39 g = medium seed; 40 g and above = large seed.
5708 A plot with two 1 m long rows spaced 60 cm apart was used. This wider row spacing was used to facilitate furrow supplemental irrigation when needed. Intra-row plant-to-plant spacing was 10 cm. Two seeds were hand plant-to-planted per hill and the stand thinned to one plant per hill 10 days after emergence to maintain optimum plants per plot. Standard agronomic and plant protection treatments were used uniformly across the plots for the duration of the experiment. Parameters were measured on plant and plot basis. Phenological traits (days to 50 % flowering and days to 75 % maturity) and 1000 seed weight were recorded on plot basis and all other agronomic traits were measured on plant basis. A random sample of five plants from each plot and a random sample of five pods from each of the five plants were considered to collect data for plant-based parameters. The data were subjected to analysis of variance (ANOVA) according to Steel and Torrie (1980) and it was computed using SAS statistical software (SAS, 2004). Existence of significant difference among genotypes justifies further analysis.
Heterosis measures , like better parent heterosis (BPH) and economic heterosis (SH) in percent, both having commercial breeding implication, particularly for
self-pollinated crops, were calculated for those characters which showed significant difference between genotypes (crosses plus parents) following the method suggested by Falconer and Mackay (1996):
BPH (%) = ((F1 –BP)/ BP)*100 SH (%) = ((F1 –SH)/SH)*100
Where, F1 = Mean value of the F1 cross BP = Mean value of the better parent
SH = Mean value of the standard check or economic variety to the study area
Tests for significance of heterosis were made using t-test Standard error of the differences between heterosis was calculated as follows:
SE (d) for BP or SH = ± 2Me/r
Where, SE (d) is standard error, Me is error mean square and r is the number of replications and the t obtained was tested against the tabular t-value at error degree of freedom.
t (better parent) = BPH/SE (d), and t (economic) = SH/SE(d)
RESULTS AND DISCUSSION
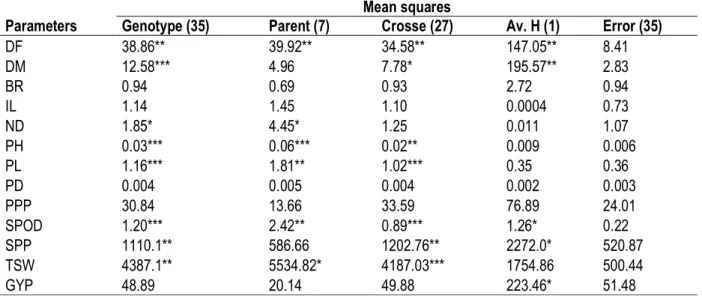
Results of ANOVA revealed statistically significant differences (P<0.01 or P<0.05) between the 36 genotypes were observed for number of days to flowering and maturity, number of nodes on the main axis, plant height, pod length, number of seeds per pod, number of seeds per plant and 1000-seed weight (Table 2). Statistically significant difference among the parents and crosses were observed for phenological, some architectural, and yield component traits. Average heterosis, which is a one degree of contrast between the mean of the parents and the mean of the crosses, was significant for phenological, yield and yield component traits suggesting the presence of directional dominance for the expression of these traits. Mean performance of the parents showed that Roba-1 performed well in architectural traits (number of branches and nodes and pod length), in yield and yield components such as number of pods per plant, seeds per pod and seeds per plant (Table 3). It was also one of the earliest parent taking 85 days to maturity as compared to the late maturing varieties like Red wolayta, although it was late
flowering. Thus, it had relatively short pod filling period (the period from flowering to maturity) as a result it has smaller seeds. Dimtu had poor value for the architectural traits and showed reasonably good performance for yield and yield components. It was intermediate in maturity. Zebra had the highest seed yield per plant (20.8 gram) and it was reasonably good in architectural traits such as plant height, internodes length, pod length, and number of nodes on the main axis. MAM-41 was intermediate in flowering, but late maturing, and had pods with the maximum diameter and hence larger seeds with 1000-seed weight of 305 gram as compared to that of Roba-1 (200 gram). BELDAKMI RR 5 was one of the best parents in yield and yield components and in architectural traits like plant height and number of nodes on the main axis. SK 93263 was the earliest to flower and mature. Tabor produced the longest pods, large number of branches on the main axis and showed generally good performance in yield component traits. Red wolayta was the latest maturing parent. It had large number of nodes and branches on the main axis and larger pod size.
5709
Table 2: Mean squares due to genotypes, parents, crosses, average heterosis and error for yield and associated traits of common beans
Parameters
Mean squares
Genotype (35) Parent (7) Crosse (27) Av. H (1) Error (35)
DF 38.86** 39.92** 34.58** 147.05** 8.41 DM 12.58*** 4.96 7.78* 195.57** 2.83 BR 0.94 0.69 0.93 2.72 0.94 IL 1.14 1.45 1.10 0.0004 0.73 ND 1.85* 4.45* 1.25 0.011 1.07 PH 0.03*** 0.06*** 0.02** 0.009 0.006 PL 1.16*** 1.81** 1.02*** 0.35 0.36 PD 0.004 0.005 0.004 0.002 0.003 PPP 30.84 13.66 33.59 76.89 24.01 SPOD 1.20*** 2.42** 0.89*** 1.26* 0.22 SPP 1110.1** 586.66 1202.76** 2272.0* 520.87 TSW 4387.1** 5534.82* 4187.03*** 1754.86 500.44 GYP 48.89 20.14 49.88 223.46* 51.48
Av. H = Average heterosis. *, **, *** = significant difference at P<0.05, P<0.01 and, P<0.001 respectively. Numbers in parenthesis represent respective degree of freedoms. DF = Days to flowering, DM = days to maturity, BR = Number of branch, IL = Internodes length, ND = Number of nodes, PH = Plant height, PL = Pod length, PD = Pod diameter, PPP = Number of pods per plant, SPOD = Number of seeds per pod, SPP = Number of seeds per plant, TSW = 1000-seeds weight, GYP = Seed yield per plant.
Analysis of better parent heterosis revealed sixteen crosses out of twenty-eight were showed significant heterosis for seed yield per plant. Among which twelve were positive. The maximum positive better parent heterosis (114.103 %) for seed yield was observed in the cross MAM-41 x Tabor while the minimum better parent heterosis (-31.138 %) was obtained from the cross Dimtu x Tabor. These were also the crosses with the highest
and lowest seed yield per plant, respectively. The expression of bean yield better parent heterosis was reported by several workers (Foolad and Bassiri, 1983; Singh and Saini, 1983; CIAT, 1984; Nienhuis and Singh 1986; Patil and Chaudhari 1986). Significant economic heterosis was observed in fourteen crosses for seed yield per plant, among which seven were positive.
Table 3: Mean value of yield and associated traits for the 36 genotypes (8 parents and their 28 F1 diallel crosses) of common beans Progeny DF DM BH IL ND PH PL PD PPP SPD SPP TSW GYP 1X2 49.0 83.0 3.7 9.71 13.9 1.16 10.4 0.62 20.20 5.40 106.60 225 27.7 1X3 47.0 81.0 4.2 9.32 15.5 1.27 10.1 0.64 26.20 5.39 111.20 245 30.1 1X4 42.5 81.0 2.4 8.75 13.4 1.02 10.1 0.61 15.60 4.80 70.60 270 18.6 1X5 43.0 82.5 3.1 8.04 14.3 1.15 10.5 0.53 20.10 5.08 90.30 265 24.0 1X6 38.5 80.5 4.2 8.37 13.2 1.10 9.9 0.63 27.00 5.42 111.80 265 27.0 1X7 49.0 85.0 3.5 8.64 13.3 1.10 10.9 0.53 24.20 5.72 129.30 205 26.1 1X8 48.5 84.5 3.8 7.76 14.5 1.09 9.9 0.55 24.20 5.07 108.50 200 19.8 2X3 48.5 85.0 3.6 9.94 14.1 1.34 10.0 0.57 25.70 4.77 108.40 240 23.3 3X4 46.0 84.0 3.0 8.82 15.2 1.25 9.3 0.63 20.70 4.98 74.30 260 18.6 2X5 39.0 81.0 3.5 8.33 14.5 1.14 9.5 0.65 23.70 4.64 71.40 270 18.5 2X6 41.5 82.0 2.6 9.72 13.6 1.24 8.9 0.65 19.10 3.87 62.90 300 17.9 2X7 52.0 88.0 1.9 9.11 13.6 1.17 9.9 0.61 13.60 4.33 57.90 235 11.5 2X8 52.5 87.5 3.3 8.97 14.0 1.17 9.9 0.57 20.20 4.87 84.70 200 14.6 3X4 43.5 84.5 3.5 9.02 14.9 1.26 8.8 0.60 19.70 4.12 62.80 310 18.7 3X5 38.5 83.5 2.7 9.30 16.3 1.46 8.6 0.68 20.90 3.60 61.40 335 20.8
5710 3X6 40.5 83.5 2.1 9.86 14.4 1.36 8.6 0.62 18.80 3.52 48.80 330 15.3 3X7 45.5 84.5 3.2 8.99 14.9 1.27 9.6 0.54 24.50 4.54 95.80 260 24.5 3X8 43.0 85.0 3.3 9.85 14.1 1.30 9.2 0.53 28.90 4.48 115.10 235 25.8 4X5 41.0 84.5 1.8 9.64 14.6 1.32 8.7 0.66 14.20 3.76 41.70 330 14.8 4X6 46.0 84.0 3.0 10.10 13.6 1.30 9.4 0.61 20.00 3.88 64.80 375 22.1 4X7 46.5 81.5 4.7 7.85 14.6 1.35 10.2 0.58 28.90 5.23 123.10 270 33.4 4X8 41.5 84.5 3.5 8.12 14.2 1.21 8.8 0.63 24.00 4.30 73.60 280 21.0 5X6 42.0 81.0 2.9 9.20 14.0 1.27 9.5 0.65 16.30 4.00 49.30 360 16.4 5X7 40.5 83.5 2.9 9.29 14.4 1.27 10.8 0.65 19.30 5.18 79.70 290 22.3 5X8 40.5 83.5 2.6 8.14 14.0 1.14 10.2 0.61 18.00 4.76 78.90 270 19.6 6X7 39.5 81.5 2.6 9.92 12.5 1.17 10.3 0.59 16.80 5.21 68.70 285 19.6 6X8 40.5 80.5 3.0 9.21 13.0 1.10 8.9 0.60 21.60 3.55 62.40 295 17.0 7X8 49.5 85.0 2.7 10.60 13.8 1.35 11.0 0.60 21.50 5.68 103.00 225 21.5 Roba-1(1) 51.0 86.0 3.1 7.78 14.8 1.10 10.5 0.55 19.80 6.07 99.10 200 18.8 Dimtu (2) 52.5 87.5 3.0 8.82 13.9 1.25 9.1 0.61 19.00 4.88 80.40 215 16.7 Zebra (3) 46.5 89.0 2.1 9.54 14.8 1.35 8.8 0.61 17.80 3.98 72.90 265 20.8 MAM-41 (4) 48.0 88.0 2.8 9.62 14.1 1.27 9.3 0.71 15.20 4.12 54.10 305 15.3 BELDAKMIRR5(5) 41.5 88.0 2.5 9.43 16.5 1.61 8.8 0.66 24.10 2.78 63.70 305 20.6 SK 92263 (6) 40.5 85.0 1.5 10.30 11.8 1.17 8.4 0.58 17.30 3.04 47.20 345 15.8 Tabor (7) 49.5 86.0 3.0 9.32 12.5 1.11 11.0 0.61 19.30 5.26 80.00 225 15.6 Red wolaita (8) 51.0 89.5 3.2 7.99 15.1 1.15 10.4 0.61 17.30 4.51 56.50 225 11.2 Mean 44.90 84.29 3.01 9.09 14.16 1.23 9.7 0.61 20.66 4.58 79.75 269.86 20.15 LSD (5%) 5.89 3.42 1.97 1.74 2.10 0.16 1.2 0.12 9.95 0.95 46.33 45.41 14.57 DF=Days to flowering, DM=days to maturity, BH=Number of branch, IL=Internodes length, ND=Number of nodes, PH=Plant height, PL=Pod length, PD=Pod diameter, PPP=Number of pods per plant, SPD=Number of seeds per pod, SPP=Number of seeds per plant, TSW=1000-seeds weight, GYP=Seed yield per plant.
The maximum economic heterosis (60.58 %) was observed in the cross MAM-41 x Tabor (Table 4). Significant better parent heterosis was observed in most of the crosses for number of pods per plant. It ranged from -41.079 % (MAM-41 x BELDAKMI RR 5) to 62.36 % (Zebra x Red wolayta). Higher number of pods per plant over the better parent was reported by Foolad and Bassiri (1983) and Singh and Saini (1983). In contrast to the present study, however, non-significant better parent heterosis for the same trait was reported by Melaku (1993) and Gutierrez and Singh (1985). Only two crosses (Zebra x Red wolayta and MAM-41 x Tabor) gave significantly higher (P<0.05) number of seeds per plant (57.89 %, 53.87 in that order) than the best parent. Although not significant, thirteen crosses produced large number of seeds per plant than the best parent. Melaku (1993) and Foolad and Bassiri (1983) reported significant positive better parent heterosis in one cross and five crosses, respectively for the trait. Significant better parent heterosis was observed in all except five crosses for number of seeds per pod. However, only four crosses exhibited significant positive better parent heterosis,
among which the hybrid BELDAKMI RR 5 x SK 93263 (31.71 %) showed the maximum value for the trait. The cross MAM-41 x Tabor which showed significant positive better parent heterosis for seed yield per plant, number of pod per plant and seeds per plant here exhibited non-significant negative better parent heterosis for number of seeds per pod. Non-significant better parent heterosis was observed in all of the crosses for 1000-seed weight. Only seven crosses had larger seeds than the better parent did. The value of better parent heterosis for 1000-seed weight ranged from -23.19 % (Roba-1 x SK93263) to 9.84 % (Zebra x BELDAKMI RR 5). Highly significant (P<0.01) better parent heterosis was obtained in almost all crosses for pod length (Table 5), among which only three were positive. The value of percent better parent heterosis for pod length ranged from -15.50 % (MAM-41 x Red wolayta) to 9.54 % (Dimtu x Zebra). Although not significant, Melaku (1993) reported nine crosses out of twenty-eight produced pods shorter than the better parent. Highly significant better parent heterosis for pod diameter was observed in all the crosses except one. However, only six crosses produced pods with greater
5711 diameter than the better parent did. The maximum better parent heterosis for pod diameter was obtained from the cross Roba-1x SK93263 (8.70 %). This result go with the work of Patil and Chaudhari (1986), who reported that about half of the twenty eight crosses exhibited negative significant better parent heterosis for pod diameter. Contrary to the present study, however, Singh and Saini (1983) reported positive and significant better parent
heterosis for pod diameter in all the crosses studied. All the crosses manifested very highly significant better parent heterosis for plant height. However, only four of them were taller than the tallest parent. The cross Tabor x Red wolayta (17.24 %) exhibited the maximum better parent heterosis. This result is in agreement with that of Melaku (1993), who reported the expression of better parent heterosis for plant height in beans.
Table 4: Percent better parent heterosis for grain yield and yield components, and economic heterosis for grain yield in an 8x8 diallel cross population of common beans
Crosses PPP SPD SPP TSW GYP SHGYP
1X2 2.020 -10.994** 7.568 4.651 47.340** 33.173** 1X3 32.323** -11.159** 12.210 -7.547 44.712** 44.712** 1X4 -21.212** -20.883** -28.759 -11.475 -1.064 -10.577 1X5 -16.598** -16.268** -8.880 -13.115 16.505* 15.385* 1X6 36.364** -10.664** 12.815 -23.188 43.617** 29.808** 1X7 22.222** -5.670** 30.474 -8.889 38.830** 25.481** 1X8 22.222** -16.367** 9.485 -11.111 5.319 -4.808 2X3 35.263** -2.295** 34.826 -9.434 12.019 12.019 3X4 8.947 1.926** -7.587 -14.754 11.377 -10.577 2X5 -1.660 -4.918** -11.194 -11.475 -10.194 -11.058 2X6 0.526 -20.697** -21.766 -13.044 7.186 -13.942 2X7 -29.534** -17.757** -27.985 4.444 -31.138** -44.712** 2X8 6.316 -0.266 5.348 -11.111 -12.575 -29.808** 3X4 10.674* 0.000 -13.855 1.639 -10.096 -10.096 3X5 -13.278* -9.570** -15.775 9.836 0.000 0.000 3X6 5.618 -11.580** -33.059 -4.348 -26.442** -26.442** 3X7 26.943** -13.688** 19.750 -1.887 17.788* 17.788* 3X8 62.360** -0.665 57.888* -11.321 24.038** 24.038** 4X5 -41.079** -8.811** -22.921 8.197 -28.155** -28.846** 4X6 15.607** -5.898** 19.778 8.696 39.873** 6.250 4X7 49.741** -0.513 53.875* -11.475 114.103** 60.577** 4X8 38.728** -4.656** 30.265 -8.197 37.255** 0.962 5X6 -32.365** 31.709** -22.606 4.348 -20.388** -21.154** 5X7 -19.917** -1.445** -0.375 -4.918 8.252 7.212 5X8 -25.311** 5.543** 23.862 -11.475 -4.854 -5.769 6X7 -12.953* -0.875 -14.125 -17.391 24.051** -5.769 6X8 24.855** -21.197** 10.442 -14.493 7.595 -18.269* 7X8 11.399* 7.985** 28.750 0.000 37.821** 3.365 Cross mean 21.21 4.65 82.75 272.5 21.09 Parent mean 18.73 4.33 69.24 260.63 16.85 Av. H 2.48 0.32 13.51 11.87 4.24
*, ** shows percent heterosis significantly different from zero at P<0.05 and P<0.01 level of significance, respectively. SHGYP = economic heterosis for seed yield per plant, Av. H = Average heterosis, PD = Pod diameter, Number of pods per plant, SPD = Number of seeds per pod, SPP = Number of seeds per plant, TSW = 1000-seeds weight, 1 = Roba-1, 2 = Dimtu, 3 = Zebra, 4 = MAM-41, 5 = BELDAKMI RR 5, 6 = SK 93263, 7 = Tabor, 8 = Red wolayta.
5712
Table 5: Percent better parent heterosis for Phenological and architectural traits in an 8 x 8 diallel crosses population of common beans Crosses DF DM BR IL ND PH PL PD 1X2 -3.9220 -3.488* 19.355** 10.075** -6.081** -7.674** -0.525 1.961** 1X3 1.0753 -5.814** 35.484** -2.275* 4.730** -5.721** -3.392** 4.762** 1X4 -11.460** -5.814** -22.581** -9.104** -9.459** -20.063** -3.793** -13.662** 1X5 3.6145 -4.070* 0.000 -14.725** -13.333** -28.314** 0.459 -20.121** 1X6 -4.9380 -5.294** 35.484** -18.543** -10.811** -6.474** -5.350** 8.696** 1X7 -1.0100 -1.163 12.903** -7.275** -10.135** -1.448** -0.936 -12.829** 1X8 -4.9020 -1.744 18.750** -2.941** -3.974** -5.199** -5.111** -10.311** 2X3 4.3011 -2.857 20.000** 4.203** -4.730** -0.594** 9.541** -7.680** 3X4 -4.1670 -4.000* 0.000 -8.314** 7.801** -1.810** -0.311 -11.972** 2X5 -6.0240* -7.429** 16.667** -11.661** -12.121** -28.998** 4.045** -1.513** 2X6 2.4691 -3.529* -13.333** -5.409** -2.158* -0.560** -2.374** 6.209** 2X7 5.0505 2.326 -36.667** -2.210* -2.158* -6.395** -9.900** -0.654 2X8 2.9412 0.000 3.125** 1.666 -7.285** -6.395** -5.384** -7.026** 3X4 -6.4520* -3.977* 25.000** -6.267** 0.676 -6.464** -5.782** -15.915** 3X5 -7.2290* -5.114** 8.000** -2.516** -1.212 -9.459** -2.621** 2.118** 3X6 0.0000 -1.765 0.000 -4.040** -2.703* 0.892** -1.719** 2.135** 3X7 -2.1510 -1.744 6.667** -5.776** 0.676 -5.944** -12.364** -11.658** 3X8 -7.5270* -4.494* 3.125** 3.260** -6.623** -3.566** -11.641** -13.584** 4X5 -1.2050 -3.977* -35.714** 0.135 -11.515** -17.735** -6.726** -7.746** 4X6 13.580** -1.176 7.143** -1.605 -3.546** 2.124** 0.955 -14.789** 4X7 -3.1250 -5.233** 56.667** -18.375** 3.546** 6.137** -7.500** -18.592** 4X8 -13.540** -3.977* 9.375** -15.631** -5.960** -4.642** -15.499** -11.268** 5X6 3.7037 -4.706** 16.000** -10.536** -15.152** -21.033** 7.353** -1.362** 5X7 -18.180** -2.907 -3.333** -1.474 -12.727** -21.220** -1.536* -1.967** 5X8 -2.4100 -5.114** -18.750** -13.718** -15.152** -29.247** -1.900** -7.262** 6X7 -2.4690 -4.118** -13.333** -3.473** 0.000 -0.511** -6.718** -3.454** 6X8 0.0000 -5.294** -6.250** -10.439** -13.907** -6.303** -14.175** -2.619** 7X8 0.0000 -1.163 -15.625** 13.541** -8.609** 17.244** -0.1545 -2.128** Cross mean 44.13 83.41 3.12 9.09 14.16 1.23 9.71 0.60 Parent mean 47.56 87.38 2.65 9.10 14.19 1.25 9.54 0.62 Av. H -3.4 -3.97 0.53 -0.01 -0.03 -0.02 0.17 -0.02
*, ** shows percent heterosis significantly different from zero at P<0.05 and P<0.01 level of significance, respectively. Av. H = Average heterosis. DF = Days to flowering, DM = days to maturity, BR = Number of branches on the main axis, IL = Internodes length, ND = Number of nodes on the main axis, PH = Plant height, PL = Pod length, 1 = Roba-1, 2 = Dimtu, 3 = Zebra, 4 = MAM-41, 5 = BELDAKMI RR 5, 6 = SK 93263, 7 = Tabor, 8 = Red wolayta.
Significant better parent heterosis was exhibited almost by all crosses for number of nodes on the main axis, among which only three had greater number of nodes than the better parent. The cross Zebra x MAM-41 (7.80%) had the maximum better parent heterosis for number of nodes. Significant better parent heterosis was observed for internodes length in all except four crosses.
Only four of them had larger internodes length than the better parent. The value of better parent heterosis for the trait ranged from -18.54% (Roba-1x SK93263) to 13.54% (Tabor x Red wolayta), this was the cross that showed maximum better parent heterosis for plant height. Twenty-five out of the twenty-eight crosses exhibited very highly significant better parent heterosis for number of branches
5713 on the main axis. Sixteen of them had larger number of branches than the better parent. The cross MAM-41 x Tabor (56.67 %) exhibited the maximum better parent heterosis for number of branches. This was the cross with the highest grain yield. Seven and eighteen crosses out of twenty-eight showed significant negative better parent heterosis for days to flowering and maturity, respectively (Table 5). Such crosses are useful when earliness is the major objective of the breeding program. This result is in agreement with the work of Foolad and Bassiri (1983), who reported significant negative better parent heterosis in seven out of twelve crosses studied. The maximum better parent heterosis for number of days to maturity (early maturing) was exhibited by the cross Dimtu x BELDAKMI RR 5 (-7.43 %) whereas the cross Dimtu x Tabor took 88 days (the maximum positive better parent heterosis, 2.33 %) to mature among the crosses studied. Generally, in this study, average heterosis was positive for yield and all yield components and for some architectural traits like number of branches on the main axis and pod length. However, it was negative for the phenological traits. Thus, in general dominance increased
seed yield per plant by 4.24 gram, number of pods per plant, seeds per pod and seeds per plant by 2.48, 0.32, and 13.51, respectively; number of branches on the main axis by 0.53 and pod length by 0.17 cm, and it reduced days to flowering and maturity by 3.4 and 4 days, respectively. In the present study, expression of significant better parent heterosis for grain yield and other traits was frequent in combinations of parents from different growth habits (MAM-41 x Tabor, Roba-1x SK93263), seed color (Tabor x Red wolayta, BELDAKMI RR 5 x SK93263, Dimtu x Zebra), and seed size (Roba-1x Tabor). This result supports the findings of previous workers who reported the importance of genetic diversity for the expression of heterosis (Foolad and Bassiri, 1983; CIAT, 1984; Gutierrez and Singh, 1985; Nienhuis and Singh, 1986; Melaku, 1993). In conclusion, the extent of percent better parent and economic heterosis like in the cross MAM-41 x Tabor with 114.103 % seed yield better parent heterosis and 60.6 % economic heterosis suggested that this hybrid could be further considered in the breeding program aiming both for segregant breeding and hybrid development.
ACKNOWLEDGMENT
The financial support of the Ethiopian Institute of Agricultural Research through the Agricultural research and Training Project is highly appreciated.
REFERENCES
Centro International de Agricultura Tropical (CIAT), 1984. Bean program. Annual report.1982. Cali, Colombia. P. 49-50, 127-128.
Centro International de Agricultura Tropical (CIAT), 1995. Annual report, Bean program, Cali, Colombia. P. 38-40.
Falconer DS. and Mackay TFC, 1996. Introduction to Quantitative Genetics, 4th ed. Long man Scientific and Technical, London.
Foolad MR. and Bassiri A, 1983. Estimates of combining ability, reciprocal effects, and heterosis for yield and yield components in a common bean diallel cross. J. Agric. Sci. 100: 103-108.
Gutierrez JA. and Singh SP, 1985. Heterosis and inbreeding depression in dry bush beans, Phaseolus vulgaris L. Can. J. Plant. Sci. 65 (2): 243-249.
Katungi E, Farrow A, Mutuoki T, Gebeyehu S, Karanja D, Alamayehu F, Sperling L, Beebe S, Rubyogo JC, Buruchara R, 2010. Improving common bean productivity: An Analysis of socioe-conomic factors in Ethiopia and Eastern Kenya.
Baseline Report Tropical legumes II. Centro Internacional de Agricultura Tropical - CIAT. Cali, Colombia.
Kimani PM, 1999. Common Bean in Africa. Its origin, production, and improvement, a brief note, University of Nairobi, Department of Crop Sciences, Nairobi, Kenya.
Melaku A, 1993. Heterosis and combining ability for yield and other quantitative characters in haricot bean (Phaseolus vulgaris L.). An MSc Thesis Presented to the School of Graduate Studies of Alemaya University.
Negash R, 2007. Determinants of adoption of improved haricot bean production package in Alaba special woreda, Southern Ethiopia. MSc Thesis, Haramaya University.
Nienhuis J. and Singh SP, 1983. Diallel analyses and correlations among yield and yield components in bush beans, Phaseolus vulgaris L. p. 1-11 In: Reunion Annual de programa Cooperrativo centro Americano para el Majoramiento de
5714 cultivos Alimenticios, 29a, Panama, 1983. Memoria, Panama. Vol.2.
Nienhuis J. and Singh SP, 1986.Combining ability analysis and relationships among yield, yield components, and architectural traits in dry beans. Crop Sci. 26: 21-27.
Pachico D, 1993. The demands for bean technology. Trends in CIAT commodities. Working Document, No. 128.pp: 60-74. Henry, G., Ed. Centro International de Agricultura Tropical (CIAT), Cali, Colombia.
Patil MM. and Chaudhari AN, 1986. Heterosis in French bean. J. Maharashtra Agri. Univ. 11:72-73. SAS, 2004. System Analysis Software. Version 9.1.2.
SAS Institute INC. Cary, North Carolina, USA. Schoonhoven V. and Voysest O, 1991.Common bean
Research for crop improvement. C.A.B. International, Wallingford, UK.
Shull GH, 1952. Beginnings of the heterosis concept. In: Heterosis J. W. Gowen (ed.). Iowa, State College Press, Ames.
Singh AK. and Saini SS, 1983.Heterosis and combining ability studies in French bean. Sabrao Journal 15: 17-22.
Steel RGD. and Torrie JH, 1980. Principles and procedures of statistics: A biometrical approach. 2nd ed. Mcgraw-Hill Book Company. Auckland.