UNIVERSITÉ DE MONTRÉAL
DETECTION OF HIDDEN CORROSION BY PULSED EDDY CURRENT USING TIME FREQUENCY ANALYSIS
SEID MOHAMMAD SALEH HOSSEINI DÉPARTEMENT DE GÉNIE MÉCANIQUE ÉCOLE POLYTECHNIQUE DE MONTRÉAL
THÈSE PRÉSENTÉE EN VUE DE L’OBTENTION DU DIPLÔME DE PHILOSOPHIAE DOCTOR
(GÉNIE MÉCANIQUE) AVRIL 2012
UNIVERSITÉ DE MONTRÉAL
ÉCOLE POLYTECHNIQUE DE MONTRÉAL
Cette thèse intitulée:
DETECTION OF HIDDEN CORROSION BY PULSED EDDY CURRENT USING TIME FREQUENCY ANALYSIS
présentée par : HOSSEINI Seid Mohammad Saleh
en vue de l’obtention de diplôme de : Philosophiae Doctor a été dûment acceptée par le jury d’examen constitué de :
M. BALAZINSKI Marek, Ph.D., président
M. LAKIS Aouni A., Ph.D., membre et directeur de recherche M. HOJJATI Mehdi, Ph.D., membre
DEDICATIONS
To my lovely wife, Nioosha
ACKNOWLEDGMENT
I wish to thank all those who supported me in the completion of this study and made the way of research smooth for me.
I would like to express my sincere gratitude to my doctoral advisor Prof. Aouni A. Lakis for his patience, guidance and invaluable support throughout the realisation of this research.
My sincere appreciation goes to Prof. Marek Blazinski, Dr. Mehdi Hajjati, Dr. Mouloud Amazouz and Dr. Antoine Saucier for taking part as my dissertation committee.
This project has been made possible by precious support from the collaborative research and development grant of Natural Sciences and Engineering Research Council of Canada (NSERC), Pratt & Whitney Canada, BOMBARDIER Aeronautics and National Research Council of Canada I Finally I could not have accomplished this without all the supports of my family, especially my lovely wife. To them I tribute a fervent thanks.
RÉSUMÉ
En augmentant le nombre de demandes de voyages par l'intermédiaire des lignes aériennes, on augmente ainsi le nombre d’avions et par conséquent le nombre d'avions vieillissants en service. Dans l'industrie aérospatiale, comme pour d’autres industries de transport, l'existence des défauts dans les véhicules et la capacité de trouver ces défauts peuvent faire la différence entre la vie et la mort.
De ce fait, les méthodes d'essais non destructives sont périodiquement appliquées pour inspecter les composantes d'avions avant qu'elles soient assemblées et également durant toute leur durée de vie. Les composantes d’avions sont conçues pour être aussi légères que possible afin de supporter les charges relativement élevées à leur force matérielle. Cela signifie qu'une petite défaut paille peut causer de grandes ruptures dans le fuselage ou les moteurs de ces avions.
La fatigue et la corrosion sont les deux principales causes des défaillances d’avions en service. Plusieurs méthodes d'essais non destructives sont habituellement appliquées pour inspecter les composantes d'avions lorsqu’elles sont en opération. Ces méthodes sont l’ultrason, les courants de Foucault, le liquide pénétrant, le rayonnement et l’inspection magnétiques des particules. La nature électromagnétique de l'essai des courants de Foucault fournit une grande pénétration des fuselages d'avions et donne de riches informations de l’intérieur de la structure de l'échantillon inspecté. Par conséquent, cette méthode est présentée comme l’une des méthodes d'inspection les plus puissantes dans l’industrie aéronautique. La limitation principale des essais par les courants de Foucault est que cette méthode a besoin d'un inspecteur professionnel et que seulement les matériaux conducteurs peuvent être inspectés par ces essais. Par contre, les tests des courants de Foucault n'ont besoin d'aucun contact physique avec la surface inspectée, ce qui leur donne un grand avantage par rapport aux autres essais non destructifs employés dans l’industrie aéronautique. Deux types d'inspection ont été développés concernant les tests par les courants de Foucault : les tests par les courants de Foucault conventionnels et les tests pulsés. Dans les tests de courant de Foucault conventionnels, la sonde est excitée avec un signal sinusoïdal harmonique aux fréquences uniques ou à fréquences multiples pour étudier les signaux transitoires de courant de Foucault. Contrairement aux essais conventionnels, les essais par les courants de Foucault pulsés appliquent à la place une excitation sous forme d’impulsion carrée ou sinusoïdale et la bobine de la sonde est excitée par des impulsions répétitives à large bande.
Cette thèse rapporte le développement d'une méthode d’inspection automatique avec la méthode de courant de Foucault pulsée pour déterminer l'endroit et les quantités de pailles produites dans les structures en aluminium à double couche et mesurer également la variation d'épaisseur dans un système à une seule couche.
Cette thèse mise au point trois principales parties :
1- l’établissement d’un banc d’essai utilisant les courants de Foucault pulsés avec toutes les composantes pour prendre des signaux d’échantillons défectueux;
2- l’application de nouvelles méthodes de traitement de signaux utilisant les distributions temps-fréquences pour extraire l'information cachée à partir du système utilisant les courants de Foucault pulsés et
3- l’application des méthodes d'intelligence artificielle pour réduire au minimum l'interférence humaine en estimant et en déterminant la distribution de défauts dans les fuselages d'avions.
L'inspection dans l’industrie aérospatiale est une situation très sensible et une méthode non destructive devrait être précise et fiable pour pouvoir l'appliquer dans le contrôle d’avions structures.
Dans la première partie, plusieurs types de pertes de métal dans l'éventail de la profondeur ont été produits afin de simuler la corrosion et les conditions des défauts sur des surfaces de plaques en aluminium. Un banc d’essai utilisant les courants de Foucault pulsés a été établi et programmé pour permettre l’acquisition de signaux précis à partir d’une surface défectueuse et d’une surface non défectueuse. Dans la deuxième partie, des signaux de courants de Foucault pulsés ont été traités par la méthode d'analyse « temps-fréquences ». Les effets internes et externes du bruit tels que la basse quantité de défauts placée loin de la surface de la couche extérieur et intérieur enlèvent la cause réduisant l'efficacité de la représentation du signal dans le domaine de temps et l'analyse en temps-fréquence est mise en application pour améliorer la représentation des signaux et pour indiquer l'information cachée des défauts. Dans cette étape, des signaux pris en utlisant les courants de Foucault pulsés et qui sont représentés par une série de tension-temps (dans le domaine de temps) sont convertis pour représenter les signaux en trois dimensions (temps-fréquence-amplitude).
Plus de dix différentes distributions en temps-fréquences ont été programmées et mises en application. Ces distributions sont la transformée de Fourier à fenêtres glissantes (STFT- comme distribution linéaire en temps-fréquence) et des distributions bilinéaires telles que la distribution de Wigner-Ville, la distribution Wigner-Ville lissée, la distribution de Pseudo-Wigner-Ville, la distribution de la Born-Jordan, la distribution de Rihaczek, la distribution de Choi-Williams, la distribution de Zhao-Atlas-Marks, la distribution de Butterworth et finalement le spectrogramme. La distribution de Rihaczek a été choisie parmi toutes les distributions énoncées ci-dessus pour convertir les signaux du domaine temporel au domaine de temps-fréquence. La distribution de Rihaczek a montré moins d'interférence et moins de termes croisés par rapport aux autres distributions. En plus, utiliser la partie réelle de l’énergie dans la distribution de Rihaczek empêche la nécessité d'abandonner n'importe quelle sorte d'analogie aux phénomènes physiques avec des valeurs négatives. Dans cette thèse, la distribution de Rihaczek a été utilisée pour représenter les signaux qui viennent du système à double couche. Par contre, en cas de mesure de variation d'épaisseur, le spectrogramme a été appliqué pour représenter les signaux en trois dimensions pour le système à une seule couche.
Le dernier point étudié dans cette recherche était de mettre en application la méthode d'extraction de paramètres et la classification pour la détection automatique des défauts. Basée sur le modèle mathématique pour extraire les paramètres à partir des données de représentation en temps-fréquence, l'analyse de composante principale (ACP) a été appliquée pour enlever les données redondantes, réduisant ainsi la taille des données d’une part et d’autre part extraire quelques nouveaux paramètres en tant que spécifications uniques de chaque type de défaut et comme entrée des classificateurs.
L'efficacité des méthodes de classification est habituellement déterminée si la classification est erronée. Deux types de classificateurs discriminatoires et probabilistiques ont eu l'erreur minimum de classification fausse parmi plusieurs classificateurs qui ont été implantés pour ce travail. Ces classificateurs sont l’algorithme des k-moyennes comme méthode discriminatoire et l’algorithme de l'espérance-Maximisation (EM) comme méthode probabilistique.
Dans ce travail, la combinaison de toutes les étapes énoncées ci-dessus fournit un outil d'inspection automatique (matériel et logiciel) de grande précision dans la détection des défauts des fuselages d'avions et structures métalliques multicouches.
ABSTRACT
The increasing demand for air travel has led to an increased number of aircraft in service. A large number of aging aircraft continue to fly. In the aerospace industry, as with other transportation industries, the occurrence of defects in vehicles and the ability to find these defects can make the difference between life and death. For this reason, non-destructive testing methods are periodically applied to inspect aircraft components before they are assembled and also throughout their service life. Components of aircrafts are designed to be as light as possible and also carry very high loads relative to their material strength. This means that a small flaw can cause a major failure in an aircraft fuselage or engine. Fatigue and corrosion are two main causes of failure in aircraft. Several non-destructive testing methods are typically applied to inspect aircraft components while they are in service. These methods are ultrasound, eddy current, liquid penetrate, radiation and magnetic particle inspection. The electromagnetic nature of eddy current testing provides deeper penetration through the aircraft fuselage and brings out rich information describing the interior structure of the inspected sample. Therefore, this method is a powerful inspection method that can be applied in the avionic industry. The main limitations of eddy current testing are that a professional inspector is required to use the method and only conductive materials can be inspected. On the other hand, the main advantage of eddy current testing compared to other non-destructive methods is that it needs no physical contact with the surface. Two types of inspection have been developed in eddy current testing; conventional eddy current and pulsed eddy current. In conventional eddy current testing, a probe is excited with a harmonic sinusoidal signal at a single frequency or multi frequencies to study transient eddy current signals. In contrast to the conventional eddy current method, the pulsed eddy current testing method applies square or sinusoidal shaped pulse excitation and the probe’s driving coil is excited by repetitive broadband pulses.
This thesis reports development of an automatic inspection method incorporating pulsed eddy current testing to determine the position and size of flaws buried in an aluminum double-layer structure and also to measure thickness variation in an aluminum single-double-layer system. Three main aspects are presented; building up a pulsed eddy current setup with all the components to acquire signals from defected samples, applying new signal processing and treatment methods using time-frequency distributions to reveal hidden information from the acquired pulsed eddy
current system and applying artificial intelligence methods to minimize human interference in estimating and determine the defect distribution in aircraft fuselages. Inspection in the aerospace industry is a sensitive case and a non-destructive method must be accurate and reliable for aircraft inspection.
In the first section of this thesis, several types of metal losses with a wide range of depths were fabricated on surfaces of an aluminum plate to simulate corrosion and defect conditions. A complete pulsed eddy current setup was built and programmed to acquire precise signals from defected and non-defected surfaces.
In the second section, pulsed eddy current signals were processed using a time-frequency analysis method. Internal and external noise effects were simulated using small defects placed far from the surface, inter-layer gap and lift off. Noise resources cause a reduction in efficiency of signal representation in the time domain and a time-frequency analysis is therefore implemented to improve representation of signals and reveal more hidden information from defects. In this step the acquired pulsed eddy current signals, which are represented by a voltage-time series (in time domain), are converted to represent signals in three dimensions (time-frequency-amplitude). Over ten different time-frequency distributions were programmed and implemented. These distributions use Short Time Fourier Transforms (STFT) as a linear time-frequency distribution and bilinear time-frequency distributions such as Wigner-Ville distribution, Smooth Wigner-Ville distribution, Pseudo Wigner-Ville distribution, Born-Jordan distribution, Rihaczek distribution, Choi-Williams distribution, Zhao-Atlas-Marks distribution, Butterworth distribution and spectrogram. The Rihaczek distribution was chosen as superior among all the above distributions to convert signals from time domain to frequency domain. Two type of bilinear time-frequency distributions are reported in this thesis which are Rihaczek distribution for hidden defect detection in double layer structures and spectrogram for thickness variation detection in single layer. The Rihaczek distribution has shown minimum interference and cross term effects compared to other time-frequency distributions. Additionally, using the real part of the energy in the Rihaczek distribution prevents the need to abandon any sort of analogy to physical phenomena with negative values for energy. In this thesis, the Rihaczek distribution was used to represent signals which come from a double-layer system. In the case of thickness variation measurements, a spectrogram was applied to represent signals from a single-layer system in three dimensions.
The final point studied in this research was to implement and apply a feature extraction method and a classifier for automatic defect detection. Based on a mathematical model for extracting features from time-frequency representation data, principal component analysis (PCA) was implemented and applied to remove redundant data, reduce the size of the data set and also extract some new parameters as a unique specification of each type of synthetic defect and input of classifiers. The efficiency of classification methods is usually determined by misclassification error. Two types of discriminative and probabilistic classifiers had minimum misclassification error among several classifiers which were studied during this project. These classifiers are K-Mean Clustering as a discriminative method and Expectation-Maximization (EM) algorithm as a probabilistic method. To calculate misclassification error in each classifier, several unknown samples were tested to determine the reliability of classification and also amount of misclassification error.
Combination of all the above steps in this work provides an automatic inspection tool (hardware and software) which has high accuracy and reliability for defect detection in aircraft fuselage and metallic multilayer structures.
TABLE OF CONTENT
DEDICATIONS ... III ACKNOWLEDGMENT ... IV RÉSUMÉ ... V ABSTRACT ... VIII TABLE OF CONTENT ... XI LIST OF FIGURES ... XV LIST OF ABBREVIATIONS ... XVIIIINTRODUCTION AND THESIS OBJECTIVE ... 1
CHAPITRE 1 LITETRATURE REVIEW ... 4
1.1 Eddy Current testing ... 4
1.1.1 Physical model of Eddy Current testing ... 4
1.1.2 Penetration depth of transient magnetic field ... 6
1.1.3 Conventional eddy current ... 7
1.1.4 Pulsed eddy current ... 9
1.2 Signal Treatment ... 10
1.2.1 Linear Time-Frequency Representations ... 11
1.2.2 Quadratic time-frequency distributions ... 12
1.2.3 Feature Extraction ... 15
1.2.4 K-Means Clustering and Expectation-Maximization Algorithm (EM) ... 16
1.3 Review of the application of pulsed eddy current in defect and thickness detection . ... 17
2.1 Article presentation and coherence with research objectives ... 22
CHAPITRE 3 APPLICATION OF TIME-FREQUENCY ANALYSIS FOR AUTOMATIC HIDDEN CORROSION DETECTION IN A MULTILAYER ALUMINUM STRUCTURE USING PULSED EDDY CURRENT ... 23
Abstract ... 23
3.1 Introduction ... 24
3.2 Experiment setup and description of sample ... 25
3.3 Theory ... 28
3.3.1 Pulsed Eddy current ... 28
3.3.2 Time-frequency analysis ... 28
3.3.3 Feature Extraction and Classification ... 30
3.4 Results and Discussion ... 32
3.4.1 Time Domain Signals ... 32
3.4.2 Time-Frequency Analysis ... 35
3.4.3 Feature extraction and classification ... 40
3.5 Conclusion ... 43
Acknowledgment ... 44
References ... 44
CHAPITRE 4 OVERLAP METAL LOSS DETECTION USING PULSED EDDY CURRENT AND TIME-FREQUENCY ANALYSIS IN ALUMINUM DOUBLE-LAYER STRUCTURES ... 47
Abstract ... 47
4.1 Introduction ... 48
4.2 Experimental setup and specimen ... 50
4.3.1 Time Domain Signals ... 52
4.3.2 Time-Frequency Analysis ... 55
4.3.3 Feature extraction and classification ... 59
4.4 Conclusion ... 62
Acknowledgment ... 63
References ... 63
CHAPITRE 5 TREATMENT OF PULSED EDDY CURRENT SIGNALS USING TIME-FREQUENCY ANALYSIS FOR DETECTION OF THICKNESS VARIATION IN AN ALUMINUM PLATE. ... 65
Abstract ... 65
5.1 Introduction ... 66
5.2 Experimental Setup and Specimen ... 67
5.2.1 Pulsed Eddy Current System Design ... 67
5.2.2 Sample Test and Thickness Variation ... 68
5.2.3 PEC Signals Processing ... 68
5.3 Results and Discussion ... 69
5.3.1 Time-Domain Signals ... 69
5.3.2 Time-Frequency Representation ... 70
5.3.3 Feature Extraction and Classification ... 73
5.4 Conclusion ... 74
Acknowledgment ... 74
References ... 75
CHAPITRE 6 GENERAL DISCUSSION ... 77
6.1 Pulsed eddy current signal acquisition and time-domain signal representation ... 77
6.3 Feature Extraction and Classification ... 79 CHAPITRE 7 CONCLUSION AND RECOMMENDATIONS ... 81 REFERENCES ... 83
LIST OF FIGURES
Figure 1.1 a schematic of the pulsed eddy current effect and its detection in a metallic structure. 6 Figure 1.2 plots of system inductance and resistance by eddy current testing (a) thickness
detection in A-scan (b) B-scan from thick to thin state of metal with starting point from air . 8
Figure 1.3 Pulsed eddy current response (Giguere, Lepine et al. 2001). ... 10
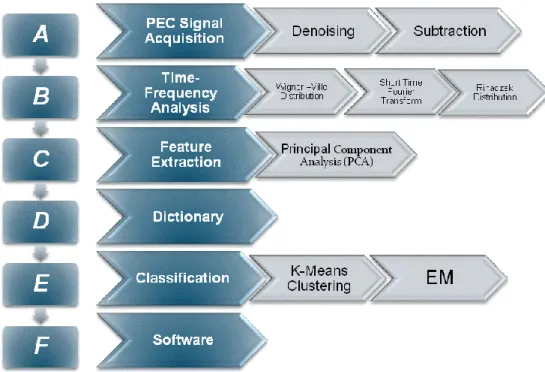
Figure 2.1 Procedure for automatic defect detection and data mining of pulsed eddy current signals ... 22
Figure 3.1 Schematic of sampling test. (a) View from above. (b) View from side. ... 26
Figure 3.2 Designed PEC system. ... 27
Figure 3.3 Diagram of the detection process. ... 27
Figure 3.4 Schematic of pulsed eddy current for defect detection in double layer system. ... 28
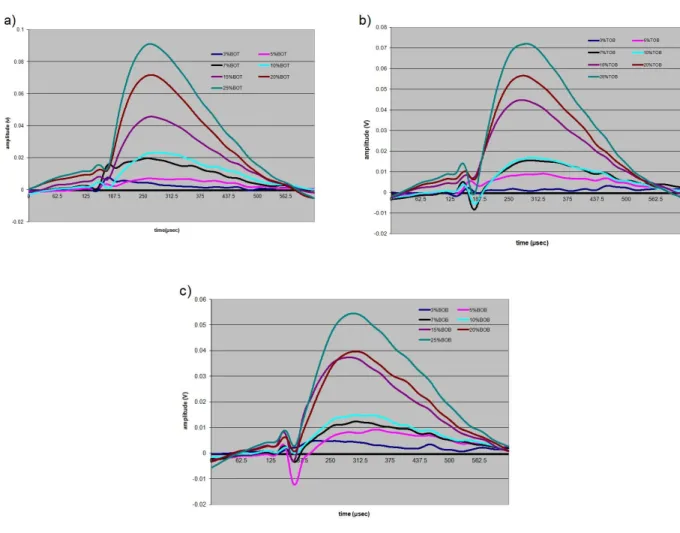
Figure 3.5 Pulsed Eddy Current results from seven different depths (metal-loss defects) placed in three positions. ... 33
Figure 3.6 Subtraction result of defects with different metal loss. (a) Bottom of Top layer (BOT). (b) Top of Bottom layer (TOB). (c) Bottom of Bottom layer (BOB). ... 34
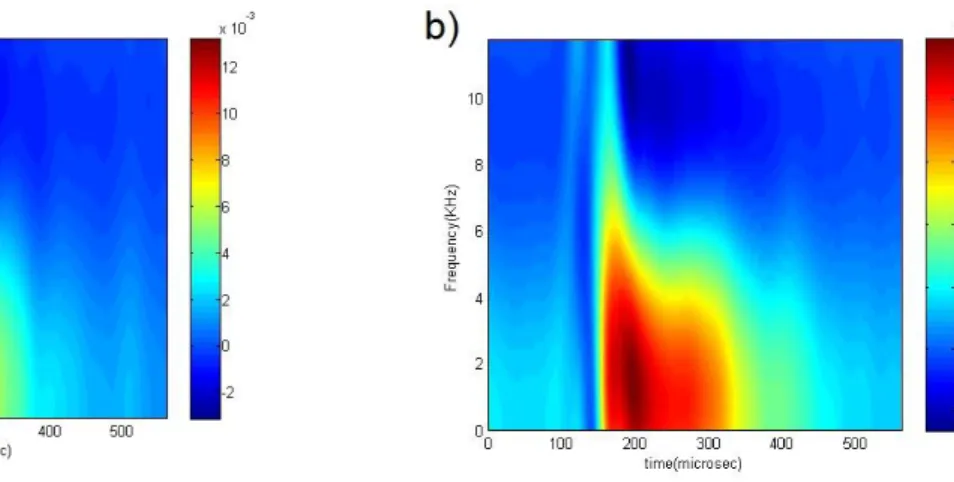
Figure 3.7 Time-Frequency results from defects placed on Bottom of Bottom (BOB) surface. (a) 3% metal loss. (b) 5% metal loss. (c) 7% metal loss. (d) 10% metal loss. (e) 15% metal loss. (f) 20% metal loss. (g) 25% metal loss. ... 36
Figure 3.8 Time-Frequency results from defects placed on the Top of Bottom (TOB). (a) 3% metal loss. (b) 5% metal loss. (c) 7% metal loss. (d) 10% metal loss. (e) 15% metal loss. (f) 20% metal loss. (g) 25% metal loss. ... 38
Figure 3.9 Time-Frequency results from defects placed on Bottom of Top (BOT) surface. (a) 3% metal loss. (b) 5% metal loss. (c) 7% metal loss. (d) 10% metal loss. (e) 15% metal loss. (f) 20% metal loss. (g) 25% metal loss. ... 39
Figure 3.10 Classification of PCA output for defects less than 10% and 10% of thickness metal loss in three different positions (BOB, TOB and BOT). (a) k-mean clustering. (b) EM. ... 41
Figure 3.11 Classification of PCA output for defects with more than 10% of thickness metal loss
in three different positions (BOB, TOB and BOT). (a) k-mean clustering. (b) EM. ... 43
Figure 4.1 Schematic of the sampling under test. (a) Previous study. (b) Current study. ... 50
Figure 4.2 Schematic of the sample under test. (a) 200μm. (b) 150μm. ... 50
Figure 4.3 Designed PEC system. ... 52
Figure 4.4 Diagram of the detection process. ... 52
Figure 4.5 Pulsed Eddy Current results. (a) 200μm. (b) 150μm. ... 54
Figure 4.6 Subtraction result of defects in different situations of metal loss (a) 200μm. (b) 150μm. ... 55
Figure 4.7 Time-Frequency results from 200μm metal loss placed between top and bottom layer. (a) 20% metal loss in Top of Bottom layer. (b) 15% metal loss in Top of Bottom layer and 5% metal loss in Bottom of Top layer. (c) 10% metal loss in Top of Bottom layer and 10% metal loss in Bottom of Top layer. (d) 5% metal loss in Top of Bottom layer and 15% metal loss in Bottom of Top layer. (e) 20% metal loss in Bottom of Top layer. ... 57
Figure 4.8 Time-Frequency results from 150μm metal loss placed between top and bottom layer. (a) 15% metal loss in Top of Bottom layer. (b) 10% metal loss in Top of Bottom layer and 5% metal loss in Bottom of Top layer. (c) 5% metal loss in Top of Bottom layer and 10% metal loss in Bottom of Top layer. (d) 15% metal loss in Bottom of Top layer. ... 58
Figure 4.9 schematic of PCA ... 60
Figure 4.10 Classification of PCA output for 200μm metal loss placed between top and bottom layer. (a) K-Mean Clustering. (b) Dendrogram. ... 61
Figure 4.11 Classification of PCA output for 150μm metal loss placed between top and bottom layer. (a) K-Mean Clustering. (b) Dendrogram. ... 62
Figure 5.1 schematic of sampling test. (a) From above. (b) From side. ... 68
Figure 5.2 Schematic of process levels for inspection ... 69
Figure 5.4 Subtraction result of pulsed eddy current response for synthetic defects with different
amounts of metal loss ... 70
Figure 5.5 Time-frequency representation of synthetic defects located on subsurface. (a) 5%
metal loss. (b) 10% metal loss. (c) 15% metal loss. (d) 20% metal loss. (e) 25% metal loss. ... 72
Figure 5.6 Classification of synthetic defects located on subsurface. (a) K-Means Clustering. (b)
LIST OF ABBREVIATIONS
EM Algorithme de l'Espérance-Maximisation
STFT Short Time Fourier Transforms
PCA Principal Component Analysis
EM Expectation-Maximization
NDT Non-Destructive Testing
LPI Liquid Penetrate Inspection
UT Ultrasound
ECT Eddy Current Testing
PEC Pulsed Eddy Current
EC Conventional Eddy Current
AC Alternating Current
PSD Power Spectral Density
Tzc Arrival Time
Vpk Peak Height
TFD Time–Frequency Distribution
KL Karhunen Loeve Transform
A/D Analog To Digital Converter
FE Feature Extraction
TOB Top Of Bottom
BOB Bottom Of Bottom
GMR Giant Magneto Resistive Sensor
INTRODUCTION AND THESIS OBJECTIVE
Background and Problems
Climate conditions are the most significant cause of corrosion, metal loss and flaws between the layers of aircraft fuselage. Due to continual growth in the number of airlines and flights, the number of aging aircrafts in service is increasing and it is vital to develop accurate and reliable inspection methods for defect detection during their service life. Non-destructive testing (NDT) methods are developed to characterize and detect defects in components without removing them from service, or causing damage to the sample during the testing process. The most common non-destructive testing methods currently used in aviation industries are ultrasound (UT), liquid penetrate inspection (LPI), magnetic particle inspection, radiation and eddy current testing (ECT). Each of these non-destructive testing methods has some advantages and limitations based upon its application. Eddy current testing is an electromagnetic inspection method. The main advantage of eddy current testing over other non-destructive testing methods such as magnetic particle inspection and ultrasound is that the eddy current testing is very sensitive to flaws and defects and it does not need to contact the surface physically. On the other hand, eddy current testing is limited in its ability to inspect ferromagnetic materials and these materials need special treatments to address permeability effects. The eddy current technique is a powerful non-destructive testing method. This method can be applied to conductive materials to inspect physical properties such as thickness variation, surface and subsurface defects and coating characterization. It is also used to measure electrical properties such as conductivity and magnetic permeability. Two types of eddy current techniques are used in non-destructive testing, conventional eddy current (EC) and pulsed eddy current (PEC). In contrast to conventional eddy current testing that a probe is excited under single frequency or multi-frequencies, pulsed eddy current testing uses square or sinusoidal pulsed excitation in a wide range of frequencies. Response signals of pulsed eddy current provide good information describing the condition of interior structures. Pulsed eddy current signals are represented by voltage-time series in the Time domain. Several signal processing and signal treatment methods can be applied to bring out additional hidden information from acquired pulsed eddy current signals.
An automatic defect detection method should be fast, reliable and accurate to determine the position and size of defects in a sample test and a real case study. Pulsed eddy current testing is a fast and reliable inspection method. New signal processing methods can be applied to reduce noise effects and improve accuracy of the inspection.
Objective
The principle objective of this research is to develop a fast, reliable and accurate automatic defect detection using the pulsed eddy current testing method as a non-destructive test for targeted practical inspection and maintenance in avionic industry applications, specifically aircraft fuselages. The first objective of this thesis (objective 1) is to fabricate and optimize a new pulsed eddy current testing system to acquire response signals from multilayer and single-layer aluminum structures under various situations. The results of this part are represented in terms of a transient system response in the time domain. Several time-frequency distributions are implemented and applied as new signal processing and signal treatment methods for pulsed eddy current responses. The second objective (objective 2) is to theoretically and experimentally study the effects of Time-Frequency analysis to compare data representation in the time domain and the time-frequency domain. Time-frequency analysis is applied to reduce the noise effects in acquired pulsed eddy current signals and also reveal more hidden information from signals by representation in joint of time and frequency. The third objective (objective 3) is to study and apply feature extraction methods to time-frequency analysis data to provide new patterns by extracting information from the processed data. The final purpose of this study is to develop an automated process for defect detection in aircraft fuselages with minimal human intervention. Typically, artificial intelligence methods are effectively applied. These artificial intelligence methods are used to predict and determine the locations and sizes of unknown hidden defects in a complicated structure by extracting pertinent information from processed data and comparing it with reference patterns. By processing and treatment of acquired data from an unknown sample, new significant and critical points in data set are extracted. New points will compare with reference patterns. Minimum difference between extracted point from unknown sample and each cluster of reference patterns determines closest condition .It defines as a prediction that how much amount of defect is and where it places.
Organization of the thesis
This thesis is organized as follows:A comprehensive review of the main findings regarding pulsed eddy current testing methods, skin depth theory for pulse excitation and applicable research in the literature is presented in Chapter 1. This section is followed by a literature survey of various time-frequency analysis methods, feature extraction by principal component analysis (PCA) and classification by K-Mean Clustering (discriminative method) and Expectation-Maximization (EM) algorithm (probabilistic method). Chapter 2 summarizes the scientific approach used and explains the coherence between research objectives and the three scientific articles resulting from this work. Chapters 3 to 5 present the three articles which have either been published or been submitted for publication in peer-reviewed scientific journals. Chapter 3 (Article 1) reports on application of Time-Frequency Analysis for automatic hidden corrosion detection in a double-layer aluminum structure using Pulsed Eddy Current. This article mainly focuses on a comparison of common time-domain results of pulsed eddy currents and the application of time-frequency analysis to estimate the location and amount of corrosion and metal losses in a double-layer structure. Chapter 4 (Article 2) deals with metal loss and corrosion detection where defects are placed in overlap conditions. In this article, pulsed eddy current is used as non-destructive testing and time-frequency analysis is applied to represent acquired signals in three dimensions. In Chapter 5 (Article 3), another application of pulsed eddy current and time-frequency analysis method is investigated to determine and estimate thickness variation in single-layer aluminum structure. A new time-frequency analysis distribution is applied during this study. Finally, a general discussion is presented in Chapter 6, while conclusions and recommendations are stated in Chapter 7.
CHAPITRE 1
LITETRATURE REVIEW
Corrosion and cracks are main causes of damage in aircraft fuselages. Many investigations have focused on developing an accurate, reliable and rapid inspection method to predict and determine the locations and sizes of defects in aircraft fuselage where defects are buried between layers in multilayer structures. Pulsed eddy current has been shown capable of reliable and accurate inspection for detection of small-size defects (Sophian, Tian et al. 2001). Before using a pulsed eddy current system for fuselage inspection, it is vital to have a basic understanding of eddy current theory, types of eddy current testing and their specifications and pulsed eddy current testing components. For this reason, eddy current theory is first classified in terms of Faraday and Ampere-Maxwell’s law and penetration depth. Following this, the fundamentals of eddy current inspection which may include conventional eddy current, pulsed eddy current and inductance are discussed.
This background information on pulsed eddy current is followed by a review of pulsed eddy current inspection improvements and developments for hidden defect detection, especially in single-layer and double-layer structures. This information is combined with studies on pulsed eddy current inspections which enable optimization of the condition of experiments and inspection through improvements to the new components specially probes improvement or applying signal processing methods. Finally, a literature survey concerning utilization of time-frequency analysis, feature extraction and classification for automatic inspection incorporating pulsed eddy current testing is presented.
1.1 Eddy Current testing
1.1.1 Physical model of Eddy Current testing
In principal, eddy current acts like a transformer. The probe’s driving coil and the test sample behave like the primary coil and secondary coil of a transformer respectively. A function generator produces an alternating current (AC) and sends it to the probe’s driving coil. According to Ampere’s law, a time-varying magnetic field is generated by AC electrical current and is expressed as follows (Sophian, Tian et al. 2002):
H J J
E (1.1) (1.2)where H is the magnetic field intensity, J is current density, E is the electrical field and σ is the conductivity. The probe moves towards the surface of the conductive test sample. The surface is exposed to a time varying magnetic field and according to Faraday’s law; flow of electric current is induced on the conductive surface due to variations of the field with time. This is expressed as:
0 E B B H (1.3) (1.4)
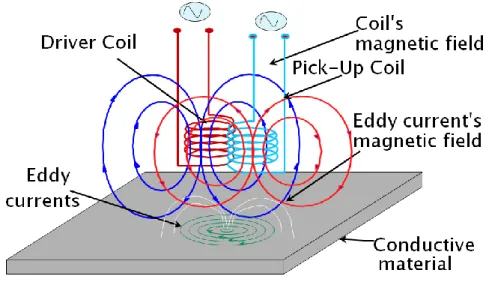
where B is the magnetic field and µ0 is the magnetic permeability of the vacuum. This electric current is known as eddy current or Foucault current. Eddy current is a circulating flow of electrons inside of materials. This current induces a secondary magnetic field that is known as the eddy current magnetic field. According to the Lenz’s law, the direction of the secondary magnetic field is the reverse of the primary magnetic field. Induced eddy current in the conductive material is changed by the presence of metal losses, corrosion, cracks and flaws and consequently the eddy current electromagnetic field changes. A voltage or current in pick-up coil is induced by two types of magnetic fields; eddy current magnetic field and the electromagnetic field from the probe’s driving coil. The probe’s pick-up coil (differential probe) absorbs the two reverse magnetic fields. The coil’s impedance from a non-defected sample is used as a reference signal. Each type of defect is analyzed and inspected by subtracting signals from the defected and non-defected samples. Figure 1.1 shows a schematic of the pulsed eddy current effect and its detection in a metallic structure.
Figure 1.1 a schematic of the pulsed eddy current effect and its detection in a metallic structure.
1.1.2 Penetration depth of transient magnetic field
According to the theory of eddy current, transient magnetic fields penetrate to the bulk of the sample. By increasing the thickness and depth of penetration, the intensity of the magnetic field is reduced. Therefore, the concentration of eddy current decreases with the depth of conductive sample and also the eddy current magnetic field reduces. This means that the eddy current is concentrated on the surface and positions near the surface. For defects located near the surface, inspection and defect detection is done precisely. In contrast, when defects are located in positions far from the surface, penetration of the transient magnetic field drops and the amount of eddy current reduces. Consequently, accuracy and reliability of defect detection is reduced. Effective penetration depth of the transient magnetic field depends on several parameters such as permeability and conductivity of the sample under test, frequency of probe excitation or the circuit time constant.
Penetration depth or skin depth of the transient magnetic field is expressed by the following equations (Krause and Kreutzbruck 2002):
2 1 c T f (1.5) (1.6)
where δ is penetration depth or skin depth of the transient magnetic field, τc is the circuit time constant, µ is the magnetic permeability of the conductive test sample, σ is the electrical conductivity of the sample and f is the excitation frequency of probe. By increasing the excitation frequency, magnetic permeability and conductivity of the material, induced eddy current in the specimen is reduced and consequently, the magnitude of the eddy current magnetic field is decreased. Defects located far from the surface and optimal penetration depth cannot be detected and inspected precisely.
Due to the factors previously mentioned, the high permeability of ferromagnetic materials such as iron, nickel, cobalt and regular steel results in reduced penetration of transient eddy currents into the bulk of the specimen and defect detection is therefore difficult. On other hand, paramagnetic materials such as aluminum, zinc, stainless steel and titanium with lower magnetic permeability can be inspected effectively using eddy current testing methods; high accuracy defect detection is therefore possible at locations farther from the surface.
1.1.3 Conventional eddy current
Conventional eddy current testing or swept eddy current testing (ECT) is a frequency-domain non-destructive method and that collects eddy current data by probe excitation from a single frequency or multi-frequencies excitation from a hundred hertz to mega hertz. The responses of eddy current testing are displayed on plots of system inductance and resistance called impedance plane diagrams. Variations in sample thickness, permeability, conductivity and also the presence of flaws and corrosion cause changes in amplitude and phase of the acquired eddy current signals. In eddy current testing, impedance of the coil is expressed by:
2 ( ) 1 2 5 0 ( , ) 1 ( ) 2 2 L 2 vacuum P r r Z Kj L e d
2 1 2 0 2 2 1 2 1 2 ( ) ( , ) ( ) r r N K L r r P r r xJ x dx
(1.7) (1.8) (1.9)where r1 and r2 are inner and outer diameters of the coil, L is the length of the coil, N is the number of turns in the coil, µ0 is the permeability of the vacuum, ω is exciting angular frequency and J is the Bessel function. Impedance of the coil above a metallic surface is calculated using the following equation: 1 2 2 ( ) ( ) ( ) 2 0 1 2 5 0 0 ( , ) 1 ( ) 2 2 L 2 ( l l ) . metal P r r Z Kj L e e e d
(1.10)where µ is the permeability of the conductive surface. The difference between the coil’s reference impedance (without a sample test) and the coil’s impedance during an experiment with a metal sample is expressed by:
1 2 2 ( ) ( ) 2 0 1 2 6 0 0 ( , ) .( l l ) . P r r Z Kj e e d
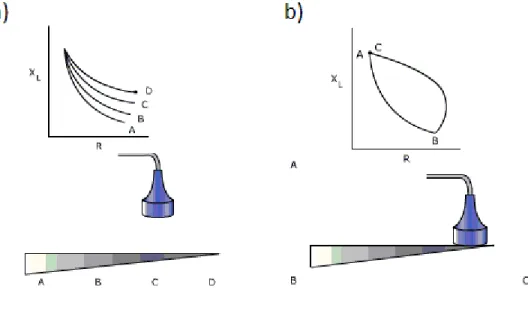
(1.11)Figure 1.2 presents plots of system inductance and resistance during eddy current testing. Figure 1.2(a) shows thickness detection for several points using A-scan detection (point-to-point of metal) for a metallic plate with varying thicknesses. Figure 1.2(b) shows B-scan or line thickness detection from thick to thin state of metal and with a starting point from air.
Figure 1.2 plots of system inductance and resistance by eddy current testing (a) thickness detection in
1.1.4 Pulsed eddy current
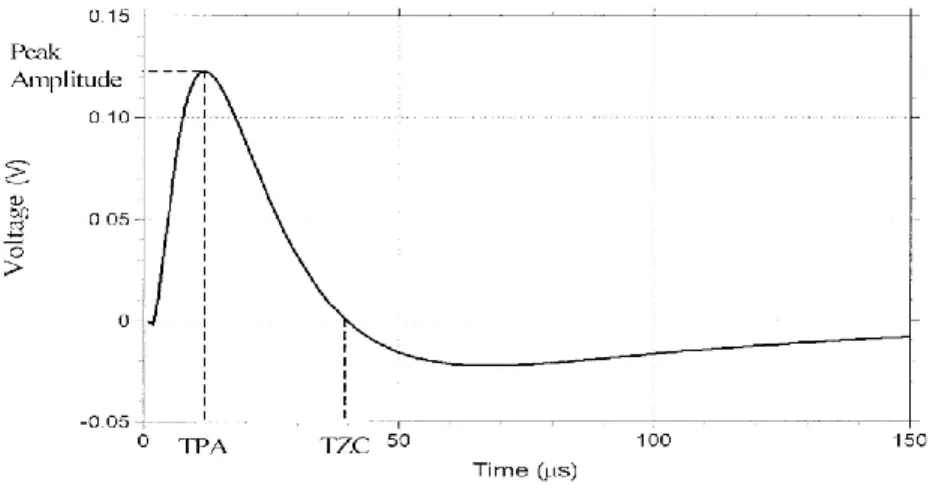
Pulsed Eddy Current (PEC) is an electromagnetic non-destructive method that provides accurate and reliable measurements when used to inspect aircraft body components for corrosion and cracks. The pulsed eddy current technique is a non-contact inspection method and can be applied on surfaces to detect subsurface cracks, metal losses and estimate the thickness. The pulsed eddy current testing method uses pulsed excitation over a wide range of frequencies. In contrast to conventional eddy currents that use harmonic excitation at a single frequency or several frequencies to study transient eddy current signals, the pulsed eddy current testing method applies square or sinusoidal shaped pulse excitation and the probe’s driving coil is excited by repetitive broadband pulses. Pulsed transient excitation over a wide range of frequencies induces scattering eddy currents during sample testing. The broadband nature of Pulsed Eddy Current (PEC) testing allows more penetration than other conventional eddy current methods. Response signals of pulsed eddy current provide good information describing the condition of interior structures. Corrosion, cracks and other defects can be detected by applying signal processing methods on PEC signals. The defects that are closer to the surface excite the pickup coil earlier than defects positioned more deeply. Therefore, a time domain signal can represent the pulsed eddy current response according to depth of defects. The most common features in PEC are peak height (Vpk) and arrival time (Tzc); the former indicates the size of the defect and the latter generally indicates its depth. Variation of defect’s size causes variation of eddy current magnetic field’s amplitude that is represented by changing in amount of maximum amplitude of acquired signal from defects place. Additionally the point of crossing the time axis by acquired signal shows place of defect which place how far from surface of sample or surface of probe. These features are not sufficient to discriminate signals due to corrosion because presence of internal and external noise resources. Figure 1.3 shows time-to-peak and time-to-zero of a voltage-time series data for pulsed eddy current response.
Figure 1.3 Pulsed eddy current response (Giguere, Lepine et al. 2001).
1.2 Signal Treatment
Pulsed Eddy Current inspection is one of the powerful non-destructive techniques that can be applied to assure safe and economic inspection of aircraft components and sub-assemblies. The presence of internal and external noise sources (such as low amounts of defects for internal and interlayer gap and lift off for external noise resources) necessitate use of a signal processing method incorporating mathematical models to improve the performance of the pulsed eddy current inspection (obtained features are not good enough for discriminating corrosion) so that it can detect and measure the size of corrosion and cracks in metallic multilayer components. Advanced signal processing methods are introduced to extract the maximum information contained in the pulsed eddy current signals and also to represent signals in a joint time-frequency analysis to provide better representation of signals. In this thesis, time-frequency analysis methods are discussed in both linear and quadratic representations. In case of hidden defect detection, Rihaczek distribution will be used to process signals and represent them in three dimensions representation. Rihaczek distribution is applied because of minimum amount of crossing effect or interference and also this distribution represents signal in real positive value. In case of thickness variation detection, a spectrogram is used as a bilinear time-frequency representation. Spectrogram shows acquired pulsed eddy current signals in three dimensions.
1.2.1 Linear Time-Frequency Representations
The linearity principle is satisfied by linear time-frequency distributions. The linearity principle is referred to as the superposition principle. This means that the time-frequency representation of a linear combination of several signal components is equal to the same linear combination of the time-frequency representation of each signal component:
1( ) 2( )
1( )
2( )
T ax t bx t aT x t bT x t (1.12)
where T denotes any linear transformation, a and b are scalar constants and ( )x t ’s are the signals. Gabor representation, Wavelet transform and Short-time Fourier transform are three well-known linear time-frequency representations. Fourier transform is a mathematical tool which is used to reveal the frequency domain of signals. For signal x(t) in the time domain, Fourier transform X(f) is expressed by:
2
( ) ( ) j ft
X f x t e dt
(1.13)where f is frequency and t denotes time.
1.2.1.1 Short Time Fourier Transform
The frequency contents of signals is determined by Fourier transform but any further information about the time at which each frequency component takes place cannot be provided by Fourier transform. To overcome this shortcoming, Fourier transform can be applied to a respectively short portion of the signal (analysis window) around the instantaneous time t. Then by ceaselessly moving toward the window along the time axis, a joint time-frequency representation of the signal can be obtained. This transform is called the Short Time Fourier Transform (STFT) and mathematically is expressed by:
2
( , ) ( ) ( ) j ft
t
S t f
x t w t t e dt (1.14)where (w t t) is the window function or analysis window. The choice of analysis window has a dominant influence on the results of the Short Time Fourier Transform (STFT). At time t the frequency components appearing in the representation are in fact the frequency components
of the selected window around that instant. Therefore, in order to have a good time resolution the analysis window must be chosen as short as possible. At the same time, choosing a short analysis window leads to poor frequency resolution.
1.2.2 Quadratic time-frequency distributions
In time-frequency analysis, the estimation of energy distribution or instantaneous power spectra of the signals is provided by bilinear representations which are known as quadratic time-frequency representations. In contrast to linear time-time-frequency distributions, the linear principle is not satisfied by quadratic distributions. This means that a quadratic representation of signals which combine linearly is expressed as follows:
2 1 2 1 1 2 * 2 2 1 2 * 2 1 ( ) ( ) ( ), ( ) ( ), ( ) ( ), ( ) ( ), ( ) T ax t bx t a T x t x t b T x t x t ab T x t x t a bT x t x t (1.15)where T denotes any transformation, a and b are scalar constants, ( )x t ’s denote signals in time, T x x and ( , )1 1 T x x are called auto terms and two other remaining terms are called ( ,2 2) cross terms or interference terms.
1.2.2.1 Spectrogram
A spectrogram is defined as the squared magnitudes of the short time Fourier transform: 2
Spec STFT (1.16)
Although the spectrogram is nonlinear, the final results of this distribution have no interference terms or cross-term effects. This stems from the fact that nonlinearity is not an instinctive feature of this transform and comes into effect while squaring the magnitude. That together with simplicity, robustness and ease of interpretation, have made the spectrogram a popular tool for many applications (Boashash 2003).
The spectrogram represents an attempt to apply the Fourier transform to a short-time analysis window, within which the signal is expected to be reasonably stationary. The underlying idea is that, by moving the analysis window along the signal, variations of the signal spectrum are
captured as a function of time. However, similarly to STFT, the spectrogram is not the best choice for analyzing rapidly varying signals. If the analysis window is chosen short enough to capture rapid changes in the signal it becomes impossible to resolve frequency components of the signal which are close in frequency. The spectrogram distribution is a Real-valued, time shift invariance and frequency shift invariance distribution.
1.2.2.2 Wigner-Ville distribution
The Wigner-Ville distribution is represented by real values. Shift invariance and marginal condition exist in time and frequency representation of Wigner-Ville distribution. Wigner-Ville scales time and frequency and works based on instantaneous frequency. Wigner-Ville distribution supports finite time and finite frequency. This distribution follows Moyal's formula and Fourier transform and also it has convolution invariance and multiplication invariance.
The Wigner-Ville distribution possesses many desirable mathematical features and is defined as: * 2 1 1 1 ( , ) ( ) ( ) 2 2 2 j f W t f x t x t e d
(1.17)In contrast to the spectrogram distribution, the Wigner-Ville distribution provides high resolution in time and frequency simultaneously and there is no trade-off between time and frequency resolution. The main limitation of the Wigner-Ville distribution is that its energy distribution is not non-negative and it often contains severe cross terms, or interference terms between components in different (t, f) regions, potentially leading to confusion and misinterpretation. Additionally, the Wigner-Ville is considered a noise-sensitive time-frequency distribution. In general, if noise exists at a small finite time of the signal, that noise will appear at other times. Also, if the signal is infinite, then it will appear for all times. The other severe drawback is that the Wigner-Ville distribution at a particular time generally reflects properties that the signal has at other times because the Wigner-Ville distribution is highly non-local. Moreover, in general the Wigner-Ville distribution is not zero when the signal is zero, and this causes considerable difficulty in interpretation.
1.2.2.3 Rihaczek distribution
The Rihaczek distribution is represented by complex and positive values. Shift invariance and marginal condition exist in time and frequency representation of Rihaczek distribution. The Rihaczek distribution scales time and frequency. The Rihaczek distribution supports finite time and finite frequency. This distribution follows Moyal's formula and Fourier transform and also it has convolution invariance and multiplication invariance.
In time-frequency analysis, the Rihaczek distribution allows the energy of a complex deterministic signal over a finite range of time and frequency to become infinitesimal. The obtained result is called a complex energy distribution. The interaction energy between a signal x restricted to an infinitesimal interval δt centered on t, where x passes through an infinitesimal band pass filter δfil centered on f, can be approximated by the following expression:
* 2
[ ( ) ( ) j ft].
t fil x t X f e
(1.18)
This representation was derived by considering the local energy of the signal that passes through an infinitesimal time window centered at time t and an infinitesimal pass band filter centered at frequency f. The result is a complex energy density at point (t, f) from which the definition of the distribution is obtained:
* 2 * 2 ( ) ( ) j f ( ) ( ) j ft RD x t x t e d x t X f e
(1.19)The Rihaczek distribution can be interpreted as a complex energy density at point( , )t v with elements of Cohen's class written as f f( , ) e2j f .
The Rihaczek distribution is a bilinear time–frequency distribution (TFD) and is a member of Cohen’s class. It is covariant to shifts in time and frequency. The Rihaczek distribution is always zero when the signal is zero. It also perfectly localizes impulses and sine waves.
Many time-frequency analysis methods abandon any sort of analogy to physical phenomena with negative and complex values. The complex energy density in the Rihaczek distribution overcomes the problem of missing phenomena by using only the real part of the energy and trends the energy to the standard and real amount.
1.2.3 Feature Extraction
Time-frequency methods provide very large amounts of data and it is necessary to remove redundant data and reduce the dimensions of the data set. Principal component analysis (PCA) is a method that creates new features and reduces the size of the data set.
1.2.3.1 Principal Component Analysis (PCA)
Principal Component Analysis (PCA) is also known as the Karhunen Loeve (KL) transform or the Hotelling transform. It is based on factorization techniques developed in linear algebra. PCA uses factorization to transform data according to statistical properties to optimize and reduce the amount of redundant data. This data transformation is particularly useful for classification and compression. The main advantage of PCA is generation of independent features.
In PCA processing, the covariance of the input data (ΣX) is calculated:
{( )( ) }T
x E x x x x
. (1.20)
Eigenvalues λ and Eigenvectors Wi are identified using covariance of the time-frequency results ΣX.
(I x) 0. (1.21)
(I x)Wi 0. (1.22)
Where, I is an identity matrix of the same order as ΣX. Transformation W maps each features
vector define as input CX into features of output CY.Transform features CY are obtained using
CX .WT. The new features are linearly independent.
The output of time-frequency analysis for each Pulsed Eddy Current signal is an n×n matrix that can be represented by an image. The matrix is expressed as n2 dimensional vectors. The value of each vector corresponds to the intensity value of each pixel of the time-frequency analysis image. The image contains a large amount of redundant data. Principal Component Analysis (PCA) is applied as feature extraction to reduce the number of parameters and also improve computational efficiency of the classifier.
PCA computes Eigenvalues and Eigenvectors of the covariance matrix. The Eigenvectors are arranged in order of largest Eigenvalues. The first Eigenvector has the direction of the largest variance of the data and it determines the direction of the most significant amount of energy. Principal Component Analysis retains the significant features (Eigenvectors with largest Eigenvalues) and leaves out some less expressive features. PCA reduces the number of parameters without loss of significant information.
1.2.4 K-Means Clustering and Expectation-Maximization Algorithm (EM)
K-means is one of the unsupervised learning algorithms that solves the clustering problem. The K-means algorithm is based on use of the squared Euclidean distance as the measure of dissimilarity between a data point and a prototype vector. K-means separates n observations intoK clusters, for which each observation (data point) belongs to the cluster with the nearest mean.
The K-mean algorithm consists of two major parts; (1) review all the data and reassign data to the closest selected centers (centroid), (2) make a loop and recalculate the center points to find the nearest centroids. The K-mean algorithm partitions a set of n observations (x1, x2, ... ,xn) into k clusters S=[S1,S2, … , Sk] to minimize the square error function;
1 arg min j i k j i i x S x
. (1.23)where; μi is the mean of Si.
The Expectation-Maximization (EM) algorithm is a powerful probabilistic classifier method for finding the maximum likelihood solution parameters for unobserved latent variables S. A set of n observations and a vector of unknown parameters θ are used to calculate the maximum likelihood.
,
,
S
L n p n
p n S . (1.24)EM is an iterative method, alternating between performing an expectation E step and a
maximization M step. The E step computes the expectation of the log-likelihood and evaluated responsibilities (posterior probabilities) for the latent variables.
, t log
; ,
t S n Q E L n S . (1.25)The M step (Maximization) re-estimates parameters (means, covariance and coefficients). The expected log-likelihood is achieved in the E step.
1
arg max t t Q . (1.26)1.3 Review of the application of pulsed eddy current in defect and
thickness detection
A comprehensive review of the literature on the subject of pulsed eddy current testing and pulsed eddy current signal treatment is well beyond the scope of this thesis. Here, the focus is on previous studies on the application of pulsed eddy current for defect detection in metallic plates and also hidden defect detection and thickness detection. A short description is given for each study where its relevancy to works presented in this thesis is provided in the corresponding chapters.
As previously mentioned, time-to-peak and time-to-zero are two main features of pulsed eddy current signals which are used in defect and thickness detection of metallic plates (Lebrun, Jayet et al. 1997; Sophian, Tian et al. 2003). Zhou et al (2010) (Zhou, Tian et al. 2010) applied principal component analysis as a feature extraction method to two main features of a pulsed eddy current response. They sorted acquired responses to find a relationship between thickness variation in a single-layer system and the amplitude and location of points where the pulsed eddy current response curves cross the time axis. They found that by increasing the thickness of the sample, the signal amplitude increases and the location of the peak on the time axis decreases.
Another feature was investigated and used by Tian et al (2005) (Tian and Sophian 2005). They presented a new feature called rising point time. They expressed that rising point time is independent of coil dimensions and it is able to determine the depth of defects regardless of the shape or type of defects. It is applicable to determine lift-off effect in thickness detection in single-layer structures. By using the rising point time as a new feature, measurement of thickness
is faster than using the two general features of pulsed eddy current (peak and time-to-zero).
Lift-off effect is a noise effect in pulsed eddy current testing. Lift-off reduces accuracy of the inspection (Le Bihan 2002). Several parameters have been studied to remove the effect of lift-off. Giguere et al (2000 & 2001) studied the effect of lift-off in defect detection in a multilayer structure and determined the effect and amount of lift-off in a flawless multilayer sample (Giguere, Lepine et al. 2000; Giguere, Lepine et al. 2001). Mandache et al (2006) (Mandache and Lefebvre 2006) implemented a new algorithm to calculate the amount of lift-off and to remove it from acquired pulsed eddy current signals. By computing the slope of pulsed eddy current signals at different amounts of lift-off, they calibrated and estimated the amount of lift-off. Tian et al (2004) used normalization and also two reference signals to reduce the effect of lift-off in pulsed eddy current inspection (Tian and Sophian 2005). Two reference signals, first from air and a second from a non-defected sample were used. They calculated two types of subtractions; subtraction of the reference signals (which come from air and non defected sample to calculate total amount of eddy current magnetic field) and also subtraction of the defected signals from the reference signal which come from a non-defected sample. The results were then normalized. Another subtraction between two results of subtraction (first between acquired signal from air and non defected sample, second between acquired signal from defected sample and non defected sample) is done and results are normalized. Their results show that by using this method, the lift-off effect can be removed in thickness detection of a single-layer system.
In pulsed eddy current signal acquisition, efficiency of the probe is one the important effects. An efficient and reliable probe provides non-noisy and clear results. Several types of probes have been developed and used in pulsed eddy current inspection. The most well-known probes are the Hall probe, the giant magneto resistive sensor (GMR) and the differential probe (He, Luo et al. 2010; He, Luo et al. 2010). Ewdards et al (2006 & 2008) (Edwards, Sophian et al. 2006; Edwards, Sophian et al. 2008) designed a new dual-probe system containing electromagnetic acoustic transducers (EMATs). Their dual probe was able to detect and measure the size of surface and subsurface defects in a conductive material. They used the dual probe to inspect a single-layer structure with 150 mm thickness. They combined results of two-type inspection to provide a more accurate thickness measurement. Shin et al (2009) (Shin, Choi et al. 2009) used a differential pulsed eddy current probe to measure thickness variation in the presence of lift-off in
a single-layer system. The giant magneto resistive probe is a powerful probe in field of eddy current testing. Kim et al (2010) (Kim, Yang et al. 2010) used this probe to detect cracks at rivet sites in the third layer of an aircraft fuselage. Sophian et al (2002) (Sophian, Tian et al. 2002) designed a new probe with an inductive flat coil and a magnetic field. They used a Hall device probe, which possesses a much wider magnetic field. They used this probe to size defects in a double-layer structure.
Several studies have focused on using new approaches and features for defect detection and defect classification and also thickness variation detection by pulsed eddy current testing in multilayer and single-layer structures. Park et al (2009)(Park, Angani et al. 2009) (Park, Angani et al. 2009) used the frequency domain and calculated the power spectral density (PSD) of pulsed eddy current signals. They calculated RMS value, energy of pulse and PSD of pulsed eddy current signals to describe thickness variation in stainless steel which had been covered by insulation. Safizadeh et al (2001) (Safizadeh, Lepine et al. 2001) applied a time-frequency analysis method as an alternative to improve signal representation using three-dimensional representations. They used the Wigner-Ville distribution as a time-frequency distribution to represent signal in three dimensions. Their results showed that time-frequency analysis can be applied as a powerful tool to reveal hidden information in the time domain and frequency domain. Additionally, by applying the time-frequency distribution for pulsed eddy current signal treatment, external noise effects such as lift-off and interlayer gap can be removed or reduced. Interlayer gap and lift-off provide patterns in images of time-frequency analysis that can be filtered. Finally, they were able to obtain a clear result for multilayer defect detection. In another study, Safizadeh et al (2005) (Safizadeh, Liu et al. 2005) used their procedure for automatic defect detection in multilayer structures. They extracted data from time-frequency results and then used a neural network (NN) model to classify extracted data.
Feature extraction and defect classification are two main parts of each automatic defect detection method and non-destructive testing. In many of the research papers reviewed, principal component analysis (PCA) is the first and main choice for feature extraction. Among the many researchers, Yang et al (2009) (Yang, Tian et al. 2009) used independent component analysis (ICA) as a feature extraction method for classifiers in pulsed eddy current testing. They applied ICA to project the pulsed eddy current signals of different defects in the independent component subspace. They used ICA’s results to discriminate defects. Lang et al (2007) (Lang, Agurto et al.
2007) used the Fisher discriminative model as a new model to classify defected and non-defected samples. They extracted new patterns for defected samples and trained the system using a sample case. Then, they compared test results with a training sample. Although their results show good separation and automatic defect detection, we applied their methods and our results did not match theirs because defect distribution in our samples is too close and we have a large number of defects in different locations.
The above discussed studies are the basic studies done in the field of pulsed eddy current testing. Other works are very much in line with the above studies. The main common points among these investigations are that they did not compare close amounts of defects and their distribution in multilayer samples. Instead, they simply discussed one type of metal loss in a single-layer or double-layer system. Also, new feature and signal treatment methods were not discussed during their experiments. These two drawbacks are revisited in this thesis.
CHAPITRE 2
SCIENTIFIC APPROACH AND COHERENCE OF
ARTICLES
The principal aim of this work was to develop a fast, reliable and accurate automatic defect detection method based on use of pulsed eddy current testing as a non-destructive test for targeted practical inspection and maintenance of structures used in avionic industries, specially aircraft fuselages and aluminum multilayer structures. To reach this goal, different signal processing and treatment methods were necessary to improve the representation from pulsed eddy current signals. Following this, two-step data mining techniques were implemented to extract significant features from processed and treated data and also to classify each case of synthetic defects separately. Figure 2.1 shows the procedure used in this thesis for automatic defect detection and data mining of pulsed eddy current signals. A new pulsed eddy current testing system was designed, fabricated and optimized to acquire reliable and accurate response from multilayer and single-layer aluminum structures in various situations. Among several time-frequency distributions, the most effective time-frequency analysis method was chosen to process the pulsed eddy current signals. Extracting the features and classification are done to provide a map and new patterns for defect classification and presentation.
This research work was done with the collaboration of Professor Aouni Lakis from École Polytechnique de Montreal. This research was supported by the collaborative research and development grant (No. CRDPJ-335472-05) of Natural Sciences and Engineering Research Council of Canada (NSERC), Pratt & Whitney Canada, Bombardier Aeronautics and National Research Council of Canada (NRC).