HAL Id: tel-00827686
https://tel.archives-ouvertes.fr/tel-00827686
Submitted on 29 May 2013HAL is a multi-disciplinary open access archive for the deposit and dissemination of sci-entific research documents, whether they are pub-lished or not. The documents may come from teaching and research institutions in France or abroad, or from public or private research centers.
L’archive ouverte pluridisciplinaire HAL, est destinée au dépôt et à la diffusion de documents scientifiques de niveau recherche, publiés ou non, émanant des établissements d’enseignement et de recherche français ou étrangers, des laboratoires publics ou privés.
Measurement and correction of aberrations in light and
electron microscopy
Jonas Binding
To cite this version:
Jonas Binding. Measurement and correction of aberrations in light and electron microscopy. Optics [physics.optics]. Université Pierre et Marie Curie - Paris VI; Ruprecht-Karls-Universität Heidelberg, 2012. English. �NNT : 2012PAO66145�. �tel-00827686�
Dissertation
submitted to the
Combined Faculties for the Natural Sciences and for Mathematics
of the Ruperto-Carola University of Heidelberg, Germany
for the degree of
Doctor of Natural Sciences
and to the
Université Pierre et Marie Curie of Paris, France
Speciality Physics
(ED 389 - La Physique de la Particule à la Matière Condensée) for the degree of
Docteur de l’Université Pierre et Marie Curie
Put forward by
Diplom-Physiker Jonas Rolf Hans Binding
born in Heidelberg, GermanyMeasurement and correction of aberrations in light and
electron microscopy
Examining committee:
Prof. Dr. Matthias Bartelmann Jury member
Prof. Dr. Claude Boccara Thesis advisor France; invited jury member Dr. Laurent Bourdieu Jury member
Prof. Dr. Winfried Denk Thesis advisor Germany Prof. Dr. Rainer Heintzmann Referee
Prof. Dr. Agnès Maître Jury member Prof. Dr. Rasmus Schröder Jury member
Abstract (English)
Imperfections in image formation, called aberrations, often preclude microscopes from reaching diffraction-limited resolution. Aberrations can be caused either by the microscope itself or by the sample and can be compensated for by using an active element integrated into the beam path which is functioning as a corrector. The optimal settings for this corrector need to be determined without excessive damage to the sample. In particular, for sensitive biological samples, the potential gain for signal and/or resolution needs to be weighed against sample damage.
Here I present the development of a special type of optical coherence microscopy (called deep-OCM), which allows the precise determination of the average rat brain refractive index in vivo. The conclusion is that two-photon microscopy is affected by optical aberrations in this sample starting at depths around 200 µm. Deep-OCM is well suited for imaging myelinated nerve fibers. Individual fibers can be visualized in the living brain in unprecedented depths beyond 300 µm.
In the second part of this thesis I describe the development and testing of an auto-focuser and auto-stigmator (called MAPFoSt) for a scanning electron microscope to ensure optimal imaging quality after switching samples or during long acquisition series. MAPFoSt determines the three focus and stigmation parameters from only two test images.
Keywords: Adaptive Optics, Wavefront, Refractive Index, Myelin, Optical Coherence Microscopy, Autofocus, Phase Diversity
Résumé (français)
1La diffraction constitue une limite fondamentale en microscopie, mais souvent cette limite n’est même pas atteinte. Des imperfections dans la formation d’image, appelées aberrations, peuvent être induites par le microscope ou l’échantillon. Un élément actif, dit correcteur, est intégré au chemin optique pour leur compensation. Les paramètres de ce correcteur doivent être déterminés sans dommage excessif pour l’échantillon. Il faut comparer le gain en signal et/ou en résolution avec cet endommagement, surtout pour des échantillons biologiques fragiles.
En première partie de cette thèse je présente une modalité particulière de la microscopie par cohérence optique (nommé deep-OCM). Ce développement a permis la mesure exacte et in vivo de l’indice de réfraction moyen du cerveau du rat. Cette valeur implique que la microscopie bi-photonique est limitée par des aberrations optiques à partir d’une profondeur de 200 µm dans ce type d’échantillon. Le deep-OCM est bien adapté à l’imagerie de fibres nerveuses myélinisées. Des fibres individuelles peuvent être visualisées in vivo dans le cerveau à des profondeurs auparavant inaccessibles, supérieures à 300 µm.
Dans la deuxième partie de cette thèse je présente le développement d’un autofocus et auto-stigmateur (nommé MAPFoSt) pour le microscope électronique à balayage qui permet d’assurer la qualité maximale des images lors d’un changement d’échantillon ou pendant des séries d’acquisitions de longue durée. MAPFoSt permet de déterminer avec précision les trois paramètres du focus et du stigmatisme en utilisant seulement deux images de test.
Mots clés : optique adaptative, front d’onde, indice de réfraction, myéline, microscopie par cohérence optique, autofocus, diversité de phase
Zusammenfassung (deutsch)
Abbildungsfehler, so genannte Aberrationen, verhindern in der Mikroskopie häufig das Erreichen einer beugungsbegrenzten Auflösung. Aberrationen können durch Unzulänglichkeiten im Mikroskop verursacht sein, oder andererseits durch die Probe selbst. Zur Korrektur wird ein aktives Element in den Strahlengang integriert. Insbesondere für empfindliche biologische Proben müssen jedoch die Parameter des Korrektors bestimmt werden, ohne die Probe zu sehr in Mitleidenschaft zu ziehen; daher muss der mögliche Gewinn an Signalstärke und/oder Auflösung gegen die Schädigung der Probe abgewägt werden.
Im ersten Teil dieser Arbeit beschreibe ich die Entwicklung einer speziellen Form der optischen Kohärenzmikroskopie (genannt deep-OCM), die die exakte Bestimmung des mittleren Brechungsindex des lebenden Rattenhirns erlaubt. Daraus ergab sich, dass die Zwei-Photonen-Mikroskopie für diese Probe spätestens ab 200 µm Tiefe durch optische Aberrationen limitiert ist. Deep-OCM eignet sich zur Abbildung von myelinisierten Nervenfasern. Einzelne Fasern können im lebenden Gehirn in bisher unerreichbarer Tiefe von über 300 µm dargestellt werden.
Im zweiten Teil dieser Arbeit präsentiere ich die Entwicklung und Charakterisierung eines Autofokus und Autostigmators (genannt MAPFoSt) für ein Rasterelektronenmikroskop, der nach Probenwechsel oder bei langen Aufnahmeserien die optimale Abbildungsqualität sicherstellt. MAPFoSt ermöglicht es, mit nur zwei Testbildern die drei Fokus- und Stigmationsparameter zu bestimmen.
Schlagworte: Adaptive Optik, Wellenfront, Brechungsindex, Myelin, Optische Kohärenzmikroskopie, Autofokus, Phase Diversity
This thesis was carried out as a cotutelle project with enrollment at the Ruperto-Carola University (Heidelberg, Germany) and the Université Pierre et Marie Curie (Paris, France). The research was done at the Institut de Biologie de l'Ecole Normale Supérieure (Paris) under the supervision of Dr. Laurent Bourdieu, at the Institut Langevin, ESPCI ParisTech under the supervision of Prof. Dr. Claude Boccara and at the Max Planck Institute for Medical Research (Heidelberg), Germany, in the department of Biomedical Optics under the supervision of Prof. Dr. Winfried Denk. I have conducted the experiments myself, except when noted otherwise, and prepared the dissertation myself. All resources used (literature, equipment) are specified.
Parts of this dissertation have been published in:
1. BINDING, J., BEN AROUS, J., LÉGER, J.-F., GIGAN, S., BOCCARA, C. & BOURDIEU, L. (2011). Brain refractive index measured in vivo with high-NA
defocus-corrected full-field OCT and consequences for two-photon microscopy. Opt. Express 19(6), 4833-4847.
2. BEN AROUS, J., BINDING, J., LÉGER, J., CASADO, M., TOPILKO, P., GIGAN, S., CLAUDE BOCCARA, A. & BOURDIEU, L. (2011). Single myelin fiber imaging in living rodents without labeling by deep optical coherence microscopy. J. Biomed. Opt. 16(11), 116012.
3. BINDING, J., S. MIKULA, S. & DENK, W., Low-dosage Maximum-A-Posteriori Focusing and Stigmation (MAPFoSt), submitted.
Contents
1 Introduction ... 13
1.1 We want to image the brain ... 13
1.2 Optical aberrations cause imperfect imaging ... 13
1.3 Aberrations can be thought of as a phase term on the wavefront ... 14
1.4 Many imaging systems can be limited by aberrations ... 15
1.4.1 Wide-field microscopy ... 15
1.4.2 Confocal microscopy ... 16
1.4.3 Two-photon microscopy ... 16
1.4.4 Structured illumination microscopy ... 17
1.4.5 PALM/FPALM/STORM ... 17
1.4.6 Stimulated emission depletion ... 18
1.4.7 Optical coherence tomography ... 18
1.5 Astronomy uses direct wavefront measurement ... 19
1.5.1 Why direct wavefront sensing is hard in microscopy ... 20
1.6 The sample refractive index sets the scale for aberrations ... 21
1.7 Our refractive index measurements led us to develop deep-OCM ... 21
1.8 Deep rat brain imaging is limited by aberrations ... 22
1.9 Image analysis allows indirect wavefront measurement ... 22
1.9.1 Metric-based, imaging-model-agnostic methods ... 22
1.9.2 Metric-based modal wavefront sensing ... 23
1.9.3 Pupil segmentation ... 24
1.9.4 Phase diversity ... 26
2 Deep-OCM ... 29
2.1 Details of the setup ... 29
2.2 Animal preparation and treatment ... 30
2.4 Importance of defocus correction for high-NA OCT and OCM ... 32
3 Myelin imaging with deep-OCM ... 35
3.1 Deep-OCM shows myelin ... 36
3.1.1 Sensitivity to fiber orientation ... 41
3.2 Imaging myelin fibers in vivo in cortex ... 41
3.3 Myelin imaging in the peripheral nervous system ... 43
3.4 Discussion ... 46
4 Rat brain refractive index ... 49
4.1 Introduction ... 49
4.2 Measuring refractive index using high-NA OCT ... 50
4.2.1 OCT signal strength is sensitive to refractive-index-induced defocus ... 50
4.2.2 Dispersion and high NA complicate the refractive index measurement ... 52
4.2.3 Modeling the image formation process in high-NA OCT ... 54
4.2.4 Assuming a dispersion function allows calculation of the refractive index ... 56
4.2.5 Choosing a suitable metric increases penetration depth ... 57
4.3 Results ... 58
4.3.1 Rat brain refractive index as a function of rat age ... 58
4.3.2 Importance of dispersion and high NA ... 60
4.4 Discussion ... 61
4.4.1 A model of defocus in OCT taking high NA and dispersion into account ... 61
4.4.2 Value and (non-)dependence of brain refractive index ... 61
4.4.3 Limits to the measuring precision ... 63
4.4.4 Potential systematic errors ... 63
4.4.5 Comparison with recent measurements ... 63
5 Consequences of brain refractive index mismatch for two-photon microscopy ... 65
5.1 Discussion ... 67
6.1 Introduction ... 69
6.2 Materials and methods ... 71
6.2.1 The MAPFoSt algorithm ... 71
6.2.2 Data analysis ... 84
6.2.3 Experiments ... 85
6.2.4 Simulating image pairs ... 86
6.3 Results ... 86
6.3.1 Simulations show bias-free aberration estimation ... 87
6.3.2 SEM imaging experiments ... 93
6.4 Discussion ... 104
7 General Discussion ... 109
7.1 Correcting aberrations adds complexity ... 109
7.2 Defocus correction in high-NA OCM is worth it ... 109
7.3 Two-photon rat-brain imaging suffers from spherical aberration ... 110
7.4 The race is still on ... 110
8 Acknowledgements ... 113
9 Appendices ... 115
9.1 Deep-OCM motor placement ... 115
9.2 Derivations for MAPFoSt ... 117
9.2.1 Calculating the MTF and its derivatives ... 117
9.2.2 Calculating the MAPFoSt posterior and profile posterior ... 119
9.3 The heuristic SEM autofocus and auto-stigmation algorithm ... 121
9.4 Modal wavefront sensing for SEM ... 122
10 Literature ... 125
11 List of Acronyms ... 131
1 Introduction
1.1 We want to image the brain
To many people the brain is the most fascinating organ of the human body, and much of its function still escapes our understanding. Since fundamental advances in understanding are often brought about by the availability of new techniques, our aim is not only to study the brain, but also improve upon the existing imaging techniques.
While there is a lot of work being done in neuronal cell culture and organotypic brain slices, there is an increasing interest in observing the circuits of the brain in vivo, putting severe accessibility and environmental constraints on the experimental apparatus. Even when considering organisms much smaller than humans, e.g. common lab animals such as mice or rats, the brain has a diameter of many millimeters, while individual functional units such as dendritic spines can have diameters below 100 nm (Harris & Kater, 1994), requiring experimental procedures spanning several orders of magnitude in size. Blood vessels are found throughout the brain, blocking visible access to regions behind them (Haiss, et al., 2009). Visible light is strongly scattered by blood vessels, with the mean free path between scattering events as low as a few hundred microns (Vo-Dinh, 2003). In such an environment it is clear that for a thorough understanding, a multitude of observational methods should be combined, for example pharmacological studies, electrophysiology, and different imaging modalities such as magnetic resonance imaging, light microscopy and electron microscopy.
1.2 Optical aberrations cause imperfect imaging
Imaging is the predominant form of data collection in natural science. Images are well adapted for further processing by the human mind, allowing quick hypothesis testing even before resorting to complex mathematical analysis methods. It provides a highly intuitive representation of raw experimental findings from the sub-nanometer scale to the scale of millions of light years, for example scanning probe microscopy such as scanning tunneling microscopy (Binnig, et al., 1982b; Binnig, et al., 1982a) on one extreme and astronomic imaging of galaxy clusters (for example George, et al., 2009) on the other.
Most imaging systems rely on particle beams or electromagnetic radiation, which is focused by an optical system (Figure 1-1a) on some type of detector. In either case, imperfect focusing can lead to sub-optimal images which reduces the amount or quality of information obtained.
Even though post-processing can often boost the remaining information to make it more visible, and analysis might still allow experimenters to answer the underlying scientific questions, information that is not contained in the initial images cannot be restored.
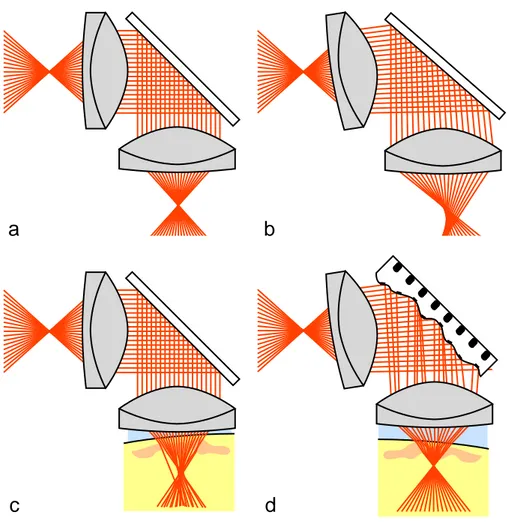
The reasons for imperfect imaging are generally referred to as optical aberrations. Aberrations can be caused by imperfections in the components of the imaging system, by misalignment of these components (Figure 1-1b) or by sources outside the experimenter’s control such as the sample itself (Figure 1-1c).
Figure 1-1. a) perfect imaging system, b) misaligned system, c) system with sample-induced aberrations, d) system with aberration correction
1.3 Aberrations can be thought of as a phase term on the wavefront
An aberration-free imaging system in geometric optics approximation would focus the entire signal from one object point onto one point on the detector (Figure 1-1a), corresponding to a spherical wavefront in wave optics leading to a diffraction-limited focus. All deviations of the
a
b
particle paths or light rays causing them not to reach their common detector point are considered aberrations. In the wave optics case, this corresponds to deviations of the wavefront from the spherical shape. Since the wavefront is the surface of constant phase of a wave, the aberrations can most simply be expressed as the phase difference between the optimum spherical reference surface and the actual wavefront. This phase term can be used to calculate the point spread function (PSF) of the aberrated system (Sheppard & Cogswell, 1991; Born & Wolf, 1999).
1.4 Many imaging systems can be limited by aberrations
For several hundred years, microscopes and telescopes were limited by imperfections in lens and mirror production. With improving manufacturing techniques, astronomers were the first to acknowledge that eventually their telescopes would be limited by a component out of their control: atmospheric turbulence. The rapid changes in refractive index of the atmosphere due to moving air aberrate the images taken by all ground-based telescopes and limit their achievable resolving power (Hardy, 1998).
In ophthalmology, the imperfections of the human cornea make diffraction-limited imaging of the retina equally difficult (Dreher, et al., 1989; Liang, et al., 1994).
In free space communications, near-earth atmospheric fluctuations limit feasible signal transmission distances, energy efficiency and data rates (Levine, et al., 1998).
In electron microscopy, changing microscope parameters such as beam current and electron landing energy can require a realignment of astigmatism and change the working distance, inducing defocus.
In light microscopy of three-dimensional samples, refractive index fluctuations of superficial sample layers can aberrate images of deeper layers (Figure 1-1c). The exact influence of aberrations depends on the type of microscope and will now be discussed briefly for different systems.
1.4.1 Wide-field microscopy
In classic wide-field microscopy of thick samples, classical aberrations are of little consequence, since blurred, out-of-focus regions dominate the signal degradation. In other words, even if there are no aberrations present, this technique is inherently limited by the lack
of optical sectioning and is therefore, in its standard form, only used for thin sections and moderately thick samples.
3D deconvolution wide-field microscopy aims to remove said out-of-focus light. To do this correctly, it can be important to take the increase of aberrations with depth into account during the deconvolution (Hanser, et al., 2001). The most common example of a spatially variant PSF is a PSF changing with imaging depth; imaging into a sample with refractive index mismatch causes defocus (axial focus shift) and spherical aberration to increase with depth.
Since deconvolution is unavoidable in this system, it is unclear if adding a physical wavefront correction scheme would be a large benefit.
1.4.2 Confocal microscopy
In confocal microscopy, a collimated laser beam is focused into the sample, where it excites fluorophores and/or is partially reflected, or scattered, everywhere along the double cone traversed by the light. For detection, the geometrical focus is imaged onto a small aperture, the confocal pinhole, which blocks the majority of out-of-focus light from the detector while letting most light from the focal region through. If the sample and immersion medium match the specifications of the objective with respect to the refractive index, confocal microscopy allows diffraction-limited imaging and a non-paraxial wave optics theory is needed to describe the imaging properties and possibly even the full vectorial theory at extremely NA (Richards & Wolf, 1959).
Aberrations in the excitation path will decrease the density of excitation light in the focal volume, while aberrations in the detection path will cause light from the geometrical focus to be spread over an area larger than the pinhole. Both effects thus decrease the detection efficiency of the microscope, on top of the resolution decrease caused by the aberrations. 1.4.3 Two-photon microscopy
In two-photon laser scanning microscopy (2PLSM; Denk, et al., 1990), a femtosecond-pulse laser beam is focused into the sample exactly like in confocal fluorescence microscopy, except that the laser is now run at a wavelength suitable for two-photon absorption by the fluorophore, i.e. roughly twice the wavelength of the one-photon absorption spectrum used in a normal confocal microscope. Since the cross-section for two-photon absorption depends
quadratically on the local light density, fluorophore excitation is confined to the vicinity of the focus where sufficient densities are reached during the femtosecond laser pulse. Detection can either collect all light at the emission wavelength of the fluorophore, or spatially filter using a pinhole exactly as in confocal microscopy. While the latter case maximizes resolution at shallow depths, the former is often preferable for deep imaging since it allows detection of photons that were scattered one or several times on their way to the detector.
In non-confocal two-photon microscopy, only aberrations on the excitation path are important for image resolution. Since two-photon microscopy relies on the precise temporal structure of the light pulse, both dispersion and optical aberrations can decrease the signal strength by spreading out the light density in the focal volume temporally (Andegeko, et al., 2009) or spatially (Jacobsen, et al., 1994).
1.4.4 Structured illumination microscopy
In Structured illumination microscopy (SIM), a spatial pattern of light is projected into the sample, which allows separation of focal-plane light from out-of-focus light by demodulating the signal using the illumination structure. Some aberration modes are highly detrimental to the illumination structure and therefore degrade the images very strongly. Other aberration modes modify the PSF in a way that preserves the illumination structure, causing much less degradation to image quality. (Débarre, et al., 2008)
1.4.5 PALM/FPALM/STORM
In (F)PALM/STORM (Betzig, et al., 2006; Hess, et al., 2006; Rust, et al., 2006), the positions of all fluorophores in a sample are mapped out by not exciting them all at the same time, but using switchable or activatable fluorophores which are imaged sequentially, allowing their respective positions to be determined with a precision far beyond the size of their focal spots. 2D PALM/STORM generally only needs to determine the center of mass (COM) of each focal spot. If aberrations blur the focal spot, its COM might be shifted slightly, for example due to coma. However, if the PSF remains spatially invariant this is an inconsequential global shift. As long as different fluorophores which emit simultaneously are far enough apart to be separated, the technique is insensitive to aberrations, except for the decreasing precision in COM position determination.
3D PALM/STORM often determines z-position from the shape of the PSF, making it highly sensitive to PSF-shape-changing aberrations. A counter-example is biplane FPALM (Juette, et al., 2008), which only requires a correct estimate of the axial (i.e. laterally integrated) PSF, greatly reducing the number of aberration parameters that need to be estimated. What’s more, biplane FPALM would be directly suitable to implement phase diversity using the images from the two planes.
1.4.6 Stimulated emission depletion
In stimulated emission depletion (STED) microscopy, the excitation beam focus is superimposed with a doughnut-shaped STED laser beam, which depletes the excited fluorophore state by stimulating emission at its particular wavelength (Hell & Wichmann, 1994; Klar, et al., 2000). The signal detected in the rest of the emission spectrum of the fluorophore thus originates only from the very center of the excitation focal volume, where the STED beam intensity is close to zero. The final resolution of the system depends on the steepness of the STED beam intensity gradient around the zero.
Aberrations can decrease the excitation intensity around the central zero of the STED beam, can cause the STED beam zero to become misaligned with the excitation beam and/or distort the STED beam so as to decrease the intensity gradient. The exact effect depends both on the aberration mode, and on the phase profile used for the STED beam (Deng, et al., 2010). 1.4.7 Optical coherence tomography
Optical coherence tomography (OCT) is an imaging technique where backscattered light from different depths is discriminated interferometrically (Fujimoto, et al., 1995; Fercher, 1996; Tearney, et al., 1996). This can be done, for example, by selecting only signal from a fixed depth using a white light source (i.e. short temporal coherence) with a modulation of the reference arm and lock-in detection of the modulated signal. This allows two- and three-dimensional imaging using the local backscattering coefficient as a source of endogenous contrast. In particular for full-field OCT (Beaurepaire, et al., 1998; Dubois, et al., 2002; Vabre, et al., 2002), the microscope objective and the sample constitute one arm of a Linnik interferometer. Lateral resolution is dominated by the resolving power of the objective, while axial resolution can either be dominated by a confocal-like effect (for high numerical aperture (NA) and long coherence length) or by the coherence length (when it is short and the NA is low).
In high-NA variants of OCT, some of which are referred to as Optical Coherence Microscopy (OCM; Izatt, et al., 1994), signal strength is sensitive to defocus – in contrast to most other epi-detection microscopes, which are only sensitive to higher aberration modes. When the reference arm length defining the imaging depth does not match the focus depth of the objective, the confocal effect decreases signal and resolution. Higher order aberrations can, in principle, also play a role but are often strongly dominated by defocus.
1.5 Astronomy uses direct wavefront measurement
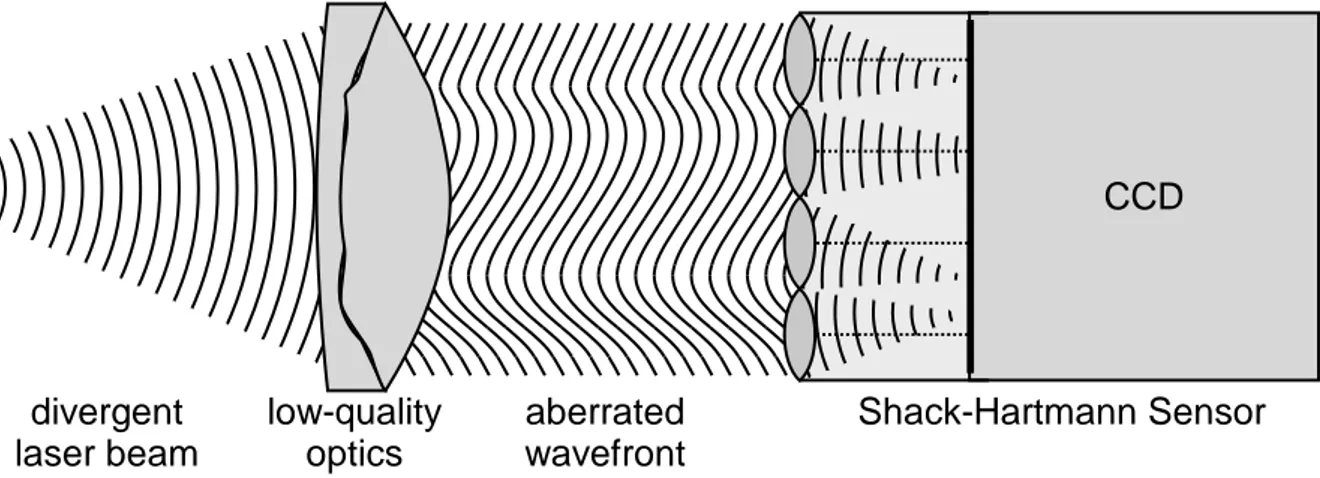
Several methods have been developed over the years to determine the aberrations present in an optical wavefront. For individual optical components such as lenses, one can analyze their imperfections by passing light from a collimated laser beam or from a point source through the component, causing its aberrations to be imprinted in the beam wavefront. This wavefront can then be analyzed using a Shack-Hartmann-Sensor (Hartmann, 1900; Shack & Platt, 1971), a pyramid sensor (Ragazzoni, 1996), a curvature sensor (Roddier, 1988) or an interferometer such as a Twyman-Green interferometer (Twyman & Green, 1916) or a shearing interferometer (Bates, 1947).
Figure 1-2. The wavefront of a laser beam (far left) is aberrated by a low-quality optical component (center left), which is analyzed using a Shack-Hartmann Sensor (right) consisting of a lenslet array and a CCD.
These methods (except interferometry) are generally also applicable to measuring atmospheric aberrations using the light coming from an individual star of sufficient brightness, or from an artificial guide star created by exciting fluorescence in high atmospheric layers using a strong, focused laser beam (Tyson, 1997). Similarly in ophthalmology, a test beam reflected off of the retina can generate a test beam containing the
CCD Shack-Hartmann Sensor aberrated wavefront low-quality optics divergent laser beam
aberrations (Prieto, et al., 2000). In fluorescence microscopy it might sometimes be possible to introduce a strongly fluorescent test bead near the region(s) to be imaged and use its fluorescence signal with one of the above methods (Azucena, et al., 2011), but the introduction of beads is certainly not a universally feasible option.
1.5.1 Why direct wavefront sensing is hard in microscopy
Unfortunately, none of these methods seem particularly suited for determining the optimal wavefront for focusing inside three-dimensional biological samples where subsequent optimized imaging at different depths can be required. The root of the problem is that different layers of the sample will generally participate in any wavefront measurement, presenting the wavefront sensor not with one clean wavefront, but with a superposition of a multitude of wavefronts, which cannot be separated and which hinder each other’s measurement. While the Shack-Hartmann sensor has been successfully adapted to laterally extended objects for solar adaptive optics (Rimmele & Radick, 1998), dealing with wavefronts from different depths in the sample is not possible with this method.
To separate wavefronts coming from different depths in biological samples, coherence gated wavefront sensing (CGWS) has been developed, where an interferometer illuminated by a broad-band spatially coherent source performs depth discrimination of backscattered light, phase shifting is used to reconstruct the complex field and a virtual Shack-Hartmann sensor is used for phase unwrapping (Feierabend, et al., 2004; Rueckel, et al., 2006). While this technique has proven successful for measurement of aberrations when imaging through the skull of transparent zebrafish, it is relatively complex to implement on an existing microscope. What’s more, it requires a scattering sample with a random distribution of scatterers, but scattering must be weak enough for single scattering to still be dominant in the depths where aberrations are to be measured (Binding & Rückel, in preparation).
For deep brain imaging in rodents, the short scattering length seems to place a severe limitation on the usefulness of CGWS. In particular, the speckle size of the coherence-gated electromagnetic field decreases quickly with penetration depth (Markus Rückel and Jinyu Wang, both private communication). Initial tests optimizing two-photon fluorescence signal in the rodent cortex with a deformable mirror by manually optimizing spherical aberration and lowest-order astigmatism did not show significant improvements (Binding, 2008). It was therefore unclear whether optical aberrations do not play a significant role in this system, or whether they are just complicated to measure and to correct.
1.6 The sample refractive index sets the scale for aberrations
Microscope objectives used in light microscopy are optimized to be used at a fixed sample refractive index, for example for the refractive index of air (n = 1.0), water (n = 1.33), glycerol (n = 1.47) or oil (n = 1.515). For any sample not matching the refractive index that the objective was designed for, the refractive index mismatch will induce aberrations. For a flat surface orthogonal to the optical axis, only rotationally symmetric aberrations can exist, i.e. defocus and (all orders of) spherical aberrations. For the general case of a flat or non-orthogonal surface, other aberrations will also be present.
The aberrations increase in severity with the imaging depth in the sample and with the difference in refractive indices. To estimate in which depths they become a problem, it is therefore important to know the refractive index of the sample. However, in vivo measurements of the refractive index n' for brain tissue did not previously exist in the literature.
1.7 Our refractive index measurements led us to develop deep-OCM
An OCT-based technique to measure n' had been described (Tearney, et al., 1995) which seemed applicable to in vivo brain measurements in lab animals. It can provide OCT brain images at the same time as measuring the average refractive index. However, in its existing form, the method used by Tearney and colleagues used low numerical aperture objectives, limiting the attainable measurement precision. From previously published ex vivo values for brain refractive index (Table 4-1) we estimated that Tearney’s method could only determine the water-brain refractive index mismatch with 30 to 70% error. The theoretical framework was not sufficiently developed to correctly deal with effects of group velocity dispersion or high numerical apertures.
We therefore implemented the OCT-based refractive index measurement on a full-field OCT (ff-OCT) setup using high-NA objectives to improve measurement precision.
Ff-OCT is physically very similar to CGWS and therefore, as a side-effect, allowed us to learn how to maximize the attainable penetration depths in both ff-OCT and CGWS. We combined several depth-improving features in our ff-OCT setup and called the resulting method deep-OCM, which is described in chapter 1.
We found that deep-OCM is capable of visualizing individual myelinated axons in the upper layers of the somatosensory cortex. Using the same setup, the general structure of myelin in
nerve bundles in the peripheral nervous system (PNS) can also be visualized. Myelin imaging in both systems is presented in chapter 1.
Finally, we used this setup to measure the refractive index of the somatosensory cortex of seven rats in vivo, taking both dispersion and the high NA into account in data analysis. This work is described in chapter 1.
1.8 Deep rat brain imaging is limited by aberrations
The consequences of the measured refractive index for imaging the rat brain are discussed in chapter 1. Using two-photon imaging as an important example of deep in vivo imaging, it is found that imaging depth is severely limited by spherical aberration. Based on this information, we have started to implement a new CGWS-based system to measure aberrations in the rat brain at the Institut Langevin; the project is currently pursued by post-doc Jinyu Wang (Wang, et al., 2012) and will not be discussed in detail here.
1.9 Image analysis allows indirect wavefront measurement
Due to the lack of a generally usable direct wavefront sensing approach for microscopy, and the inherent complexity of the interferometric approach of CGWS, considerable interest has been focused on indirect methods for determining the wavefront.
The general principle is to use the effects of aberrations on the images to determine the best possible aberration correction. Using an active element in the beam path, known aberrations are deliberately added before recording each image. The analysis then concentrates on how these additional known aberrations, called test aberrations, modify the images. The same active optical element is generally used for creating the test aberrations and for aberration correction, so often no other hardware modifications are needed in the system. This is in sharp contrast to direct wavefront measurement which invariably adds extra hardware, such as an extra light path for a Shack-Hartmann sensor (SHS) or an interferometer.
Currently existing methods of wavefront measurement through image analysis can be classified into one of four categories: imaging-model-agnostic methods, metric-based modal wavefront sensing, pupil segmentation, and phase diversity.
1.9.1 Metric-based, imaging-model-agnostic methods
In some cases, an imaging system is not well understood and there is no theoretical model describing how aberrations will affect the imaging process. However, a metric can be defined
which quantifies image quality and which takes its maximum for aberration-free images. For example, image contrast and image sharpness are two common metrics. In such cases, metric-based but imaging-model-agnostic methods have been demonstrated to improve image quality, such as hill climbing (Marsh, et al., 2003), genetic search (Sherman, et al., 2002) or simulated annealing (Zommer, et al., 2006).
The downside of these methods is that they can be rather slow to converge to a solution, and there is no way to verify whether a solution they found is truly optimal or whether the algorithm is stuck in some local maximum. In fact, the lack of a model can prevent any theoretical analysis of the range of convergence. Conversely, if a model does exist, using a metric-based imaging-model-agnostic approach discards information which can be used to speed up convergence, as will be described below.
1.9.2 Metric-based modal wavefront sensing
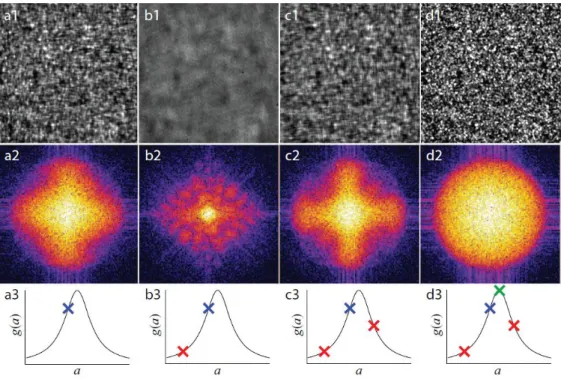
An imaging-model-based approach developed by the Wilson group is called modal wavefront sensing (Debarre, et al., 2007) (Neil, et al., 2000; Débarre, et al., 2008; Débarre, et al., 2009) and is described briefly in the appendix (chapter 9.4). It is also metric-based, reducing each test image acquired with given test aberrations to one metric value, as above. However, in contrast to the imaging-model-agnostic methods, the imaging model is used to determine an orthogonal set of test aberration modes which act independently on said metric, allowing the determination of the optimum aberration correction from only three test images per mode as long as aberrations are small enough (Figure 1-3). The orthogonality ensures that each parameter is determined independently of the other parameters, leading to non-iterative (one-step) convergence.
While such an approach allows a simple and stable implementation of the aberration correction scheme once the set of test aberration modes has been determined, it still throws away some information due to the use of one single metric, which is chosen heuristically amongst a large number of possible choices, many of which could yield additional complementary information.
Figure 1-3. General procedure of modal wavefront sensing for one mode. Three test images of the speckle pattern (a1, b1, c1) taken while modifying one specific aberration mode are the Fourier transformed (a2, b2, c2) to c alculate their respective metric values (a3, b3, c3). The knowledge of the shape of the metric curve (solid line) allows the determination of the optimal value for that mode (d1, d2, d3). This figure was taken from (Debarre, et al., 2007), reprinted by permission from Optical Society of America: Optics Express, copyright 2007.
1.9.3 Pupil segmentation
A radically different approach has been proposed under the name of pupil segmentation (Ji, et al., 2009). Here, the test aberration used in the pupil plane of the microscope objective is not a phase modulation, but a spatial amplitude modulation. By exciting fluorescence not through the full pupil, but through different subregions of it (using small beamlets instead of the full laser beam) and acquiring a separate two-photon image with each beamlets, laterally shifted low-resolution images can be acquired (Figure 1-4). The exact amount of lateral shift for each subregion is determined through image cross-correlation and gives an estimate for the average wavefront tilt on that region. In a sense, this method can be described as an inverse Hartmann test, where it is not an aberrated outgoing wavefront which is spatially subdivided to determine local wavefront tilts, but rather the unaberrated incoming excitation laser beam. One disadvantage of this approach is that the reduced excitation NA requires a high laser power and significantly decreases the sectioning ability of the microscope, making it prone to
cross-talk from bright fluorescent objects in planes close to the desired focus (Heintzmann, 2010).
Figure 1-4. Sketches illustrating pupil segmentation adaptive optics using three independent subregions, creating three beamlets (blue rays). (a) Aberrated wavefront (red) due to refractive index inhomogeneities (orange) leads to an aberrated image of a reference bead. (b, c, d) Images acquired with the left, center, and right subregions, respectively, permit the tilt of each beamlet to be measured from the displacement of the bead. (e) Beamlets intersect at a common point, after appropriate compensatory tilts are applied at the SLM. (f) Interference of left beamlet with central reference beamlet, at several phase offsets (green sinusoids) applied to the former, determines the optimal phase offset (dashed aqua line); (g) Same procedure applied to the right beamlet. (h) Final corrected wavefront (red) and recovered diffraction-limited focus. This figure was taken from (Ji, et al., 2009), reprinted by permission from Macmillan Publishers Ltd: Nature Methods, copyright 2009 .
While the relative shift of the individual low-resolution images clearly gives the dominant and most-easily-analyzed information about the aberrations present in the images, it seems that, for example, the relative sharpness of the different images could also contain some information about higher order aberrations. A theoretical investigation of the information efficiency of pupil segmentation is still lacking, but it seems clear that not all available information is being used.
A more recent method called pupil-segmentation with full-pupil illumination (Milkie, et al., 2011) is actually a metric-based, zonal approach where they reverted from amplitude modulation to the more common phase modulation. It uses total image intensity as its metric and performs sequential 2D tip-tilt scans of different segments of the wavefront to determine the optimal tip/tilt in each region. While this mitigates the reduced excitation NA of their previous approach, a huge number of small-area test images needs to be taken, for example more than 3000 when using 32 pupil segments and testing 14x14 tip-tilt combinations for each pupil segment, as in one of their examples. As before, the choice of one single metric is bound to neglect a certain amount of information present, and there is no evidence that the heuristic choice of test aberrations made here is in any way superior to the test aberrations derived in modal wavefront sensing.
1.9.4 Phase diversity
While in principle most of the above methods are phase diversity techniques in that they record several images with test aberrations that only change in phase, the term is commonly used in a more limited sense.
The general principle of phase diversity is simple: given a small set of test images containing different (usually phase-only) test aberrations, determine the actual aberrations which are coherent with all test images at once. In other words, images are not reduced to metric values for further data analysis, but the full information content of different images is combined to find the most likely form of all aberration modes.
The exact implementation of phase diversity differs, with many heuristic approaches in microscopy over the years, for example in electron microscopy (Ogasawara, et al., 1998; Ong, et al., 1998; Baba, et al., 2001) and wide-field light microscopy (Hanser, et al., 2003; Hanser, et al., 2004).
For astronomical applications, a maximum likelihood (ML) approach had already been proposed much earlier (Gonsalves, 1982; Paxman, et al., 1992), but until now had little impact on aberration estimation in microscopy, possibly due to its increased mathematical complexity and the lack of interaction between the fields.
Compared to heuristic approaches, the maximum likelihood approach has the advantage of making best use of the available data. This is important, for example, for the biological brain samples analyzed in SBEM (Brickman et al), which mandate the lowest dose of electrons per area possible. For low-NA imaging of two-dimensional objects the work by Paxman and colleagues is, in principle, directly applicable to microscopy.
To demonstrate the power of the concept, we have implemented phase diversity on our scanning electron microscope, experimental results of which will be discussed in chapter 1. However, the computational burden of Paxman’s algorithm and in particular the number of Fourier transforms required makes the use of large images routinely acquired in electron microscopy with sizes of 512 x 512 pixels and above prohibitively slow. Using the fact that the electron optics can be described geometrically and only defocus and astigmatism can be corrected, we were able to considerably speed up the algorithm and decrease the number of Fourier transforms necessary to a bare minimum. We call this modified algorithm Maximum A Posterior Focus and Stigmation (MAPFoSt) and show its ability to use extremely large, low-dose test images for defocus and astigmatism determination, while keeping the processing time reasonable. As the name suggests, we also investigated how the algorithm can use prior knowledge about aberrations and/or the object to improve the estimates, leading to a maximum-a-posteriori instead of maximum-likelihood method. Such prior knowledge could consist of upper bounds on aberration coefficients, based either on properties of the microscope or of the sample. It could also reflect the knowledge of the general distribution of aberration values and/or object structure from previous experiments.
2 Deep-OCM
2We developed deep-OCM from a combination of several improvements to full-field OCT (Beaurepaire, et al., 1998; Dubois, et al., 2002; Vabre, et al., 2002) which optimized the system both for in vivo refractive index measurements and high-resolution imaging at high depths. To reduce scattering, near infrared instead of visible light was used, requiring an InGaAs-based camera as a detector (Sacchet, et al., 2008). The camera was also chosen for its high full well capacity and for its fast image repetition rate. To improve lateral resolution (Dubois, et al., 2002) and improve refractive index measurement precision (see Chapter 4 or Binding, et al., 2011), high NA objectives (NA = 0.8) were used. Both the sample and the objective were motorized to allow our custom-written software algorithm to automatically correct defocus as described below. To minimize motion artifacts in the images, animals were only held by a metal plate glued to their skull directly surrounding the imaging region, while resting loosely on a heating blanket.
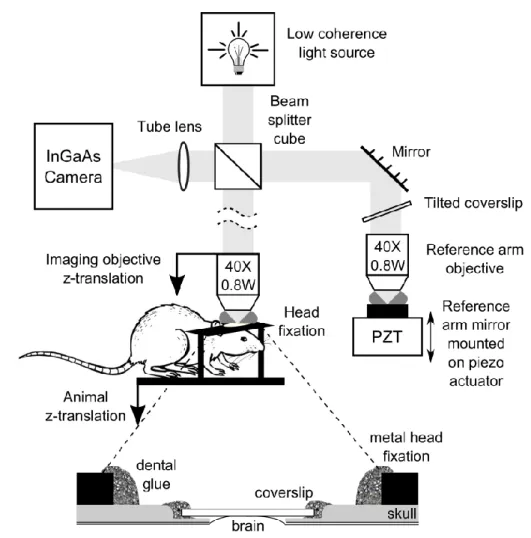
2.1 Details of the setup
The microscope (Figure 2-1) consisted of a low coherence light source (250W halogen lamp), with the standard Köhler microscope illumination, a Linnik interferometer (i.e. a Michelson interferometer with an objective in each arm), a tube lens and an InGaAs camera. The water immersion objectives used were Zeiss IR-Achroplan 40×/0.8W. The effective spectral bandwidth of the optical system, including the spectrum of the light source, the optical components (as well as water used for immersion) and the detector was centered on = 1100 nm and had a full width at half maximum (FWHM) of around 170 nm. For dispersion correction, a cover slip identical to that protecting the rat’s cortex (see below) was placed in the reference arm of the interferometer. To avoid the reflection caused by this coverslip hitting the camera, the coverslip was tilted slightly. A 50cm doublet was used as a tube lens to image the sample and the reference arm mirror onto the InGaAs camera (Xeva-1.7-320,
2 Large parts of this chapter are taken almost verbatim from B
INDING,J., BEN AROUS,J., LÉGER,J.-F., GIGAN,S., BOCCARA,C. & BOURDIEU,L. (2011). Brain refractive index measured in vivo with high-NA defocus-corrected full-field OCT and consequences for two-photon microscopy. Opt. Express 19(6), 4833-4847.
Xenics Infrared Solutions, Leuven, Belgium). The sensor chip had 320x256 pixels and was operated at its maximum frequency of 66 Hz, triggered by a NI 6722 digital I/O board (National Instruments, Austin, Texas) and controlled by the software, LightCT (LLTech, Paris). Both the sample z-position and the relative arm length could be changed with two motorized linear stages (M-VP-25XA, Newport). A synchronized rectangular 33 Hz signal drove the Piezo Linear Stage Actuator (PI P-753.11C, Physik Instrumente [PI] GmbH, Karlsruhe) onto which the reference arm mirror was mounted. The amplitude of the piezo actuator position change was adapted to /4, producing a change in reference arm length of
/2. Taking the difference of subsequent camera images would therefore separate the interference signal (more exactly: the projection of the interfering electromagnetic field onto the real axis) from the background light, implementing a two-step phase stepping protocol. LightCT running on a standard PC allowed real-time display of these OCT images at 33 Hz. For some experiments for myelin imaging with increased field of view, Olympus UMPlanF 10×/0.3 W objectives and a silicon camera (Pantera 1M60, Dalsa,Waterloo, Canada) were used. The effective spectrum in this case was centered on 775 nm and had a FWHM of 150 nm. This configuration is referred to as "deep red OCM", in contrast to the "IR deep-OCM" mode using the InGaAs camera.
2.2 Animal preparation and treatment
All animal manipulation and surgical procedures were in accordance with the European Community guidelines on the care and use of animals (86/609/CEE, CE official journal L358, 18th December 1986), French legislation (décret no. 97/748, 19th October 1987, J. O. République française, 20th October 1987), and the recommendations of the CNRS.
Three 3-week-old (P20-21; weight ~80g), two 6-week-old (P45-46; weight ~250g) and two 12-week-old (P86-87; weight ~400g) male Wistar rats were included in this study. Rats were anesthetized by urethane injection (1.5 g/kg). Supplementary doses of urethane were applied when necessary. The body temperature of the animal was held at 38°C by a heating blanket during the surgery and the imaging. Animals were maintained in a stereotaxic frame during the surgical procedure. A craniotomy (~3 mm in diameter) centered over the somatosensory cortex was performed on the rat’s left hemisphere and the dura mater was removed. The craniotomy was sealed with a 5mm diameter coverslip, which was glued onto the thinned skull surrounding the hole. Thinning was performed to bring the coverslip in close contact with the brain of the animal, in order to prevent movement of the brain during the imaging
procedure. For ff-OCT imaging, the animal was stabilized with a metal holder glued to its skull (Figure 2-1). At the end of the experiments, rats were injected with a lethal dose of urethane.
Figure 2-1. Ff-OCT setup and sample preparation. Light from a low -coherence source enters a Linnik interferometer. The sample arm consists of a microscope objective and of the sample, both of which are translatable along the optical axis by two motorized linear translation stages. The animal is held by a metal head fixation plate glued to its skull around the craniotomy, which consists of a cover slip glued onto the thinned bone around the actual opening, where the brain tissue comes into direct contact with the cover slip. The reference arm consists of a folding mirror, a cover slip to compensate for dispersion from the cover slip on the rat brain, an objective identical to the sample objective and a reference mirror mounted on a piezo actuator for phase-stepping. The focal planes of both objectives are imaged using a lens doublet serving as tube lens onto an InGaAs camera. The piezo, camera and both motorized stages are controlled by a standard PC running Light -CT software.
2.3 High-speed in vivo rat brain imaging shows blood flow
The camera in our system was fast enough to take the two images needed for optical sectioning before the respiration and heartbeat caused the cortex to move more than a small fraction of a wavelength. Even the movement of individual red blood cells in thin veins as well as the movement of leukocytes on the surface of larger vessels at the brain surface could be observed in real time with our OCT imaging frequency of 33 Hz (Figure 2-2 as well as Movie 1 & Movie 2).
Figure 2-2. Single-frame excerpts from ff-OCT video recordings of surface blood vessels in rat cortex. (Left/Center, Movie 1) large vessel of a p46 rat; 6.6 Hz frame rate; produced from a 33 Hz video by averaging 5 ff -OCT images each to increase signal to noise. In the upper left hand corner the tissue surrounding the vessel can be seen; passing from lower left to upper center individual leukocytes can be seen moving slowly along the vessel wall (one of them is marked with a white arrow). The right half of the field of view shows the interior of the vessel where objects move too rapidly to be resolved individually. In the lower center of the field of view, the vessel wall descends into the coherence volume so that leukocytes can be seen as if through a semi -transparent wall. (Right, Movie 2) junction of two blood vessels joining in the cortex of a p21 rat. 33H z frame rate, taken without any averaging. In the upper vessel, an individual object can be seen which moves much slower than the surrounding blood, possibly due to interactions with the blood vessel wall.
2.4 Importance of defocus correction for high-NA OCT and OCM
Most scanning OCT systems are inherently limited to extremely low NA objectives, since their axial scan range is limited by the depth of field of the objective. In ff-OCT the sample is moved relative to the objective for z-scanning, so the scan range is only limited by the working distance of the objective and not by its NA. Higher NA can be used to increase the lateral resolution, so we chose objectives with an NA of 0.8. Even higher NAs are in principle usable, but a pair of identical objectives with larger NA and sufficiently long working distance was not available to us.
As explained in more detail below, a new problem arises with medium and high NA objective ff-OCT systems when the refractive index of the sample does not perfectly match the refractive index of the immersion medium. When imaging deeper layers, the additional optical path difference causes the coherence volume to move out of the depth of field of the objective; this defocus considerably decreases OCT signal (an effect also called “confocal effect of OCT”, see Sheppard, et al., 2004) and limits imaging depth when uncorrected. To remove defocus, we implemented an automatic reference arm length scan which kept the imaging plane fixed inside the sample while moving the coherence volume. The optimal reference arm length was taken to be the one maximizing the total OCT signal.
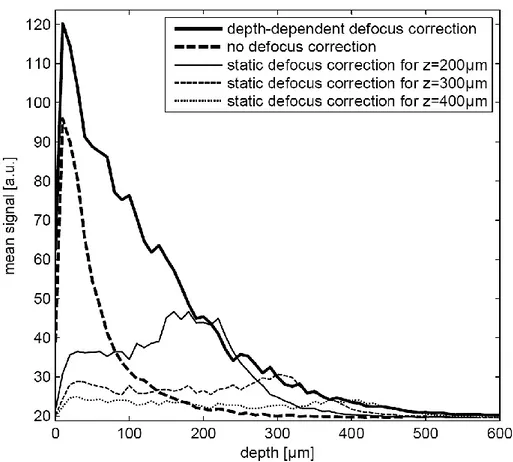
Without defocus correction (i.e. at fixed reference arm length optimized on the cover glass), only 10% of the signal above background remains at around 120µm imaging depth (Figure 2-3, black dashed line). However, optimizing the reference arm length to compensate defocus at 200 µm imaging depth, we were able to recover signal more than twice as strong (Figure 2-3, gray solid line). Optimizing at 300 and 400 µm imaging depth (Figure 2-3, gray dashed and dotted lines), we found new optimal reference arm lengths which again boost signal strength by more than a factor of two. As expected, these reference arm lengths were only optimal in the vicinity of the depths where they were determined and cause low signal levels when used for imaging near the surface.
During the refractive index measurement we found that optimal reference arm length actually varied linearly with depth inside tissue (see chapter 1). This implied that defocus-corrected imaging at arbitrary depths could be achieved without re-optimizing defocus at every single depth. With open-loop defocus correction based on the measured defocus slope, OCT signal falls off a lot more slowly (Figure 2-3, black solid line); the 10% level is reached at about a 300µm depth, indicating a 2.5-fold increase in imaging depth compared to imaging without defocus correction.
In summary, signal level and penetration depth in ff-OCT imaging with high-NA objectives benefit greatly from defocus correction, underlining the importance of the automated correction integrated in deep-OCM.
Figure 2-3. Mean OCT signal as a function of imaging depth for different reference arm configurations: no defocus correction (thick dashed curve) and fixed reference arm length optimized for imaging at depths of 200, 300 and 400 µm, respectively (thin curves) as well as depth-dependent defocus correction (deep-OCM mode; thick solid line). The sample was the upper cortical layers of a young rat, imaged in vivo with ff -OCT at 33 Hz. Each data point corresponds to the mean signal of four image fr ames taken at the same depth, corresponding to 120 ms acquisition time. Axial scanning was performed with a 10 µm step size.
3 Myelin imaging with deep-OCM
3Myelin is the electrical insulation which allows, at a given axon diameter, faster signaling in the nervous system of vertebrates. It is produced by glial cells which wrap tightly around axons of neurons in the central nervous system to use several layers of their cell membrane for insulation. Myelin also appears in the peripheral nervous system where fast signal transmission to and from the brain is important. Diseases such as leukodystrophies, multiple sclerosis, Charcot-Marie-Tooth disease and other peripheral nervous system neuropathies all involve destruction or a dysfunction of production of myelin (Baumann & Pham-Dinh, 2001; Scherer & Wrabetz, 2008). White matter in the brain consists mainly of myelinated axons, while grey matter is a mix of axons (some of which are myelinated), cell bodies, dendrites and non-neuron cells. Large-scale imaging techniques such as magnetic resonance imaging are able to visualize white matter in the living brain and track myelination patterns on a global level. However, to visualize individual myelinated axons located in grey matter or to perform detailed observations of the changes in myelination, more sensitive techniques are needed. Coherent Anti-Stokes Raman Scattering microscopy (CARS; Cheng, et al., 2002) is able to image individual fibers (Wang, et al., 2005), even in vivo (Huff & Cheng, 2007; Fu, et al., 2008), but has inherently low penetration depth (Figure 3-1) since the signal is generated predominantly in the forward direction and detection happens in the backward direction. Indeed, currently reported imaging depths for myelin are on the order of 30 µm. CARS requires two pulsed laser sources and is, therefore, a relatively complicated and expensive technique.
Recently, third harmonic generation (THG) has been used for visualization of myelin as deep as 50 µm into the mouse spinal cord (Farrar, et al., 2010; Farrar, et al., 2011). This method also requires an expensive laser and operation in the cortex has not been shown.
3 The figures in this chapter have previously been published in Ben Arous, J., J. Binding et al., Single myelin
fiber imaging in living rodents without labeling by deep optical coherence microscopy. J. Biomed. Opt., 2011. 16(11): p. 116012.
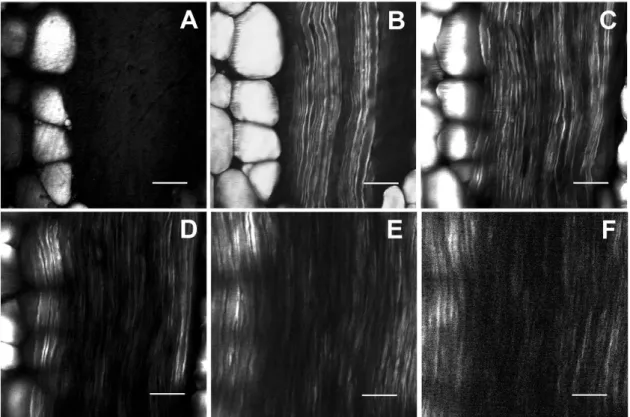
Figure 3-1. Sciatic nerve imaged using E-CARS (A) 0 μm, (B) 10 μm, (C) 20 μm, (D) 30 μm, (E) 40 μm and (F) 50 μm below the surface. Scale bar 20 μm. This figure was taken from (Huff & Cheng, 2007), reprinted by permission from John Wiley and Sons: Journal of Microscopy, copyright 2007.
In this chapter we will present our finding (Ben Arous, et al., 2011) that deep-OCM is capable of visualizing individual myelinated axons in vivo in depths considerably larger than currently possible with CARS or THG at a greatly reduced cost and with a much simpler experimental setup.
3.1 Deep-OCM shows myelin
Using our deep-OCM setup (Chapter 1, Figure 2-1) with automatic defocus correction for in
vivo imaging of the rat somatosensory cortex, we found that cortical tissue generally had a
relatively homogenous baseline reflectivity, which was only interrupted by three types of structures. Dark, roughly spherical regions with below-baseline reflectivity probably signify cell bodies. Blood cells in horizontally-oriented blood vessels usually reflected well (Figure 2-2), while blood vessels orthogonal to the imaging plane were usually only visible as dark circles and could be differentiated from cell bodies only by their long axial extent (when recording z stacks) and more variable diameter. The third structural element found was thin, bright fibers whose thickness was near the diffraction limit of our microscope of around 0.56
µm (Figure 3-2a). A high numerical aperture is critical for the visibility of these fibers: while they are still visible at an NA of 0.3, they cannot be discerned using ff-OCT at an NA of 0.1 (Claude Boccara and LLTech the Inc., private communication).
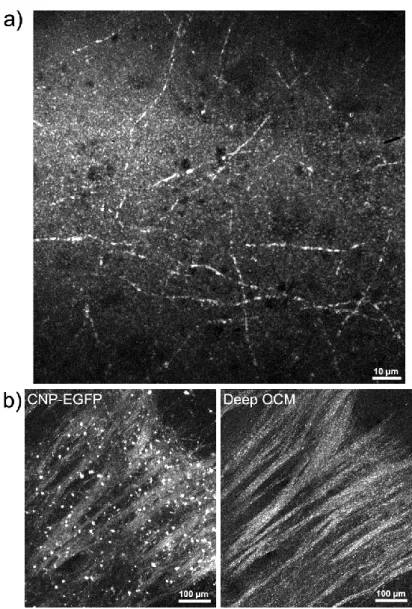
To confirm that these fibers corresponded to myelin, we performed several control experiments, which were coordinated by post-doc Juliette Ben Arous at ENS Paris. Using brain slices from genetically modified mice expressing enhanced green fluorescent protein (EGFP) under the cyclic nucleotide phosphodiesterase (CNP) promoter (Yuan, et al., 2002), we compared confocal fluorescence images to deep-OCM images. CNP-EGFP is expressed specifically in oligodendrocytes. In CNP-EGFP fluorescence images of the corpus callosum with a pixel size of 1.12 µm and a field of view of 594x672 µm, oligodendrocyte cell bodies and bundles of myelin fibers are visible (Figure 3-2b, left). The structures visible in deep-OCM of the same region of the sample correspond directly to the myelin fiber bundles visible in the fluorescence images (Figure 3-2b, right). Note that the cell bodies are not visible, so deep-OCM is not specific to oligodendrocytes, but to the strong local refractive index gradients of the myelin sheath, which scatter the incident light much more strongly than the surrounding tissue.
We also wanted to show that the hypothesis of deep-OCM showing myelinated fibers was consistent with the density of myelinated axons in the cortex. We therefore compared confocal images of immuno-fluorescently stained myelin basic protein (MBP) in one rat brain slice with deep-OCM images of an adjacent slice (Figure 3-3) and quantified the fiber density in both. Use of the same slice was not possible since the treatment for fluorescence staining destroyed the OCM contrast (not shown). For 12-week-old rats, sparse networks of the fibers were visible with both techniques. For three-week-old rats, deep-OCM images did not reveal any fibers. In contrast, immunofluorescence imaging showed small islands of fibers, whose average distance was larger than the field of view of the deep-OCM images. It is therefore possible that deep-OCM imaging missed these fibers due to the smaller field of view. Another reason could be that all fibrous islands originated in the depth corresponding to the slice used for immunostaining (150 µm below the surface) and none in the depth of the slice used for deep-OCM (250 µm below the surface).
Figure 3-2. Deep-OCM myelin imaging. (a) Maximum projection of a 40× red deep-OCM image stack in a cortex slice (80 images taken in 0.4µm z steps, z=250µm below the brain surface, total exposure time 84 seconds) (b) Comparison of confocal fluorescence images (left; maximum z projection of 32 images, 4 minutes 30 seconds acquisition time) and stitched 10× IR deep-OCM images (right; maximum z projection of 3x2 stitch in 100 depths i.e. 600 images, 9 minutes exposure time) of the same slice of corpus callosum of a CNP-EGFP mouse.
Quantification of the total length of all fibers per volume in both imaging modalities gave results around 4 m per cubic millimeter for the 12-week-old animals. The estimates for both techniques agreed within their error bounds, again consistent with the hypothesis that both show the same structure (Figure 3-3c).
Figure 3-3. In vitro deep-OCM imaging in the rat somato-sensory cortex. (a) Maximum projection of confocal images (fluorescent anti-MBP) of tangential slices of rat somato-sensory cortex taken using 10× objective (1mm x 1mm x 60µm, z=150µm below the brain surface; 32 images, total acquisition time around 4 minutes) from a P19 and a P85 rat. (b) Maximum projections of 40× deep-red deep-OCM image stacks in adjacent cortex slices (z=250µm) from the same animals as in (a) (70µm x 90µm x 60µm; 150 images, total exposure time around 3 minutes). (c) Fiber length density measured in vitro in tangential slices of rat somato-sensory cortex, by 40× deep-red deep-OCM and by confocal immuno-fluorescence, for 3-week-old and 12-week-old animals. Error bars indicate plus or minus one standard error of the estimated mean (s.e.m.).
A third and last argument in favor of deep-OCM showing myelin is the localization and structure of signal in a large-field-of-view high-resolution image of the cerebellum. The prototype of a commercial full field OCT system (LLTech, France) was used to acquire 15 x 19 individual overlapping OCT images to cover the full area of the cerebellum slice, which were then stitched to form one large image (Figure 3-4a). Comparing with the low-resolution
bright field image of said slice (Figure 3-4b), deep-OCM provided strongest signal in the areas known to contain white matter, i.e. high concentrations of myelinated fibers. Looking more closely, different cell layers could be differentiated (Figure 3-4c) and even individual fibers were discernible (Figure 3-4d and Movie 3).In summary, we are convinced that the fibers visible in deep-OCM correspond to myelinated axons.
Figure 3-4. High-resolution OCM imaging of rat cerebellar slices. (a) 10× IR deep-OCM image of a fixed sagittal slice of a 3 -week-old rat; stitch of 15x19=285 images, total exposure time 11 minutes 24 seconds. (b) Bright field low -resolution image with indication of the different cerebellar lobules. (c) Detai l of the 3 regions delimited in (a). WM: white matter; GCL: granule cell layer; PCL: Purkinje cell layer; ML: molecular layer. (d) 4 0× deep-red deep-OCM image of cerebellar white matter (maximum z projection over 6 images taken in 1 µm steps, total exposure time 6.3 seconds, corresponding to part of the volume shown in Movie 3).
3.1.1 Sensitivity to fiber orientation
Due to the en face imaging mode of full field OCT, fibers oriented parallel to the imaging plane are much more easily spotted. Slightly tilted fibers can be traced through sufficiently fine z-stacks, but strongly tilted fibers are difficult to identify due to the speckled nature of OCT images. A second problem which might render strongly tilted fibers less visible is the directionality of their light scattering. Presumably, the strong scattering everywhere along their length causes them to act like one-dimensional “mirrors”, which emit the light from each incoming ray into a cone with an opening half-angle equal to the angle between the incoming ray and the fiber. Only when the fiber is more or less orthogonal to the incident light, part of this cone falls into the acceptance angle of the microscope objective.
3.2 Imaging myelin fibers in vivo in cortex
Myelin imaging using deep-OCM was not only possible in slices, but also in vivo in the rat cortex. By visual inspection of several image stacks from different animals, we found that fibers had their highest concentration in depths of up to 150 µm, consistent with previous studies found on http://brainmaps.org/ajax-viewer.php?datid=148&sname=07 (Mikula, et al., 2007; Trotts, et al., 2007).
Since fiber density was depth dependent, we took the maximum image intensity per slice as a measure of signal decrease with depth. To reduce the influence of individual pixels, spatial filtering with a Gaussian kernel the size of the diffraction limited PSF was performed before taking the maximum. The signal level reached the constant noise level at a depth of 400 µm (Figure 3-5b), consistent with the visual finding of individual fibers down to 340 µm (Figure 3-5a).