L109
The Astrophysical Journal, 674:L109–L112, 2008 February 20
䉷 2008. The American Astronomical Society. All rights reserved. Printed in U.S.A.
SECCHI OBSERVATIONS OF THE SUN’S GARDEN-HOSE DENSITY SPIRAL
N. R. Sheeley, Jr.,1 A. D. Herbst,1,2C. A. Palatchi,1,3Y.-M. Wang,1R. A. Howard,1J. D. Moses,1 A. Vourlidas,1 J. S. Newmark,1 D. G. Socker,1S. P. Plunkett,1C. M. Korendyke,1L. F. Burlaga,4 J. M. Davila,4W. T. Thompson,4
O. C. St Cyr,4R. A. Harrison,5 C. J. Davis,5C. J. Eyles,5,6J. P. Halain,7D. Wang,8 N. B. Rich,8 K. Battams,8 E. Esfandiari,8and G. Stenborg9
Received 2007 November 28; accepted 2007 December 28; published 2008 January 22
ABSTRACT
The SECCHI HI2 white-light imagers on the STEREO A and B spacecraft show systematically different proper motions of material moving outward from the Sun in front of high-speed solar wind streams from coronal holes. As a group of ejections enters the eastern (A) field of view, the elements at the rear of the group appear to overrun the elements at the front. (This is a projection effect and does not mean that the different elements actually merge.) The opposite is true in the western (B) field; the elements at the front of the group appear to run away from the elements at the rear. Elongation/time maps show this effect as a characteristic grouping of the tracks of motion into convergent patterns in the east and divergent patterns in the west, consistent with ejections from a single longitude on the rotating Sun. Evidently, we are observing segments of the “garden-hose” spiral made visible when fast wind from a low-latitude coronal hole compresses blobs of streamer material being shed at the leading edge of the hole.
Subject headings: Sun: corona — Sun: coronal mass ejections (CMEs) — Sun: magnetic fields
1.INTRODUCTION
The Solar Terrestrial Relations Observatory (STEREO) spacecraft, A and B, contain a suite of Sun Earth Connection Coronal and Heliospheric Investigation (SECCHI) instruments (Howard et al. 2008), which include the offpointing Helios-pheric Imagers, HI1 and HI2. HI1 is pointed 13.2⬚ away from the Sun and shows a 20⬚ field centered near the ecliptic. HI2 is pointed about 53.4⬚ from the Sun and shows a 70⬚ field also centered near the ecliptic.
In a previous paper (Sheeley et al. 2008), we described HI2B observations of wave fronts of enhanced density passing Earth at the time that in situ detectors showed the arrival of com-pression regions in front of high-speed solar wind streams. The virtually perfect association during the summer and fall of 2007 led us to conclude that these HI2B waves were density en-hancements in front of high-speed streams from coronal holes. In this second paper, we describe a systematic difference between the HI2A and HI2B images at times that low-latitude coronal holes are present. Each time a coronal hole moved east to west across the disk, a burst of features became visible, first in the eastern field of HI2A and several days later in the western field of HI2B. In HI2A, the features showed a congestive mo-tion, in which the trailing elements overtook the leading ele-ments as seen along the line of sight. In HI2B, the features showed a dispersive motion, in which the leading elements appeared to be running away from the trailing ones. In this 1Space Science Division, Naval Research Laboratory, Washington, DC 20375-5352; [email protected].
2Present address: Cornell University, Ithaca, NY 14853.
3Present address: California Institute of Technology, Pasadena, CA 91125. 4NASA Goddard Space Flight Center, Greenbelt, MD 20771.
5Rutherford Appleton Laboratory, Chilton, Didcot, Oxfordshire OX11 OQX, UK.
6School of Physics and Astronomy, University of Birmingham, Edgbaston, Birmingham B15 2TT, UK.
7Centre Spatiale de Liege, University of Liege, Avenue du Pre-Aily, B-4031 Angleur, Belgium.
8Interferometrics, Inc., 13454 Sunrise Valley Drive, Herndon, VA 20171. 9Catholic University of America, 620 Michigan Avenue, NE, Washington, DC 20064.
Letter, we present observations and calculations suggesting that this east/west asymmetry is a perspective effect that is caused by material continually being shed from a fixed longitude on the rotating Sun and moved radially outward at roughly con-stant speed to form visible segments of the Sun’s garden-hose density spiral.
2.OBSERVATIONS
Figure 1 shows the locations of the A and B spacecraft, relative to the Earth-Sun line in September 2007, and the cor-responding fields of view of the HI2 imagers. On September 20, A was∼4% closer to the Sun and drifting ∼17.5⬚ west of Earth. B was ∼7% farther away and drifting ∼14.7⬚ east of Earth. The HI2A imager has an eastern view (UAV), about 20⬚–90⬚ from the A-Sun line, and the HI2B imager has a cor-responding western view (PBQ). In this configuration, HI2B was able to observe ejections sweeping past Earth, and HI2A was able to observe ejections as they approached Earth.
Figure 2 shows HI2A (left) and HI2B (right) difference im-ages obtained on September 15 and 20, respectively, when groups of ejections were beginning to move through their fields of view. We used difference images to remove stars, which mask the fainter solar material. Nevertheless, the Milky Way is still visible toward the left side of the HI2A image. Likewise, Venus (left) and Earth (right) and their vertical streaks of CCD detector bleeding are visible in the HI2B image. Eventually, Earth will move under the trapezoidal occulter at the right edge of the HI2B field, where it is already located at the left edge of the HI2A field of view. In the HI2A and HI2B running difference images, each ejection shows the leading-white/trail-ing-black signature of a density enhancement moving outward from the Sun.
In the HI2B image, a large, curved wave is faintly visible between Venus and Earth. Time-lapse images show that this wave was running away from the smaller waves behind it, which themselves were separating with time. In the HI2A im-age, the waves show the opposite behavior, with trailing mem-bers of the group moving past the leaders. A large HI2A wave
L110 SHEELEY ET AL. Vol. 674
Fig. 1.—Sketch illustrating the eastward and westward fields of view of the HI2A and HI2B telescopes, respectively, and their approximate relation to Earth during September 2007. Here, S refers to the Sun, A and B refer to the A and B spacecraft, and E refers to Earth. The angles UAV and PBQ indicate the HI2A and HI2B fields of view, respectively. Note that Earth lies in B’s field of view but slightly outside A’s field of view.
Fig. 2.—HI2A (left) and HI2B (right) images, showing material moving outward from the Sun. Time-lapse movies of such images show that the leading members of the eastern group are overrun by trailing members that are probably closer to the A spacecraft. Conversely, the leading members of the western group appear to run away from the trailing members that are probably farther from the B spacecraft. In the HI2B image, the leader is faintly visible as a large wave between Venus and the Earth. Its HI2A counterpart (not shown here) rapidly moved from the rear of the eastern group and swept across the field on September 20. In the HI2B image, the dark area to the right of Venus is an artifact of the image processing.
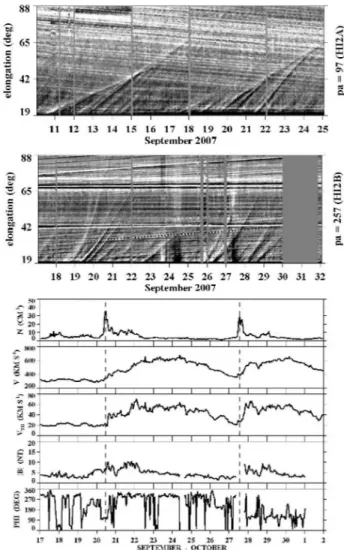
Fig. 3.—Elongation/time maps looking east from A (top) and west from B (middle) when two corotating interaction regions (bottom) were moving through their respective fields. The converging tracks (top panel) indicate solar rotation toward the observer, and the diverging tracks (middle panel) indicate rotation away from the observer. In the middle panel, the first waves in each series curve steeply upward, reaching Earth on September 20 and 27 when the density enhancements were recorded (bottom panel).
came from the rear of the group and swept across the field on September 20. It was probably the same wave seen in the HI2B field on that day.
Figure 3 helps to clarify this behavior. The bottom panel contains in situ plasma measurements from the Charge Element Isotope Analysis System (CELIAS) Mass Time-of-Flight (MTOF) spectrometer on the Solar and Heliospheric
Obser-vatory (SOHO), located at the L1 point about 2R,from Earth, and near-Earth magnetic field measurements from the OMNI2 database during September 17–October 1. During this time, there were two recurrent solar wind streams (V) with accom-panying compressions of density (N) and magnetic field (B). The first stream occurred in a negative magnetic sector (F∼ ), and the second stream occurred in a positive sector 315⬚
(F∼ 135⬚), consistent with their origins in the observed neg-ative-polarity and positive-polarity coronal holes that are shown later in Figure 6. Vthrefers to the thermal speed, which tends to increase suddenly when the density drops, marking the stream interface between the hot, low-density material from the coronal hole and the colder, denser material in the region ahead of the hole. In these plots, the dashed lines indicate the times that the density reached its highest values on September 20 and 27.
The top and middle panels show elongation/time maps ob-tained from HI2A and HI2B running difference images, re-spectively. These maps show intensity differences along a par-ticular direction (97⬚ and 257⬚ measured counterclockwise from solar north in the top and middle panels) as a function of time in days (horizontal axis) and elongation angle in degrees
(ver-tical axis). The HI2B map, whose time axis matches that of
the in situ measurements, shows tracks curving steeply upward and arriving at Earth (just beyond 65⬚) at the times of the dashed lines on September 20 and 27. (The arrival of the track on September 27 is partially masked by our field-flattening pro-cess, which produced a darkened area below 42⬚ and a lightened area above 42⬚, similar to those on September 24 when the
No. 2, 2008 SECCHI OBSERVATIONS OF SUN’S GARDEN-HOSE DENSITY SPIRAL L111
Fig. 4.—Computed elongation/time tracks of ejections assumed to move radially outward at a constant speed from a fixed point on the rotating Sun. The labels indicate the sky-plane angles (in degrees) at which the ejections are released, increasing from the east limb to the central meridian and then decreasing again toward the west limb. The five eastern tracks form a con-verging pattern similar to those in the top panel of Fig. 3, and the five western tracks form a diverging pattern similar to those in the middle panel of Fig. 3.
Fig. 5.—Polar view of idealized ejections (filled circles) that move radially outward from a fixed point on the rotating Sun (S). Solid lines connect ejections at a given time. The dashed lines indicate the radial trajectories of ejections during a 2 day interval ( – corresponding to days 6–8 and – correspondingt t1 2 t t3 4 to days 11–13). Their locations out of the observer’s sky plane (perpendicular to OS) are indicated by the angles (in degrees) around the perimeter of the outer spiral. A radial speed of∼440 km s⫺1was chosen to make the spiral angle 45⬚ at 1 AU. We suppose that the observer (O) is located 1 AU from the Sun and has two heliospheric views, one defined by the bold angle to the east and the other to the west. In the eastern view, the early ejections enter the field first but are eventually overtaken by the later ejections that are farther from the sky plane, closer to the observer, and traveling with a correspondingly higher angular speed. In the western view, the nearly head-on ejections move rapidly across the field and are followed much later by ejections that are closer to the sky plane.
density was low.) In each case, less inclined tracks followed on subsequent days. The time axis of the HI2A map is shifted so that the two groups of converging tracks are visible. The point of the figure is that the eastern tracks form converging patterns associated with the recurrent high-speed streams and that the western tracks form diverging patterns. These patterns were visible during the previous rotation in August and the following rotation in October, and are characteristic of all HI2 motions ahead of high-speed solar wind streams.
In our previous paper (Sheeley et al. 2008), we showed that elongation/time tracks through the HI1 and HI2 fields of view can be understood in terms of a radial flow outward from the Sun at a constant speed. The idea is that the acceleration occurs close to the Sun (5–15R,) and is essentially finished by the time that the material reaches the HI1 and HI2 fields of view. With this assumption, we obtained the relation
rcos d
tan a p , (1)
1⫺ r sin d
where a is the solar elongation angle, d is the angular location of the ejection out of the observer’s sky plane, and
r
v
r(t⫺ t )0r { p ⫹ r ,0 (2)
a a
where r is the radial distance of the ejection,
v
r is its radial speed,t0 is its starting time at an initial positionr0 (in units of a), and a is the Sun-observer distance. Also, t is the time of observation, subject to the condition that t≥ t0 for each trajectory.Now, we go a step further and suppose that the ejections all occur from the same point on the rotating Sun. For simplicity, we suppose that this point lies in the ecliptic. (However, when we deduce the location from the observed tracks, we do not make this simplifying assumption, and we also include the effect of the tilt angleB0of the Sun’s axis from the normal to the Sun/spacecraft line.) In this case, the starting timet0 in-creases as the ejection point rotates from the east limb to the west limb. In particular, t p d/q0 in the eastern hemisphere, where d increases from 0⬚ at the east limb to 90⬚ at the central
meridian, and t p (1800 ⬚ ⫺ d)/q in the western hemisphere, where d decreases again. Here q is the sidereal rotation rate of 14.39⬚/day (Newton & Nunn 1951).
Figure 4 shows the result for values of d ranging from 0⬚ to 75⬚ in the eastern hemisphere and then from 75⬚ back to 0⬚ again in the western hemisphere. The five eastern tracks cluster together in a converging pattern like the observed tracks in the top panel of Figure 3. Likewise, the five western tracks spread apart like the patterns of diverging tracks in the middle panel of Figure 3. This similarity supports our interpretation of the observed patterns in terms of ejections from a given longitude on the rotating Sun.
Figure 5 shows a polar view of these results. As described in the caption, the eastern view from the observer at O shows nearby features overrunning more distant ones along the line of sight. The western view shows nearby features running away from more distant ones.
Again, we have the Doppler-like relation discussed in re-lation to Figures 2 and 3. In the eastern hemisphere, the more recently ejected material lies close to the observer and appears to sweep past material that was ejected previously at longitudes closer to the east limb. In the western hemisphere, the recently ejected material lies close to the observer and appears to run away from material ejected later at longitudes closer to the west limb. This supports the idea that the HI2 ejections are segments of the “garden-hose” spiral formed when material is ejected from a fixed point on the rotating Sun.
Finally, in Figure 6, we summarize the locations of the co-ronal holes and associated coco-ronal streamers in longitude/lat-itude maps of Fe XV 28.4 nm intensity (top) and white-light coronal intensity (bottom), respectively, during Carrington ro-tation 2061. The Fe XV map was constructed from images obtained with the Extreme ultraviolet Imaging Telescope (EIT) on SOHO, and the white-light map was constructed from east-limb data obtained with the C2 Large Angle and Spectrometric Coronagraph (LASCO) on SOHO. The arrows indicate the
ejec-L112 SHEELEY ET AL. Vol. 674
Fig. 6.—Carrington maps of Fe XV 28.4 nm intensity (top) and white-light coronal intensity (bottom) for rotation 2061 (2007 September 10–October 8), showing the relative locations of the dark Fe XV coronal holes, the white-light streamer belt at 3R,, and the regions where the HI2 material originated (arrows) for the two patterns in Fig. 3.
tion longitudes for the two events in Figure 3, obtained by fitting the observed elongation/time tracks with equations (1) and (2). The right arrow occurs at the bend of the streamer just before a negative-polarity coronal hole at the leading edge of the active region. The left arrow occurs at a second bend of the streamer just before a positive-polarity coronal hole at the trailing end of the active region. This coronal hole forms an extension of the south polar coronal hole.
3.SUMMARY AND DISCUSSION
We have found that the elongation/time tracks of material moving through the HI2 fields of view are grouped into char-acteristic patterns when they are associated with the high-speed stream from a coronal hole. In the eastern view from HI2A, the tracks converge, whereas in the western view from HI2B, they diverge.
This behavior is consistent with a sequence of ejections from a fixed point on the rotating Sun and provides an interpretation of the motions seen in the HI2A and HI2B images. As a coronal hole is carried around the east limb by solar rotation, a group of ejecta appears in the HI2A field of view. The ejecta do not originate in the coronal hole itself but seem to be blobs of material that are shed from the north-south segment of the streamer in front of it (Sheeley et al. 1997; Wang et al. 1998). The leading elements of the group originate close to the east limb, and they are gradually overtaken by newer elements that originate at midlongitudes. Because these newer elements lie farther out of the sky plane, they never come in contact with the older ones, and leave them behind to eventually fade away. These newer elements themselves are then overtaken by even newer elements that originate closer to the central meridian.
As they pass near the spacecraft, the most recent ejections have large angular sizes, high angular speeds, and appear as large waves sweeping across the field. Presumably, the large apparent sizes and high apparent speeds are a consequence of the close approach; the true sizes and speeds must be comparable to those of the elements that were ejected closer to the sky plane. The opposite effect occurs when the solar wind stream swings past the central meridian and moves into the HI2B field of view. The first element of this western group originates near the central meridian and appears as a large wave, rapidly run-ning away from the other elements of the group. One by one, each of the remaining elements takes its turn running away from the others. In contrast to the congestive motions that we observed in the eastern field of view, we are seeing dispersive motions in this western field. This congestive/dispersive effect is what one expects for individual droplets of a garden-hose spiral and suggests that we are observing segments of a spiral that is generated by the ejection of material from a fixed lon-gitude on the rotating Sun.
During this initial phase of the STEREO mission, the A and B spacecraft were still located close to Earth, so that the Earth-directed density compressions appeared as large waves sweep-ing rapidly through the respective fields of view. However, in 1.3 years, these spacecraft will have moved 45⬚ from Earth. If high-speed streams are still present, we would expect the elon-gation/time tracks to show the associated convergence patterns in the east and divergence patterns in the west. But the Earth-directed motions will no longer be the waves that appear large and sweep rapidly across the fields of view. Instead, the Earth-directed motions will have the relatively smaller apparent sizes and angular speeds that are characteristic of material ejected closer to the observer’s sky plane.
The coronal hole behind each shedding streamer must be responsible for organizing the tracks into converging and di-verging patterns. Without the coronal hole (and its magnetic field), the streamer belt would be flat. Blobs would still be ejected, but from random longitudes, so that their tracks would form an uncorrelated mishmash, like those that are obtained closer to the Sun with the LASCO C2 and C3 images and the SECCHI COR2 and HI1 images. Also, by compressing the blobs into higher densities, the fast wind from the hole may make them more visible in the HI2 fields of view. This suggests that the running difference images are not showing the entire garden-hose spiral, but only the segments that are made visible as blobs of streamer material are compressed by the high-speed streams.
These STEREO/SECCHI data are produced by a consortium of NRL (US), LMSAL (US), NASA/GSFC (US), RAL (UK), UBHAM (UK), MPS (Germany), CSL (Belgium), IOTA (France), and IAS (France). In the US, funding was provided by NASA, in the UK by PPARC, in Germany by DLR, in Belgium by the Science Policy Office, and in France by CNES and CNRS. NRL received support from the USAF Space Test Program and ONR.
REFERENCES Howard, R. A., et al. 2008, Space Sci. Rev., in press
Newton, H. W., & Nunn, M. L. 1951, MNRAS, 111, 413 Sheeley, N. R., Jr., et al. 1997, ApJ, 484, 472
Sheeley, N. R., Jr., et al. 2008, ApJ, in press Wang, Y.-M., et al. 1998, ApJ, 498, L165