UNIVERSITÉ DE MONTRÉAL
OPTICAL IMAGING AND TWO-PHOTON MICROSCOPY STUDY OF HEMODYNAMIC CHANGES CONTRALATERAL TO ICTAL FOCUS DURING
EPILEPTIFORM DISCHARGES
par
VAN TRI TRUONG
DÉPARTEMENT DE NEUROSCIENCES FACULTÉ DE MÉDECINE
MÉMOIRE PRÉSENTÉ À LA FACULTÉ DE MÉDECINE EN VUE DE L‟OBTENTION DU GRADE DE MAÎTRISE EN NEUROSCIENCES
AVRIL 2015
Résumé
Il est relativement bien établi que les crises focales entraînent une augmentation régionale du flot sanguin dans le but de soutenir la demande énergétique en hémoglobine oxygénée des neurones épileptiques. Des changements hémodynamiques précoces ont également été rapportés dans la région homologue controlatérale, bien que ceci ait été moins bien caractérisé. Dans cette étude, notre objectif est de mieux caractériser, lors de crises focales, la nature des changements hémodynamiques précoces dans la région homologue controlatérale au foyer épileptique. L'imagerie optique intrinsèque (IOI) et la microscopie deux-photons sont utilisées pour étudier les changements hémodynamiques dans la région homologue controlatérale au site de crises focales induites par l‟injection de 4-aminopyridine (4-AP) dans le cortex somatosensitif ipsilatéral de souris. Dans l'étude d'IOI, des changements de l‟oxyhémoglobine (HbO), de la désoxyhémoglobine (HbR) et du débit sanguin cérébral ont été observées dans la région homologue controlatérale au site de crises focales lors de toutes les crises. Toutefois, ces changements étaient hétérogènes, sans patron cohérent et reproduisible. Nos expériences avec la microscopie deux-photons n‟ont pas révélé de changements hémodynamiques significatifs dans la région homotopique controlatérale lors de trains de pointes épileptiques. Nos résultats doivent être interprétés avec prudence compte tenu de plusieurs limitations: d‟une part absence de mesures électrophysiologiques dans la région d‟intérêt controlatérale au foyer simultanément à l‟imagerie deux-photons et à l'IOI; d‟autre part, lors des expériences avec le deux-photons, incapacité à générer de longues décharges ictales mais plutôt des trains de pointes, couverture spatiale limitée de la région d‟intérêt controlatérale, et faible puissance
suite au décès prématuré de plusieurs souris pour diverses raisons techniques. Nous terminons en discutant de divers moyens pour améliorer les expériences futures.
Mots-clés : réponse hémodynamique, imagerie optique intrinsèque, deux-photons, épilepsie, décharges épileptiformes, région homologue controlatérale, 4-aminopyridine.
Abstract
It has been well demonstrated that focal seizures are associated with a significant increase in regional cerebral blood flow to actively supply discharging neurons with oxygenated hemoglobin. There is also some evidence to suggest that focal seizures elicit early hemodynamic changes in the contralateral homotopic area, although this has been less well documented. In this study, we aim to better characterize the nature of early hemodynamic responses contralateral to the epileptic focus during seizures. We used intrinsic optical imaging (IOI) and two-photon laser microscopy to measure the hemodynamic changes in the homotopic contralateral area following focal seizures induced by an injection of 4-aminopyridine (4-AP) in the mouse somatosensory neocortex. In the study using IOI, oxyhemoglobin (HbO), deoxyhemoglobin (HbR) and cerebral blood flow (CBF) changes were observed in the homotopic area contralateral to the focus during all seizures. However, these changes were rather heterogenous, lacking any consistent or reproducible pattern. Our two-photon study showed no significant hemodynamic changes at the capillary level in the homotopic area contralateral to the ictal focus during epileptic spike trains. However, these findings must be interpreted cautiously in light of several limitations we encountered during the experiments. Specifically, we were unable to simultaneously record electrophysiology in the contralateral homotopic area. Furthermore, during our two-photon experiments, we failed to induce long ictal discharges (inducing only spike trains) had a limited sampling of the contralateral homotopic area and reduced power as a result of low mice survival rate. We conclude by providing alternatives to possibly improve future experiments.
Keywords: hemodynamic, two-photon, intrinsic optical imaging, epileptiform discharges, homotopic contralateral area, 4-aminopyridine.
Table of contents
Résumé ... i
Abstract ... iii
Table of contents ... v
List of figures ... vii
List of tables ... viii
List of abbreviations ... ix Acknowledgements ... x Chapter 1 ... 11 Introduction ... 11 Chapter 2 ... 14 Physiology... 14 2.1. Epilepsy... 14 2.2. Neurovascular coupling ... 20
2.3. Rationale for the use of the 4-AP epilepsy model ... 37
2.4. Rationale for the use of two-photon microscopy ... 38
2.5. Rationale of combined electrophysiology recording and two-photon microscopy ... 40
Chapter 3 ... 43
3.1. IOI experimental preparation ... 43
3.2. Two-photon experimental preparation ... 49
Chapter 4 ... 57
Results ... 57
4.1. HbR, HbO and CBF changes during seizures in IOI experiments……….57
Chapter 5 ... 63 Discussion ... 63 5.1. HbO, HbR and CBF changes in the contralateral homotopic area during ipsilateral seizures in IOI experiments ... 63 5.2. Hemodynamic changes in the contralateral homotopic area during ipsilateral seizures in two-photon experiments... 64 References ... 70 Appendix 1. A session of spike trains provoked by 4-AP injection into mouse cortex ... 87
List of figures
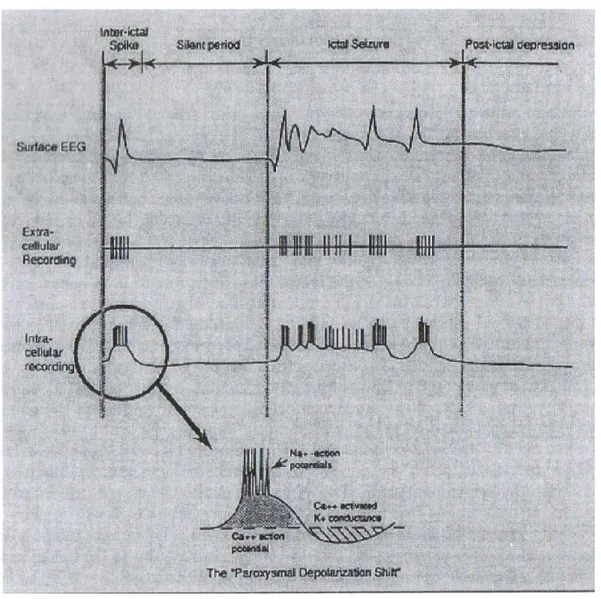
Figure 2.1. Focal epileptiform activities and paroxysmal depolarization shift... 16
Figure 2.2. Schema of possible seizure propagation pathways (A) and their simplification (B) ... 19
Figure 2.3. Neurovascular unit ... 22
Figure 2.4. Factors involved in neurovascular coupling.. ... 26
Figure 2.5. Two-photon microscopy of in vivo brain microvasculature. ... 39
Figure 2.6. Recordings of neural activity ... 42
Figure 3.1. Set up of intrinsic optical imaging system.. ... 48
Figure 3.2. Two-photon experimental scheme ... 51
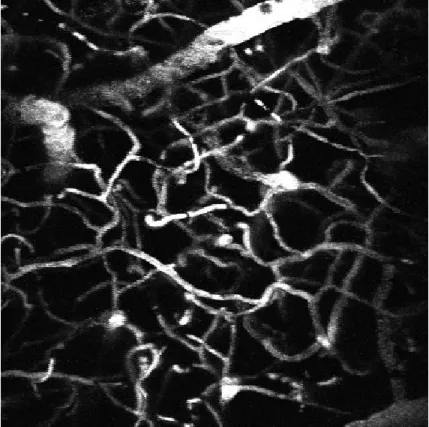
Figure 3.3. Two-photon microscopy projection of vessels and capillaries through the cranial window after intra-venous injection of FITC. ... 53
Figure 3.4. Angiogram of vessels stained with fluorescent indicators. ... 54
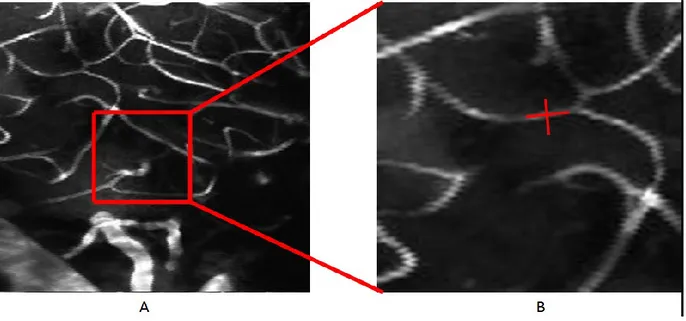
Figure 3.5. Measurement of hemodynamics in single cortical capillaries. ... 55
Figure 4.1. HbO and HbR changes in the contralateral homotopic area during 2 different seizures in one mouse . ... 58
Figure 4.2. Changes of HbO, HbR and CBF in the contralateral homotopic area during focal seizures . ... 59
Figure 4.3. Hemodynamic changes in the contralateral area ... 60
Figure 4.4 Interval between spike trains. ... 62
List of tables
Table 1. Seizures provoked by 4-AP injection in mice with HbO, HbR and CBF changes in the contralateral area………57 Table 2. Spike trains and hemodynamic changes in the contralateral area during two-photon experiments ... 61
List of abbreviations
α-amino-3-hydroxy-5-methyl-4-isoxazolepropionic acid AMPA
Blood oxygenation level-dependent BOLD
Bicuculline methiodide BMI
Cerebral blood flow CBF
Cerebral blood volume CBV
Fluorescein isothiocyanate FITC
Functional near-infrared spectroscopy fNIRS
Functional magnetic resonance imaging fMRI
Oxyhemoglobin HbO
Deoxyhemoglobin HbR
Total hemoglobin HbT
Intrinsic optical imaging IOI
Local field potentials LFP
Multiple-unit spiking activity MUA
N-Methyl-D-aspartate NMDA
Optical coherence tomography OCT
Red blood cell RBC
Single-photon emission computerized tomography SPECT
Acknowledgements
I would like to thank Marc-Antoine Gillis, Simon Dubeau and Romain Berti for helping me with the animal experiments, Michèle Desjardins for helping me with data analysis and Cong Zhang for giving me a hand with the optical imaging figures.
I would also like to express my gratitude to my supervisors, Drs. Dang Khoa Nguyen and Frederic Lesage, for their teaching, advice and patience. My gratitude is extended to the members of my evaluation committee, Drs. Lionel Carmant and Philippe Pouliot for their counsel and encouragements.
Chapter 1
Introduction
Epilepsy is a chronic neurological disorder characterized by recurrent spontaneous seizures (Raichle & Mintun, 2006; Traub & Wong, 1982). Seizures in focal epilepsies are sustained by abnormal, excessive and highly synchronous neuronal discharges that originate within restricted brain regions with the possibility of spreading to adjacent and more distant cortical areas (Avoli et al., 2002; Traub & Wong, 1982; Trevelyan et al., 2006). These events have been shown to be accompanied by a large increase in local cerebral blood flow (CBF) supplying actively discharging neurons with HbO, a mechanism termed neurovascular coupling. The mechanism underlying neurovascular coupling has been studied through direct visual intraoperative observation following craniotomy (Horsley, 1892), by using a thermocouple blood flow sensor (Penfield et al., 1939) or with ictal single photon emission computed tomographic (SPECT) studies ( Lee et al., 1988). In addition to a local increase in CBF over the epileptic focus, other areas of increase in CBF are often observed on ictal SPECT images and assumed to represent zones of seizure propagation. Indeed, ictal SPECT is a nuclear medicine imaging technique that provides a single snapshot of the CBF late into the seizure as it takes several seconds to inject the radiotracer following seizure onset and one minute for the radiotracer to accumulate and fixate within the neurons proportionally to the CBF. It is neither able to provide details of the early ictal hemodynamic response nor to discriminate between the changes related to epileptic activity at the zone of seizure onset from those related to propagated epileptic activity. More recently, using simultaneous electroencephalography (EEG)-functional near-infrared spectroscopy (fNIRS), a
cortex, our group was able to observe two interesting findings: a) during focal seizures, a regional increase in cerebral blood volume (CBV) and HbO is observed (as expected) but as the seizure continues, a progressive increase in HbR occurs suggesting that the reactive increase in HbO is insufficient to respond to the metabolic demand of seizing neurons; b) similar (albeit milder) hemodynamic changes were always observed early in the contralateral region (and sometimes more distant sites) even when there were no evidence of propagated epileptic activity on scalp electrodes. These studies were however limited in several ways: a) patient heterogeneity in terms of age, seizure focus, seizure type duration and propagation patterns; b) limited spatial resolution of scalp EEG; c) contamination of the fNIRS signal from blood in superficial scalp vessels.
In summary, all the aforementioned findings indicate that focal seizures are associated with significant increase in regional CBF. However, several questions remain unanswered such as a) is this increase in regional CBF truly sufficient to sustain the metabolic demand of seizing neurons? and b) what is the nature of these early contralateral and remote hemodynamic changes? These questions can be addressed using animal models of epilepsy (bypassing some of the limitations intrinsic to human studies) and novel optical imaging techniques that allow the simultaneous measure of hemoglobin (intrinsic optical imaging), blood flow (speckle imaging and Doppler optical coherence tomography (OCT)), oxygen consumption (confocal and two-photon microscopy) and calcium dynamics (fluorescence imaging).
In this study, our objective was to better characterize the nature of the hemodynamic responses in the contralateral homotopic area using intrinsic optical imaging and two-photon laser microscopy following focal seizures induced by 4-aminopyridine (4-AP) in the mouse neocortex.
Chapter 2
Physiology
2.1. Epilepsy
2.1.1. Pathophysiology of seizures and epilepsy
Epilepsy is a chronic neurological disorder characterized by recurrent spontaneous seizures (Raichle & Mintun, 2006; Traub & Wong, 1982). Seizures are the result of sustained abnormal and excessive neuronal discharges, frequently accompanied by behavioral changes. Epilepsy is the most common neurological disorder after stroke with a prevalence of up to 1% of the general population. Common causes include brain tumor, stroke, severe head trauma, brain infections, perinatal injury, malformations of cerebral development and genetic mutations.
EEG plays a key role in the diagnosis of seizures and epilepsy. It provides a record of voltage fluctuations resulting from ionic current flowing within neurons. Obviously, the electric discharge from a single neuron is too small to be detected by surface (or scalp) EEG such that the EEG activity recorded by scalp electrodes reflects the summation of the synchronous activity of thousands of neurons that have similar spatial orientation. Focal epileptiform abnormalities are usually divided into: a) „interictal‟ discharges („spikes‟) which are brief (20-200ms) asymptomatic paroxysmal EEG transients clearly distinguished from background; and b) „ictal‟ discharges that are sudden focal rhythmic activity with a characteristic pattern of evolution (with respect to amplitude, frequency and spatial distribution) lasting at least several seconds (Figure 2.1). These ictal discharges are generally associated with clinical seizure manifestations
(electroclinical seizures) but can sometimes be clinically silent (electrical seizures) or generate only subtle behavioral manifestations. The intracellular correlate of the interictal epileptiform discharge is the paroxysmal depolarization shift (PDS). The PDS is characterized by a prolonged Ca2+ mediated depolarization, which causes voltage-gated Na+ channels to open, resulting in multiple action potentials. This depolarization is followed by a period of hyper-polarization mediated by Ca2+-dependent K+ channels or GABA-activated Cl- influx. The temporal and spatial summation of multiple synchronous PDSs within the abnormally activated cortical circuitry leads to an interictal spike observed on the EEG (Rho et al., 2004). To generate a spike detectable with scalp electrodes in the EEG, synchronous PDSs discharges from several millions of neurons from a region of at least 6cm2 are required (Goldensohn & Salazar, 1986).
Epileptiform discharges occur when there is a sudden imbalance between the excitatory and inhibitory inputs to a network of neurons, resulting in overall excessive excitability, which may be local or generalized in both hemispheres (Rho et al., 2004). The mechanisms that may lead to decreased inhibition or increased excitation include abnormalities of the neuronal circuitry; neurons; glia and the extracellular milieu; subcellular regions; receptor composition, distribution, or biophysical properties; signal transduction; the genetic code; and posttranslational regulation (Rho et al., 2004).
2.1.1.1. Decreased inhibition leading to seizures
Gama-aminobutyric acid (GABA) is the main inhibitory neurotransmitter in the brain. It binds to two major classes of receptors: the GABAA and the GABAB receptors. Any defect in GABAA
receptor-mediated inhibition, GABAB inhibition or activation of GABA-ergic neurons may lead
to the decreased inhibition. Moreover, abnormally low levels or defective function in
one or more of the intracellular calcium-binding proteins (parvalbumin and calbindin) may cause defective GABA release, which would switch the inhibitory tone in the local neuronal network to an excitation tone (Rho et al., 2004).
2.1.1.2. Increased excitation leading to seizures
Glutamate is the main excitatory neurotransmitter in the brain. The postsynaptic effects of glutamate are mediated through the ionotropic glutamate receptors including N-Methyl-D-aspartate (NMDA), α-amino-3-hydroxy-5-methyl-4-isoxazolepropionic acid (AMPA), the kainite and metabotropic glutamate receptors. The activation of AMPA and kainate receptors will create the fast component of the excitatory postsynaptic potential (EPSP) whereas the NMDA receptors mediate the slow component. It has been suggested that an inherited predisposition for faster or longer-lasting activation of glutamate receptors may lead to the change of seizure threshold (Rho et al., 2004).
In addition to the role of glutamate receptors in increasing the excitation status of the neurons in the brain, the synchronous activation of pyramidal neurons in laminar structures may further increase the excitability of neighbouring neurons through ephaptic interactions. Moreover, it has been proposed that the cellular hyperexcitability of dentate granule cells in refractory temporal focal epilepsy may result from the sprouting of recurrent excitatory synapses (Rho et al., 2004). Lytton used computer modeling and found that small increases (1%-5%) in the number of recurrent excitatory collaterals in the dentate gyrus resulting from sprouted mossy fibers could provoke persistent cellular hyperexcitability (Lytton et al., 1998).
2.1.2. Seizure propagation
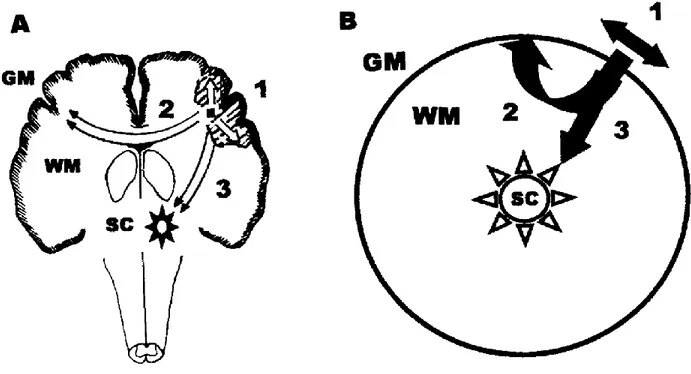
Seizure propagation is the process whereby seizure activity spreads out from an epileptic focus progressively recruiting more neurons. It occurs when there is sufficient activation of neurons surrounding the ictal focus. The ictal discharges propagate to contiguous areas via local cortical connections and to non-contiguous areas via long pathways. Studies in animals and humans show that there are three potential pathways for seizure propagation (Figure 2.2):
-Intracortical propagation (path 1 in Figure 2.2): Ictal discharges spread horizontally from the ictal focus via thin diameter unmyelinated axons to adjacent areas (Milton et al., 2007);
-White matter mediated propagation (path 2 in Figure 2.2): Ictal discharges spread vertically from the gray matter to adjacent and distant areas of the cortex via myelinated axons that interconnect neurons in ipsilateral and contralateral regions of the cerebral cortex with each other and neurons in other parts of the central nervous system (Milton et al., 2007);
-Sub-cortical nuclei mediated propagation (path 3 in Figure 2.2): Ictal discharges spread vertically via reciprocal connections composed mainly of myelinated axons interconnecting neurons in the cortex and the sub-cortical nuclei that have diffuse projections (Milton et al., 2007).
It is likely that seizure activity spreads from the ictal focus via allthree pathways, to varying extents, to other areas. The propagation velocity is unique to each pathway with the fastest in the sub-cortical mediated propagation and the slowest in the intracortical spread (Milton et al., 2007).
Figure 2.2. Schema of possible seizure propagation pathways (A) and their simplification (B). GM: gray matter, WM: white matter, SC: sub-cortical nuclei (Milton et al., 2002).
2.1.3. Secondary epileptogenesis
Seizure propagation may lead to secondary epileptogenesis. Morrell first described the concept of secondary epileptogenesis in experimental animal models in which a primary epileptogenic region generates epileptogenic potentials in a secondary (histologically normal) epileptic region via neuronal connections with the primary area (Morrell, 1960). A contralateral mirror focus is a special form of secondary epileptogenesis, in which the secondary epileptogenic zone is located in the contralateral homotopic area. The development of independent mirror foci and secondary epileptogenic foci in animals were described in detail by Morrell and colleagues (Morrell, 1960, Wada & Cornelius, 1960; Wilder, King, & Schmidt, 1969; Wilder & Morrell, 1967). In the initial stage (the dependent phase), epileptic discharges generated in the primary focus project to
secondary focus. In the intermediate phase, the secondary focus generates independent discharges and independent seizures but all of its epileptogenic activities will eventually disappear if its connection with the primary focus is ablated. Secondary epileptogenesis is established in the final stage (the independent phase), when the epileptic discharges generated in the secondary focus are permanent and independent from the disconnected primary epileptogenic region. Secondary epileptogenesis has been reported in humans as well. In a series of 47 tumor patients, Morrell reported evidence of secondary epileptogenesis in slightly more than a third of patients (34%, including 10.6% in the independent phase) (Morrell, 1985). In 30 patients with unilateral epileptogenic low-grade structural lesions, McCarthy found an interictal mirror foci in nearly a third (27%) of subjects and one patient had evidence of independent secondary epileptogenesis (McCarthy, O‟Connor, & Sperling, 1997). Sampaio reported a mirror focus in 8 out of 21 patients (38%) with epilepsy due to temporal lobe tumours (Sampaio, Yacubian, & Manreza, 2004). Finally, secondary epileptogenesis is hypothesized to be the main reason that patients with long-standing epilepsy related to a cavernoma have poorer seizure outcome following a lesionectomy compared to patients with a shorter duration of epilepsy prior to epilepsy surgery (Englot et al., 2011; Hammen et al., 2007; Moran et al., 1999).
2.2. Neurovascular coupling
2.2.1. Normal neurovascular coupling
Neurovascular coupling refers to the tight relationship between local neuronal activity and subsequent changes in CBF. Because neurons do not have internal reserves of energy in the form of glucose and oxygen, their firing causes an increased and rapid need for energy. The brain responds by increasing local CBF and local CBV, generally oversupplying the active neurons
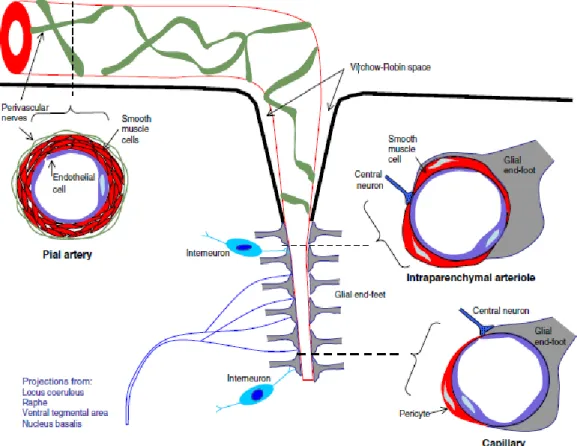
with HbO and causing a relative decrease in HbR. This local haemodynamic response usually occurs after a delay of 1-5 seconds, rises to a peak over 4-5 seconds, and falls back to baseline (typically undershooting it slightly) (Shariff et al., 2006). Neurovascular coupling was first described by Roy and Sherrington in 1890. They suggested that active neurons release vasoactive agents in the extracellular space and that these agents diffuse to blood vessels, causing relaxation of vascular smooth and vasodilation (Roy & Sherrington, 1890). Accumulated evidence has since shown that neurovascular coupling involves a complex sequence of events involving neurons, glia and microvessels (forming a functional entity termed the neurovascular unit) (Lo et al., 2003) (Figure 2.3).
This complex sequence of events starts at the neuronal level. When a neuron is stimulated, there will be a change in the ion flux through its cell membrane, leading to a change in the cross-membrane voltage. If this voltage change is large enough, an all-or-none electrochemical pulse called an action potential is generated, which propagates rapidly along the axon. When it arrives at the synaptic terminal, it provokes the release of neurotransmitters such as glutamate or GABA into the synaptic cleft.
Figure 2.3. Neurovascular unit. Pial arteries, intraparenchymal arterioles, and capillaries are shown in cross-sections (dashed lines). Peripheral nerves innervate the pial arteries while central neurons (local interneurons and projection neurons) innervate the arterioles and capillaries, which are closely covered by glial end-feet (Drake & Iadecola, 2007).
On the one hand, glutamate binds to metabotropic glutamatergic receptors on astrocytes to activate phospholipase C and inositol triphosphate (IP3), releasing Ca2+ from intracellular stores.
This glutamate-induced increase in intracellular Ca2+ in astrocytes activates the synthesis of nitric oxide (NO) from NO synthase (NOS) (Strijbos, 1998), prostaglandins (PGE2) from cyclooxygenase-2 (COX-2), and epoxyeicosatrienoic acids (EETs) from cytochrome P450 epoxygenase (Alkayed et al., 1997). PGE2 and EETs have strong vasodilatory properties while
changes in NO concentration may vasodilate or vasoconstrict. (Kowiański et al., 2013; Lindauer et al.,, 1999; Yang et al., 2000). High NO levels will inhibit the production of EETs from P450 epoxygenase leading to vasoconstriction mediated by 20-hydroxyeicosatetraenoic acid (20-HETE) production, whereas low NO levels will liberate EETs production from inhibition resulting in vasodilation (Metea & Newman, 2006). On the other hand, GABA has also been reported to play a role in modifying the cerebromicrovascular tone (Fergus & Lee, 1997; Vaucher et al., 2000). Following the activation of the GABAergic interneuron, GABA may also act on receptors expressed by astrocytes and induce either a vasoconstriction or a vasodilation, depending on the type of co-expressed neuromodulator; for example neuropeptide Y (NPY) or somatostatin (SOM) results in vasoconstriction whereas NO or vasoactive intestinal peptide (VIP) leads to vasodilation (Cauli et al., 2004).
Astrocytes can spread the signal to unactivated perivascular astrocytes through 2 pathways: the intracellular pathway supplied by the diffusion of IP3 and Ca2+ through astrocytic gap junctions,
and the extracellular pathway based on the release of gliotransmitters (ATP and adenosine) and arachidonic acid derivatives (EET) (Kowiański et al., 2013). Moreover, astrocytes themselves can initiate spontaneous Ca2+ oscillations that allow blood flow to change proportionally to neuronal activity (Hirase et al., 2004; Parri & Crunelli, 2003). The degree and direction of the vascular response (vasoconstriction or vasodilation) depends on the Ca2+ concentration in astrocytic endfeets and perivascular K+ levels. A modest increase of Ca2+ in astrocytic endfoot leads to a vasodilatory reaction and a larger increase leads to a vasoconstrictory reaction (Girouard et al., 2010; Kowiański et al., 2013). When the extracellular K+ rises to 8-10 mM, inward rectifying K+ channels in vascular smooth muscle cells are activated and opened, leading
to an outflow of intracellular K+, a membrane hyperpolarization and a subsequent vasodilation (Gordon et al., 2007; Girouard et al., 2010; Nguyen et al., 2000; Price et al., 2002) whereas a larger concentration of extracellular K+ will cause the membrane depolarization and vasoconstriction, implicating local extracellular K+ as a vasoactive signal for both dilation and constriction (Dunn & Nelson, 2010; Girouard et al., 2010).
Astrocytes activated by the above-mentioned neurotransmitters may also feedback to neurons by way of gliotransmitters that are released under the coordination of astroglial Ca2+ oscillations (Haydon & Carmignoto, 2006; Parpura & Zorec, 2010) and biologically active substances (Kowiański et al., 2013; Mothet et al., 2005). Through different types of gliotransmitters, which include aminoacids (e.g., Glu, GABA and d-serine), nucleotides (e.g., ATP) and peptides (e.g., atrial natriuretic peptide, ANP and brain derived neurotrophic factor, BDNF) (Kowiański et al., 2013; Kozlov et al., 2006; Lee et al., 2011; Lee et al., 2010; Parpura & Zorec, 2010), and the indentities of receptor sensitivity, astrocytes may have an inhibitory or excitatory effect on many neurotransmitter systems, regulating neurovascular coupling (Araque et al., 1999; Halassa et al., 2009; Perea et al., 2009).
In summary, astrocytes contribute significantly to the neurovascular coupling through their modulation of metabolites, ions, gliotransmitters, neuronal activity and vascular tone (Figure 2.4) (Kowiański et al., 2013).
2.2.2. Metabolic activity and neurovascular coupling
When neuronal activity increases, metabolic activity will increase, and if the supply of cerebral oxygen is not adequate, the non-oxidative consumption of glucose will occur. This phenomenon leads to an increase in lactate produced by astrocytes resulting in vasodilation (Pellerin et al., 1998). There is a correlation between the increasing levels of lactate produced by astrocytes, the decreasing tone of the blood vessels and changes of arteriolar diameter (Carmignoto & Gómez-Gonzalo, 2010; Gordon et al., 2008; Kowiański et al., 2013). The increase in lactate reduces the uptake of PGE-2 from extracellular space, leading to an increase in PGE-2 and the resulting vasodilation (Chan et al., 2002). In contrast, when p02 is high and lactate concentration is low,
the extracellular PGE-2 decreases, evoking vasoconstriction (Gordon et al., 2008; Kowiański et al., 2013). In addition, the increase in metabolic activity results in the degradation of ATP, releasing adenosine that causes vasodilation (Li & Iadecola, 1994).
2.2.3. Neurovascular coupling during focal seizures in humans
Neurovascular coupling mechanisms that apply during normal cortical processing may not be relevant to the epileptic brain as seizures may place supranormal demands on the brain‟s autoregulatory mechanisms (Avoli et al., 2002; Folbergrová et al., 1981; Trevelyan et al., 2006). Several studies have looked at the hemodynamic response associated with seizures, in animals or humans, using various methods.
Alteration of cerebral blood flow during seizures was first observed by Penfield (Penfield, 1933; Penfield & Boldrey, 1937). In epileptic patients undergoing surgery, Penfield noted that
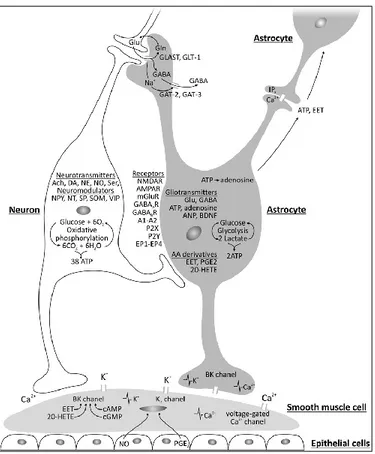
Figure 2.4. Factors involved in neurovascular coupling. The Ca2+ concentration in astrocytic endfeet and the level of K+ decides the vascular response (i.e., vasodilation or vasoconstriction). An increase of Ca2+ in the astrocytic endfoot activates BK channels, inducing the release of extracellular K+ that acts on the Kir channels of smooth muscle cells, evoking hyperpolarization (vasodilatation) or depolarization (vasoconstriction). Activated astrocytes signal back to neurons via gliotransmitters to modulate synaptic connections. Whereas astrocytic Ca2+ fluctuations form an intracellular signalling system based on diffusion of IP3 and Ca2+ through astrocytic gap
junctions, release of gliotransmitters (ATP and adenosine) and arachidonic acid derivatives (EET) supply the extracellular communication pathway between astrocytes (Kowiański et al., 2013).
during seizures induced by electrical stimulation of the cortex, an arrest of visible pulsation of pial arteries at seizure onset occured, with reddening of the cortex over the presumed seizure focus, and an enlargement of the adjacent veins with an arterial hue occurred. He concluded that focal seizures induce an increase in regional perfusion due to a capillary dilation persisting beyond the end of the focal seizure. These direct observations were subsequently validated in five subjects using thermocouple-based blood flow sensors: „during the seizure, there is an increase in circulation within the circumscribed area of cortex involved in the discharge that produces the fit. This increase begins within the first minute after the precipitating stimulus with no preliminary decrease in flow and it outlasts the clinical evidence of the seizure. More distant areas of cortex may show no alteration in blood flow as in Case 3, or there may be a decrease in circulation of short duration at the periphery of the involved area of cortex as in Cases 4 and 5‟ (Penfield et al., 1939). Even though focal seizures were associated with increased circulation, he cautioned that there was „no reason to conclude that the enormously increased need for oxygen on the part of the neurons is completely satisfied‟ and that „the tissues may still be in a state of severe anoxaemia‟. He provided the analogy of the muscle tissue during exertion: „a muscle suddenly called into use may double its circulation but if the muscle needs three times its resting circulation, the muscle tissue will be in a state of functional anoxaemia‟. Obviously, Penfield‟s observations were limited to the brain‟s surface and to the craniotomy‟s field of view with no possibility to study blood flow from more distant and contralateral regions.
Further insight on the neurovascular response during seizures was provided with the advent of ictal SPECT. This nuclear medicine test consists of the intravenous injection of a photon-emitting tracer (mostly 99mTc-ethyl cysteinate dimer or 99mTc-hexamethylpropyleneamine) at
the time of seizure. The photon-emitting tracer will accumulate rapidly within neurons (first tens of seconds) proportionally to cerebral blood flow. The photon-emitting tracer remains trapped in brain cells by intracellular conversion to polar metabolites with little regional redistribution or washout for up to 4 hours after the injection, allowing for the acquisition of images once the seizure has ended and the patient is stable. This explains why ictal SPECT images are relatively free of movement artifacts. Ictal SPECT images are then subtracted to a baseline interictal SPECT study to facilitate the identification of areas of increased perfusion specific to the seizure. Subtracted images can be co-registered to the patient‟s magnetic resonance imaging (MRI) to further enhance objectivity and accurate data interpretation. Compared to direct intraoperative observations of the exposed cortical surface and thermocouple recordings, this nuclear medicine technique has several advantages: its non-invasiveness, the ability to study spontaneous (rather than triggered) seizures, the possibility of examining perfusion changes from seizures of variable intensity (from simple focal seizures to focal dyscognitive seizures with or without secondary generalization) and more importantly the ability to study perfusion changes in the whole brain- from subcortical structures to bilateral cortical structures. The drawback is that the procedure is resource intensive as patients will require simultaneous video-EEG monitoring and the presence of a staff member who can inject the radiolabeled compound as soon as the seizure starts. Because it takes ~ 10-30s to inject the radiotracer (once one realizes a seizure has started), ~ 15-20s for the radiotracer to reach the brain and tens of seconds for cerebral uptake proportional to blood flow and trapping into brain cells, the resulting image is a static representation of the perfusion changes that cannot always discriminate between the zone of seizure onset and the areas receiving propagated epileptic activity (Goffin et al., 2008). Ictal SPECT has been extensively evaluated with hundreds of publications since the early 1990s. Overall, brief focal
seizures (auras or simple focal seizures) generally reveal little perfusion changes on ictal SPECT, most likely because seizure activity has already ended when the radiotracer is injected. However, with longer complex focal seizures, significant perfusion changes are noted. With temporal lobe seizures, an increase in perfusion is usually noted in the ipsilateral temporal lobe but significant increases in perfusion are also frequently seen in the ipsilateral insula and the contralateral temporal lobe, assumed to reflect seizure propagation to these areas. Other SPECT studies have shown significant ictal hypoperfusion of frontal, parietal and other remote areas (basal ganglia, cerebellum, precuneus) during temporal lobe complex partial (or dyscognitive) seizures (Blumenfeld et al., 2004; Menzel et al., 1998; Rabinowicz et al., 1997; Van Paesschen et al., 2003) while secondarily generalized temporal lobe seizures (even with short injection times) were associated with multiple hyperperfusion areas in the frontal, temporal, and basal ganglia regions (Chassagnon et al., 2005; Shin et al., 2002). With frontal lobe seizures, areas of significant increased perfusion are also noted in the seizure focus but frequently in other regions as well (ipsilateral and bilateral) as they are well known to propagate quickly through a dense network of connections (Duncan et al., 1997).
Perfusion changes after the seizure has ended can be assessed by injection of the tracer in the early postictal period. The postictal phase is characterized by a postictal switch occurring about 60 seconds after the seizure termination, when at the seizure onset zone hyperperfusion changes into hypoperfusion. In summary, studies with ictal SPECT confirm that focal seizures are associated with an increase in regional cerebral blood flow within the seizure focus but also in other remote regions. Because of its low temporal resolution, the single snapshot of cerebral blood flow obtained in the middle of or late into the seizure does not provide insight into the
early ictal hemodynamic response nor discriminate between changes related to epileptic activity in the seizure onset zone from those related to propagating epileptic activity.
In the last decade, combined EEG-fMRI has been used to study hemodynamic changes during epileptiform activity. Combined EEG-fMRI relies on the blood oxygenation level-dependent (BOLD) contrast caused by the increase in oxygen delivery (HbO is diamagnetic while HbR is paramagnetic) induced by epileptiform activity. Increases in CBF that outstrip changes in oxygen consumption reduce HbR and lead to an increased BOLD signal (activation); conversely, decreases in CBF that outstrip changes in oxygen consumption will increase HbR and cause a decreased BOLD signal (deactivation). However, EEG-fMRI studies have dealt mainly with interictal spikes rather than seizures as the latter are unpredictable and rarely occur during the typical one-hour scan, and because during a seizure even small movements by the patient can severely affect data quality (Gotman et al., 2006). Tyvaert et al. analyzed 10 subjects who presented asymptomatic electrical seizures or subtle/motionless limited focal seizures occurring during testing (Tyvaert et al., 2009). Dynamic analyses showed initial focal BOLD activations in the epileptic focus in 7 out of 10 patients but bilateral activation in the remaining three. A complex set of activations was observed immediately after the first significant activation, either ipsilaterally or contralaterally, which were attributed to quick seizure propagation. BOLD deactivations were also found during seizures, usually appearing after the first activation in areas close or distant to the activated regions, interpreted as areas of active inhibition or functionally disconnected from normally active regions (Tyvaert et al., 2009). The duration of BOLD changes could outlast EEG seizure duration. While the limited data emerging from the EEG-fMRI field on brief focal seizures also support the notion of increased cerebral blood flow within the seizure
focus, it unravels a complex set of BOLD activations and deactivations in areas close or distant (including contralaterally) to the seizure focus. The latter changes appear to occur even earlier than initially thought, at least based on what could be gleaned from ictal SPECT studies.
More recently, technical advances in functional near-infrared spectroscopy have provided an additional method to study the hemodynamic changes occurring during focal seizures. fNIRS is a neuroimaging technique based on the same basic principles underlying the pulse oximeter, a tool now widely used in hospitals to monitor peripheral blood oxygenation (Irani et al., 2007). Briefly, near infrared light is projected onto the scalp by optical fibres and transmitted through the intact skull. Photons penetrate into the brain and propagate diffusely into the tissue. While some photons are absorbed by hemoglobin, others are reflected back and captured by sensor probes. By using one wavelength more sensitive to HbR (e.g. 690 nm) and another more sensitive to HbO (e.g. 830 nm), variations in amplitude of backscattered light can be used to infer on local changes in blood oxygenation. Furthermore, assuming a constant hematocrit, changes in total hemoglobin HbT (HbO + HbR) can be used as an indicator of CBV variations. By performing measurements with multiple sources and detectors distributed over the scalp, one can monitor HbO, HbR and HbT/CBV changes, continuously and non-invasively, within the superficial cortex (Lloyd-Fox et al., 2010). Hence, continuous NIRS monitoring can theoretically track regional hemodynamic and oxygenation changes occurring before, during and after seizures, without the limitations of current perfusion based neuroimaging techniques such as SPECT and EEG-fMRI (Gotman et al., 2006). As mentioned above, both SPECT and EEG-fMRI do not enable continuous monitoring. Although spatial resolution is lower than EEG-fMRI, EEG-fNIRS can be performed in the clinic for continuous monitoring, is non-invasive, and does
not require complex artifact removal (as is necessary in EEG-fMRI) making EEG analysis and scoring more accurate. Furthermore, in contrast to fMRI, NIRS also provides access to both blood volume and oxygenation, which may help us to understand the metabolic changes occurring at the initiation and over the time course of seizures. Using simultaneous EEG-fNIRS, Nguyen et al. successfully recorded eight temporal lobe seizures from nine participants with refractory temporal lobe epilepsy ( Nguyen et al., 2012). Using this technique, an increase in HbT and HbO was noted in the seizure onset area during focal seizures, compatible with findings from other techniques mentioned above and normal neurovascular coupling. This increase in HbT (and HbO) most likely reflects a compensatory increase in local cerebral blood volume to increase the oxygen supply to the epileptic focus. Two relatively unexpected findings were observed during these temporal lobe focal dyscognitive seizures. First, after a brief initial decrease, HbR gradually rose as the focal seizure evolved, often outlasting the duration of the seizure, suggesting that the compensatory increase in HbO was insufficient to sustain the metabolic demands of abnormally discharging neurons and that the brain was in a state of relative hypoxia during these complex partial seizures (as suspected by Penfield). Another unexpected finding was the presence of significant early hemodynamic changes in the contralateral homologous region. Indeed, although late HbO, HbR and HbT changes in contiguous or even contralateral and remote regions are possible (even expected)-as focal seizures are well known to propagate, simultaneous or very early contralateral changes were unexpected as there was no clear evidence of seizure propagation to the other side on scalp EEG in the early moments of the seizure. These early contralateral „mirror focus‟ changes were confirmed in a subsequent EEG-fNIRS study of frontal lobe seizures and posterior lobe seizures ( Nguyen et al., 2013; Pouliot et al., 2014).
A final technique that has provided some insight into the haemodynamic behaviour during focal seizures is the intraoperative optical recording of intrinsic signals (ORIS). The intrinsic optical signal (IOS) is a small change in the absorption (or reflection) of light that occurs in neuronal tissue when neurons are activated. The surface of the brain is shined with visible lights with different wavelengths and images are acquired with a charge-coupled device (CCD) camera positioned above the cortex. Depending on the wavelength of light, the IOS can separately measure changes in CBV, hemoglobin oxygenation, or light scatter with a temporal resolution of 100 ms and spatial resolution of less than 200 m (Suh et al., 2006). At isobestic wavelengths of hemoglobin (525, 545, 570.5, and 583 nm), both HbO and HbR reflect light equally and hence directly correlate with HbT (or CBV, assuming the number of red blood cells remains constant). At wavelengths between 600 and 650 nm, most of the light is absorbed by reduced states of hemoglobin, as HbR absorbs light with three times the absorption coefficient of HbO. Therefore, a decrease in reflectance at these wavelengths indicates an increase in HbR. Using this technique, Zhao et al. showed interesting haemodynamic findings from a 45-year-old patient with periodic focal seizures (paroxysmal spasms of the left hemiface for 80s every 5 minutes) related to a small cavernous malformation in the face area of the right motor strip (Zhao et al., 2007). From the analysis of three spontaneous seizures, the authors reported a focal increase in both HbR and CBV that lasted for the duration of the seizure, indicating that perfusion was inadequate to meet metabolic demand (in line with observations made by Nguyen et al., using non-invasive EEG-fNIRS in temporal lobe seizures). Remarkably, these haemodynamic changes preceded the onset of the seizures by 20 s and occurred focally over the known location of the lesion and the
seizure onset (Zhao et al., 2007). Obviously, the clinical context did not allow recording from remote areas.
In summary, aforementioned findings from multimodal investigations in patients with focal epilepsy confirm an increase in cerebral blood flow occurring within the epileptic focus. However, several questions remain unanswered such as the timing of these hemodynamic changes with regards to seizure onset, the neuronal and hemodynamic changes occurring in areas contralateral and distant to the focus, and the adequacy of oxygen delivery to meet the metabolic demand during focal seizures. Some of these questions can be addressed using animal models of epilepsy bypassing some of the limitations in human studies.
2.2.4. Neurovascular coupling during focal seizures in animal models
Unfortunately, there is sparse fundamental animal data on the haemodynamic and tissue oxygenation changes in local and remote areas in the pathological state of focal seizures in animals. Using optical imaging during focal neocortical seizures induced by 4-AP in rats, Bahar et al. observed an increase in cerebral blood volume at the focus, as expected (Bahar et al., 2006). A persistent increase in HbR, consistent with a lengthy dip in oxygenation throughout the entire course of the seizure, was also observed in spite of the increase in cerebral blood volume at the focus. In line with studies by Nguyen et al. using EEG-fNIRS in humans with temporal lobe seizures summarized above, the authors concluded that „during the course of a seizure, an event that places a massive strain on the metabolic resources of the cortex, it is possible that the demand for oxygenated hemoglobin exceeds supply‟ (Bahar et al., 2006). Using a combination of laser Doppler flowmetry, oxygen microsensors and intrinsic optical imaging, Zhao et
al.observed a more complex and slightly different spatiotemporal dynamic of perfusion and oxymetry during ictal discharges in rats (Zhao et al., 2009). As expected, laser Doppler flowmetry demonstrated that cerebral blood flow increased in the focus for the duration of the seizure. As in the study by Bahar et al., optical imaging recordings showed an increase in HbR at the onset of seizures but only for a short moment; this HbR increase was then replaced by a delayed but longer increase in hemoglobin oxygenation at the focus (Bahar et al., 2006). Oxygen sensors confirmed an early tissue deoxygenation for a few seconds (13.6±2.9s) in the focus followed by a longer period of hyperoxygenation (45.2 ± 4.7s) during seizures (averaging 82.2 ± 10s). In some cases, the oxygen signal returned to baseline simultaneously with the offset of the seizure; on average, tissue pO2 returned to baseline ~20s before seizure termination. These
observations indicate that the influx of blood into the focus is inadequate to perfuse the hypermetabolic neurons for ~10s, after which there is a period of hyperperfusion and hyperoxygenation. These experimental findings support the idea that focal seizures elicit an increase in cerebral blood flow. There is also some evidence that the metabolic demand of abnormally discharging neurons is not entirely met by the increase in perfusion although the mechanism is not fully elucidated (ex. prevalence, duration, determining factors). These studies have mainly dealt with local haemodynamic changes associated with a neocortical (extratemporal) epileptic focus and have not assessed the changes occurring in contralateral and remote areas.
Hemodynamic changes in contralateral areas during epileptiform activity were first reported by Schwartz and Bonhoeffer, who noted a change in the optical signal in the contralateral homotopic area, which was smaller and slightly more delayed than the signal recorded ipsilateral
to the focus during intrinsic optical imaging (IOI) recording of BMI induced spikes (not seizures) (Schwartz & Bonhoeffer, 2001). More recently, the same group reported that 4-AP induced focal seizures elicit an ipsilateral local increase in cerebral blood volume but a paradoxal contralateral decrease in cerebral blood volume in spite of increased neural activity on microelectrode recording (Harris et al., 2014). As for changes in more remote areas, a study by Englot et al. combining electrophysiological recordings from ipsilateral hippocampus and orbitofrontal regions, fMRI and laser-Doppler flowmetry, reported that electrically stimulated partial hippocampal seizures in rats were associated with ictal frontal neocortical slow activity, significant decreases in neuronal firing, haemodynamic measurements (BOLD, CBV, CBF), and cerebral metabolism (CMRO2) while secondarily generalized hippocampal seizures showed frontal fast polyspike seizure activity, significant elevations in electrophysiological responses (local field potentials and multiunit activity), haemodynamic measurements (BOLD, CBV, CBF), and CMRO2 (Englot et al., 2008). These findings further support the fact that mesiotemporal lobe seizures have long-range effects whether they propagate to distant regions or not.
Clearly, additional animal studies are required to reproduce and confirm some of the findings mentioned above and to resolve some conflicting data on the timing of local haemodynamic changes as well as the occurrence, characteristics and pathophysiology of contralateral and remote hemodynamic changes.
In this study, we will induce focal seizures by injection 4-aminopyridine (4-AP) in the mouse somatosensory cortex and attempt to better characterize the hemodynamic changes in the
contralateral homotopic area using first intrinsic optical imaging (similar to experiments by Harris et al. reported above) and then two-photon microscopy (see below).
2.3. Rationale for the use of the 4-AP epilepsy model
4-AP is a K+ channel blocker that stimulates the release of both excitatory and inhibitory neurotransmitters in synaptosomes and produces intense epileptiform activity in brain slices and in vivo. An enhancement of glutamatergic transmission has been related to the convulsant action of 4-AP (Peña & Tapia, 1999). Depending on site of infusion, 4-AP has the ability to model human mesiotemporal (hippocampal) lobe seizures as well as neocortical seizures. Rat intrahippocampal perfusion of 4-AP through microdialysis probes produces intense EEG seizures associated with neuronal damage in the CA1 and CA3 regions (Peña & Tapia, 1999). Perfusion with 70 mM 4-AP in the hippocampus induces intense epileptiform discharges characterized by an initial hypersynchronic activity lasting 10 s, followed by trains of high-amplitude spindles that last for 40 s. These seizure discharges appear with a latency of 12 min after the beginning of 4-AP perfusion and occur with a frequency of 0.60 min, persisting until the end of the microdialysis collection. The discharges propagate to the ipsi- and contralateral cortex with a lower intensity. With decreasing concentrations of 4-AP, there is a progressive reduction in the duration and intensity of the discharges until no effect is observed with 0.7 mM 4-AP (Peña & Tapia, 1999). Similar to intrahippocampal perfusion, injection of 15 mM 4-AP through a glass microelectrode into the rat neocortex can produce spontaneous ictal discharges occurring periodically for up to 2 h with a mean duration of 100 s and interseizure interval of 20-600 s (Zhao et al., 2009). A higher dose, 25 mM 4-AP, induces longer seizures ( 274 s) with
suited to study the dynamic haemodynamic and tissue oxygenation changes in local and remote areas during focal hippocampal or neocortical seizures of varying duration.
2.4. Rationale for the use of two-photon microscopy
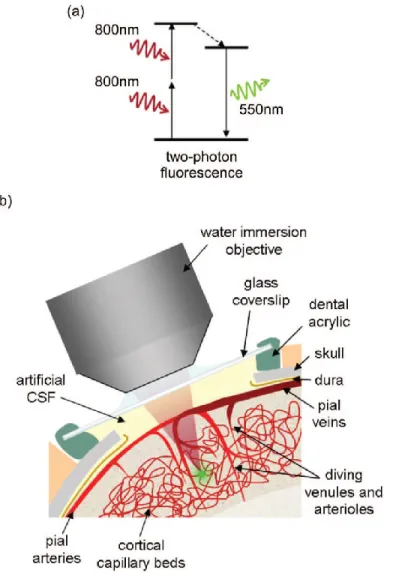
Two-photon microscopy is an optical imaging technique that uses laser light of long wavelengths to excite fluorophores and capture fluorescence to capture in-vivo brain cellular activity and microvascular behaviour (Denk, Strickler, & Webb, 1990). Optical imaging uses light to image the brain, relying on compounds and structures in the tissue that provide optical contrast. With two-photon microscopy, optical contrast is provided by the use of various injected fluorescent optical contrast agents. A pulsed laser light is then used to induce fluorescence excitation at the very focus of the laser beam. Because the energy of the beam is inversely proportional to the wavelength, if the wavelength of excitation is increased by twofold, the energy of the excitation photon decreases by one-half. For example, 800 nm light with sufficient flux will excite a fluorophore that would otherwise excite at around 400 nm (because two photons are absorbed at virtually the same instant). Whenever excited fluorophores return to the ground state, a photon at its usual emission wavelength (e.g. 500 nm) will be emitted (Figure 2.5) (Helmchen & Denk, 2005). Emission light is captured by a detector to form an image of fluorescent structures within the tissue. Because light of longer wavelength travels more deeply into tissue, two-photon microscopy can image deeply into tissue (500-600 microns). Furthermore, because longer wavelength does not scatter or absorb as much as visible light, it can image at higher resolution (< 1 micron) (Hillman and Burgess, 2009).
By introducing fluorescent contrast into the cells and lumen of the vessels, two-photon microscopy captures images of cellular and microvascular activity.
Figure 2.5. Two-photon microscopy of in vivo brain microvasculature. a- Mechanism of two-photon fluorescence. b- Schematic of surgical preparation to image the cerebral vessels with a microscope objective. Green dot shows location of two-photon fluorescence (Hillman, 2007).
2.5. Rationale of combined electrophysiology recording and two-photon microscopy
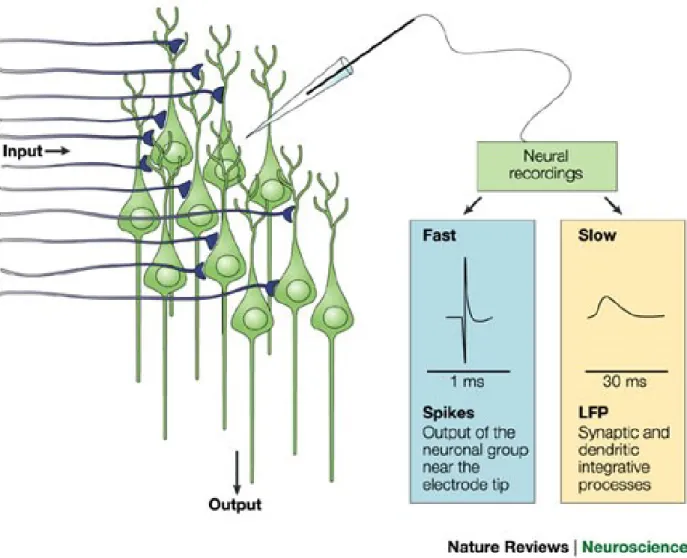
Because the goal of this study is to relate hemodynamic changes to underlying neuronal activity, direct measurement of neuronal activity with electrophysiology recording (multi-unit activity and local field potentials) is essential. The method of recording the actions of many neurons is called multiple-unit spiking activity (MUA) recording. MUA is most likely a weighted sum of extracellular action potentials of all neurons in a sphere of radius about 140-300 µm, with the electrode located at its center (Logothetis, 2003). An action potential is an event in which the electrical membrane potential of a cell rapidly rises and falls for a short time, following a consistent course. In neurons, action potentials play a central role in cell-to-cell communication and they are also known as "nerve impulses" or "spikes". They are generated by voltage-gated channels located in the plasma membrane of a cell (Barnett & Larkman, 2007). These channels are closed when the membrane potential is near the resting potential but they rapidly begin to open if the membrane potential increases to a threshold value. When the channels open, there will be an inward flow of sodium ions, which in turn produces a further rise in the membrane potential. The rapid influx of sodium ions causes the polarity of the plasma membrane to reverse, and the ion channels then rapidly close. As a result, sodium ions cannot enter the neuron anymore and are actively transported out of the plasma membrane. Potassium channels are then activated, and there is an outward current of potassium ions, returning the electrochemical gradient to the resting state. The currents of action potentials produce currents in the extracellular medium. It is possible to use an electrode with an exposed tip of 100 µm (impedance of 40-120 kΩ) to record the extracellular action potentials within a sphere with a radius of 50 to 350 µm but this technique does not inform on the ionic events that are not big enough to produce the action potential evoking the voltage changes of the cell membrane (Gray et al. 1995).
Local field potentials (LFP) are the low frequency range of the mean extracellular field potentials (Figure 2.6). They represent mostly slow events reflecting cooperative activity in neural populations and have been suggested by some to mostly represent synaptic activities (Logothetis, 2003). This suggestion arose from work by researchers who combined EEG and intracortical recordings and found that the slow wave activity in the EEG is independent from the neuronal spiking (Buchwald et al., 1965; Fromm & William Bond, 1967). These studies showed that the magnitude of the slow field fluctuations and cell size is not linear, but represents the extent and geometry of dendrites in each recording site. LFP actually reflect synchronized synaptic signals of a neural population within 0.5–3 mm of the electrode tip (Juergens et al., 1999; Mitzdorf, 1987). There is a good correlation between the LFP and the MUA. However, the LFP also integrate the dendritic activities that do not lead to the action potential (Mathiesen et al., 1998), so there may be some instances where LFP do not correlate with the MUA. LFP and MUA are both good predictors of hemodynamic response but it seems that LFP outperform MUA (Logothetis, 2003; Mathiesenet al., 1998). Therefore LFP recording combined with two-photon microscopy will allow us to explore the hemodynamic changes during epileptic events.
Figure 2.6. Recordings of neural activity. Microelectrodes located at a distance (> 50 µm) from a group of neurons capture electrical fast activity, which reflects the output of the neurons in the area (spike), slow potentials indicating local integrative neural events (LFP) (Iadecola, 2004).
Chapter 3
Experimental Methods
This chapter describes steps of our experiments to study the hemodynamic changes in contralateral homotopic area to the epileptic focus during acute focal seizures in mice. The IOI experiments were performed to observe changes in HbR, HbO and CBF whereas two-photon experiments were done to study the behavior of blood vessels during acute focal seizures.
3.1. IOI experimental preparation 3.1.1. Animal preparation
Adult B6 mice were used in these experiments. Mice were initially anaesthetized by 10% w/v urethane with a dose of 200µl per 10g of body weight injected intraperitoneally. After 10-15 minutes, the surgical level of anaesthesia was verified by checking for a lack of pinch withdrawal and eyelid reflex. If there was a reflex, an additional half-dose of urethane was provided and the eyelid reflex repeated to make sure that the surgical level of anaesthesia was reached. The body temperature was controlled and maintained at 37oC by a feedback controlled warming pad (MouseSTAT, Kent Scientific, Torrington, CT). The heart rate and respiration were monitored with a single lead ECG amplifier (amp-b01, emka TECHNOLOGIES, Paris) and a pressure tranducer. Their values were targeted to center around 10 and 2 Hz, respectively. A data acquisition card (NI0USB 6353, National Instruments, Austin, TX) was used to digitize all vital signs. A tracheotomy was done in order to avoid severe respiratory distress related to the accumulation of saliva and airway secretions in the respiratory tract during urethane anaesthesia (Moldestad et al., 2009).
Scalp was removed to expose the skull and a burr hole of 0.5mm was performed using a 22-G needle at coordinates 0.8 mm from bregma and 2.0 mm lateral to the midline in order to inject 4-AP in the somatosensory cortex and record the electrophysiology. The mouse was put on a stereotaxic frame fitted with atraumatic ear bars. A circle of bone wax was attached to the skull with ultrasound gel to create a chamber which is filled with mineral oil to prevent the exposed skull from drying.
3.1.2. IOI experimental protocol 3.1.2.1. 4-AP injection
We provoked recurrent focal seizures by injecting 0.5µl of K+ channel antagonist 4-AP (A78403, Sigma-Aldrich, St. Louis, MO) solution (15mM in normal saline solution) into the somatosensory cortex at a depth of 500 µm below cortical surface over a period of 10 minutes through a Hamilton syringe that was connected to a micro needle 36G (NanoFil, World Precision Instrument, Sarasota FL) and was mounted on a micro-syringe pump controller (uMC4, World Precision Instruments, Sarasota FL). The injection was carried out under the microscope to ensure that the micro needle was inserted correctly into the cortex at a depth of 500 µm. The micro needle was withdrawn 20 minutes after injection to prevent the 4-AP from escaping through the injection site (Yang et al., 2002).
3.1.2.2. Electrophysiological recording
After the injection of 4-AP, the micro needle was withdrawn and a tungsten electrode (0.5-2MΩ) was inserted through the burr hole at a depth of 500µm into the cortex to record the LFP (Figure
3.1). An Ag-AgCl ground electrode was placed on the skin of the mouse and a tungsten reference electrode was inserted inside the tissue near the tungsten electrode. It should be noted that the insertion of the electrode inside the brain reduced the amplitude of the neuronal response. The ground electrode prevents the recording electrode from polarizing and producing high frequency artifacts during the signal recording.
The recorded signal was amplified 1000 times and band-pass filtered between 10-1000 Hz with a standard AC amplifier (model 1800, A0M systems, Sequim, WA) and digitized (10kHz). The LFP data were stored using PC-based hardware and software (Labview, National Instrument). Epileptiform activities included spikes and seizures. Seizure onset and termination manifested as abrupt changes in LFP frequency and amplitude. Seizures that lasted less than 5s were considered spike trains.
3.1.2.3. Optical imaging of intrinsic signal and speckle contrast 3.1.2.3.1. Optical imaging recording
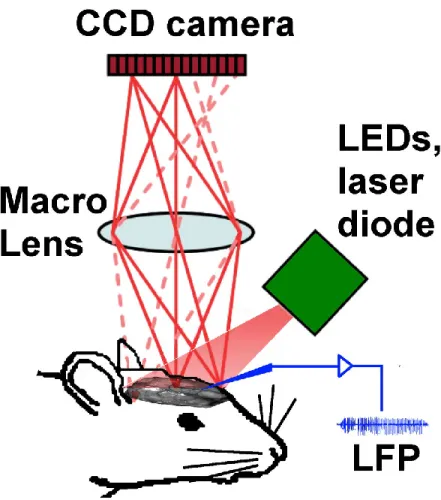
The bone wax chamber was filled with mineral oil. Mouse brain cortex was shined with 10W LEDs (LZ4-00MA00, Led Engin, San Diego, CA) with time-multiplexed illumination (525, 590, 625 nm). Intrinsic optical signal was captured with a 12-bit CCD camera (Pantera 1M60, DS-21-01M60-12E, Teledyne Dalsa, Waterloo, ON) with a physical pixel size on chip of 12 μm and full resolution of 1024 × 1024 pixels. A macro lens (105 mm f∕2.8 max, Sigma Corp., Ronkonkoma, NY) with small focal depth (350 μm) was used. A 90 mW, 785 nm laser diode (L785P090, Thorlabs, Newton, 49 NJ) is used to light the brain cortex to get speckle imaging and aperture was adjusted to f/8, so that the pixel size and speckle size were matched (Figure 3.1). A
custom-made interface Labview is used to synchronize acquisition and illumination as well as to control the camera, record images and vital signs. Illumination was adjusted to prevent the cortex from being saturated by any of the wavelengths. The four multiplexed wavelengths were interlaced with a frame of 5Hz for each wavelength. The camera's shutter speed was set at 10 ms.
3.1.2.3.2. Processing of intrinsic signal data
A CCD camera captured the reflectance light from each LED wavelength and the reflectance images were interpreted as changes in intensity (optical density):
R∆,i(λ,t) =
Ri,0(λ) is incident light intensity and R(λ,t) is the reflectance light intensity.
The change of optical density were converted into the change of HbO and HbR according to the modified Beer–Lambert law (Delpy et al., 1988)and a Moore–Penrose pseudoinverse:
∆OD(λ,t) = log
∑ i(λ)∆CiDa(λ)
The two principal chromophores in brain are HbO and HbR. Three wavelengths (525, 590, 625 nm) were used in our experiments, so the change of HbO and HbR could be obtained by the following equation (Dunn et al., 2003; Dunn et al., 2005, Kohl et al., 2000):
(
)
=(
)
+(
)
i and Ci are the molar extinction coefficients and concentrations for the chromophores. D(λ) is
differential path length factor and depends on the scattering and absorption properties of tissue because it takes into account the different path lengths traveled by light. D(λ) was taken from (Dunn et al., 2005) and values of wavelengths out of the 560- to 610-nm range were extrapolated
from (Kohl et al., 2000). Baseline concentrations of 60 μM and 40 μM for HbO and HbR were assumed for the spectroscopic analysis (Dunn et al., 2005). Images of each chromophore (HbO, HbR) were spatially smoothed with a Gaussian kernel of 11 × 11 pixels (0.6×0.6 mm) with a 5-pixel standard deviation (0.3 mm) (Guevara et al., 2013).
3.1.2.3.3. Calculating CBF by speckle contrast imaging
In addition to calculating HbO and HbR changes by imaging intrinsic signal, changes in CBF were computed by laser speckle contrast imaging. When mouse brain cortex is illuminated by laser light, a part of the light returning to the tissue surface because of scattering event will be captured by the CCD camera and speckle pattern originating from random interference pattern will be produced. When the scattering particles move in tissue, the interference pattern will be modified, which causes the fluctuation of the speckle pattern. Laser speckle imaging quantifies flow information by measuring the spatial characteristics of the intensity fluctuations (Dunn et al., 2001). Integrated over the exposure time of the camera, an increase in blood flow will induce a blurr in raw image which can be measured by spatial contrast C, defined as the ratio of the standard deviation to the average intensity δ/‹I› in a given spatial area. The contrast C is a function of the CCD camera exposure time T and is related to the correlation time τC of the
speckle, which is assumed to be inversely proportional to the mean velocity of the scatters v (Briers, 2001). 5x5 pixels window was used to calculate the contrast image and the relative change of blood flow ∆v/v0 was obtained by the following formula (Duncan & Kirkpatrick,
2008; Dunn et al., 2001; Dunn et al., 2005) C= , ≈ ≈
Because the value of ∆v/v0 laser speckle imaging takes into account both static and
movingscatters and underestimate CBF by less than 5%, both quantities were assumed to be equal in this work (Luckl et al., 2010).
Figure 3.1. Set up of intrinsic optical imaging system. Mouse brain cortex was shined with LEDs and laser diode with time-multiplexed illumination. Intrinsic optical signal and speckle imaging were collected with a CCD camera. Tungsten electrode is inserted into the burr hole to record LFP (Guevara et al., 2013).
3.2. Two-photon experimental preparation 3.2.1. Animal preparation
Adult B6 mice were anesthetized and vital signs were monitored using the same procedures as for IOI experiments (see 3.1.1).
A catheter was placed in the right jugular vein to inject a Fluorescein isothiocyanate-dextran (FITC-dextran) dye with high molecular weight into the vessels' lumen. In order to prevent the formation of blood clots that may lead to pulmonary embolism when FITC-dextran is injected, the catheter in the jugular vein was also filled with a 200UI/ml Heparin solution. Then, a tracheotomy was done.
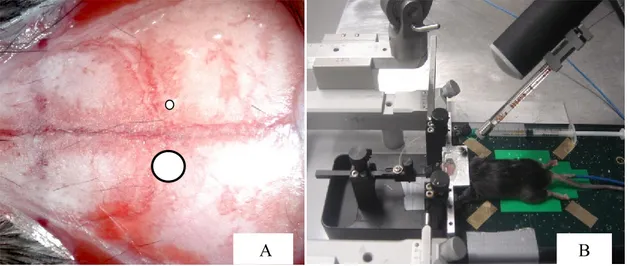
The skull of the mouse was then attached to a custom-made metal frame with dental acrylic for immobilization during imaging. A circular craniotomy 2.0mm in diameter was performed over the left somatosensory cortex at coordinates 0.8 mm from bregma and 2.0 mm lateral to the midline with a 1/2-mm burr drill. The dura mater was maintained intact to minimize motion artifact caused by heartbeat and respiration, and disruption of the intracranial milieu. The surgery was performed as gently as possible and pressure onto the skull was avoided to prevent brain damage. 1% low melting point agarose, dissolved in modified artificial cerebrospinal fluid free of carbonate and phosphate precipitates (125 mMNaCl, 10 mM glucose, 10 mM HEPES, 3.1 mM CaCl2, 1.3 mM MgCl2, pH 7.4) (Kleinfeld & Delaney, 1996), and a glass cover slip no. 0
were placed on the cranial window to cover the brain and establish pressure to minimize the motion artifact caused by brain pulsation during imaging. The agarose was dissolved by heating in a microwave and its temperature checked to be below 370C before it was applied to the brain.