The Role of Interleukin-1! on the
Expression of Nestin in Cardiac
Neural Stem cells Following
Myocardial Infarction
Par
Alexandre Khan
Départment de Physiologie, Université de Montreal
Faculté de Médecine
Mémoire présentée à la Faculté de médecine
en vue de l’obtention du grade de maîtrise
en physiologie
Décembre 2011
©, Alexandre Khan, 2011
Université de Montreal
The underlying biological event(s) implicated in the increased expression of nestin in cardiac resident neural stem cells (NSC) following myocardial infarction (MI) remain unknown. Past studies have shown that dexamethasone treatment, a synthetic glucocorticoid with potent anti-inflammatory properties, abolished the upregulation of nestin in the non-infacted left ventricle (NILV) following MI. This suggests an association with the inflammatory response. The present study tested the hypothesis that the inflammatory cytokine interleukin-1! (IL-1!) can influence the neural stem cell phenotype. A secondary goal of the study was to assess impact of IL-1! signalling inhibition on cardiac function and wound healing following MI. Following complete coronary artery ligation of the adult male rat heart, left ventricular contractile dysfunction was associated with the upregulation of the pro-apoptotic protein bax, the anti-apoptotic protein Bcl-2 and nestin in the non-infarcted myocardium. Xoma 052 (1 mg/kg), an IgG antibody directed against IL-1!, was administred 24 hrs after ischemic injury and subsequently injected 2x over a period of 21 days. Treatment did not alter infarct size or improve left ventricular contractility. In addition, it failed to abolish the increased expression of nestin and Bcl-2, and modestly reduced bax protein levels. To directly assess the relationship between inflammation and the expression of nestin in the absence of an ischemic insult, adult male rats were injected with lipopolysaccharide (LPS) (10mg/kg;18 hrs). In the heart of LPS-treated rats, IL-1! mRNA levels were significantly increased and associated with elevated nestin protein expression. The pre-treatment with Xoma 052 (10mg/kg) abolished the increased expression of nestin in the heart of LPS-treated rats. These data indicate that neural stem cells may represent a target for IL-1!. However, futher investigation is required to elucidate the role of IL-1! on NSC following MI.
Le mécanisme biologique responsable pour l’augmentation de l’expression de la protéine nestin dans les cellules souches neurales (CSN) du cœur après un infarctus du myocarde (IM) demeure inconnu. Des études antérieures ont démontré que le traitement au dexamethasone, un glucocorticoïde aux propriétés anti-inflammatoires, abolit la régulation positive de nestin après un IM. Ceci suggère un lien avec la réponse inflammatoire. Nous avons vérifié dans cette étude l’hypothèse que la cytokine inflammatoire interleukin-1 ! (IL-1!) peut modifier le phénotype de cellules souches neurales. Le deuxième objectif de l’étude fut d’établir l’impact, suivant un IM, de l’inhibition de la signalisation de IL-1! sur la fonction et la guérison cardiaque. Suite à une ligature complète de l’artère coronaire du rat mâle, le dysfonctionnement contractile du ventricule gauche fut associé à une régulation positive de la protéine nestin dans le myocarde non-infarci. Le traitement avec Xoma 052 (1 mg/kg), un anticorps anti-IL-1!, 24h, 7 et 14 jours après un évènement ischémique, eu aucun effet sur la taille de l’infarctus ou la contractilité du ventricule gauche. De plus, le traitement avec Xoma 052 après un IM n’a pu supprimer l’augmentation de l’expression de nestin et Bcl-2 malgré une réduction modeste du niveau de la protéine Bax. Pour déterminer directement le rôle de la réponse inflammatoire en l’absence d’ischémie, nous avons injecté des rats mâles avec du LPS (10mg/kg, 18hrs). Dans le coeur du rat-LPS, nous avons noté une augmentation significative du niveau d’ARNm de IL-1! et de l’expression de la protéine nestin. Le prétraitement avec 10mg/kg de Xoma 052 a aboli l’augmentation de l’expression de nestin dans le coeur des rats-LPS. Ces observations indiquent que les cellules souches neurales pourraient représenter une cible potentielle de l’IL-1!.
Table of Contents
Abstract………...……….……….………..i
Table of Contents………..………..…...……….……vii
List of Figures ………..……….viii
List of Tables………...……….……….x
List of Abbreviations………...…..………..……...…xii
Acknowledgments…….………..xv
Introduction……….………...………..…….1
1. Myocardial Infarction………..……….…2
2. Left Ventricular Remodeling Post-MI……….…………...3
2.1 Early Remodeling……….………...…....3
2.2 Late Stage Remodeling: Hypertrophy………...……..4
2.3 The Apoptotic Response Following Myocardial Infarction…...….………....5
3. Nestin and Nestin(+) Cells in the heart………...8
3.1 Myofibroblast………..………..….13
4. Immune Response to MI……….14
4.1 Overview……….………….………..14
4.2 The Role of IL-1!………..……....15
5. Administered Drugs………...………….……17
5.1. Lipopolysaccharide……….…..…..…..17
5.2 Xoma 052……….…………...…….…..18
Objectives………...……….……...21
Materials & Methods………..23
Results………...…..….31
Discussion………...…………..…....56
Conclusion………...………...…..65
List of Figures
Introduction
Figure 1: Myocardial Infarction Figure 2: Ventricular Remodeling
Figure 3: Neural Stem Cell from Rat Atria Figure 4: Nestin(+) Myocyte-like Cell Figure 5 : Il-! Membrane bound receptors Figure 6 : Intracellular targets of IL-1R1 Figure 7 : LPS Structure
Figure 8: Xoma 052 Dose response
Results
Figure 1 : Nestin protein expression in LV of Sham and MI Rats treated with 0.1mg/kg of Dexamethasone
Figure 2 : Remodelling of the NILV of MI rats treated with 1mg/kg of Xoma 052 Figure 3: Nestin Protein expression in the LV of the rat heart treated with 1mg/kg
of Xoma 052
Figure 4 : Nestin mRNA expression in the LV of rat heart following administration of LPS (10mg/kg) and Xoma 052 treatment.
Figure 5 : Il-1! mRNA expression in the LV of rat heart following administration of LPS (10mg/kg) and Xoma 052 treatment
Figure 6 : TNF-" mRNA expression in the LV of rat heart following administration of LPS (10mg/kg) and Xoma 052 treatment Figure 7 : MCP-1 mRNA expression in the LV of rat heart following administration of LPS (10mg/kg) and Xoma 052 treatment Figure 8 : Western Blot of Nestin Protein in LV of Sham and LPS Challenged Rats treated with Xoma 052.
Figure 9 : Nestin Protein expression in the LV of rat heart following administration of LPS (10mg/kg) and Xoma 052 treatment
List of Tables
Table 1 : Nestin Protein Expression in LV of sham and MI Rats treated with 0.1mg/kg of Dexamethasone
Table 2 : Body and heart weights of sham and MI rats treated with 0.1 mg/kg of IgG or XOMA52
Table 3 : Hemodynamic Data of sham and MI rats treated with 0.1 mg/kg of IgG or XOMA52
Table 4 : Body and heart weights of sham and MI rats treated with 1 mg/kg of IgG or XOMA52
Table 5 : Hemodynamic Data of sham and MI rats treated with 1 mg/kg of IgG or Xoma 052
Table 6 : Echocardiographic Measurements
Table 7 : Left ventricular ANP and SERCA2 mRNA levels of sham and MI rats treated with 1 mg/kg of IgG or XOMA 052
Table 8 : Western blot data of sham and MI rats treated with 1 mg/kg of IgG or XOMA 052
Table 9 : mRNA levels of the infarct region of sham and MI rats treated with 1mg/kg of IgG or XOMA 052
Table 10: Survival of sham and LPS Challenged Rats treated with 1-10mg/kg Xoma 052
Table 11 : Body Weight and Hemodynamic data of sham and LPS-challenged rats treated with 0.1mg-1mg/kg of Xoma 052
Table 12 : Western Blot Protein levels from Left Ventricle of sham and LPS challenged rats treated with 1 and 10 mg/kg of XOMA 052
List of Abbreviations
": Alpha
ANF: Atrial Natriuretic Peptide ApoE: Apolipoprotein E
ATP: Adeonsine triphosphate
!: Beta
Bax: Bcl-2 associated X protein Bcl-2: B cell CLL/lymphoma 2 BSA: Bovine serum albumin BW: Bodyweight
cDNA: complementary DNA CNS: Cardiac Neural Stem Cell
CTGF: Connective Tissue Growth Factor Dex: Dexamethasone
DMEM: Dulbecco’s Modified Eagle Medium DNA: Deoxyribonucleic acid
E. Coli: Escherichia Coli
ECL: Electrochemiluminescence EGF: Epidermal Growth Factor FAC: Fractional area shortening
#: Gamma
GAPDH: Glyceraldehyde 3-phosphate dehydrogenase H2O: Water
HMGB: High-mobility Group protein B HR: Heart Rate
IFN: Interferon
IgG: Immunoglobulin G IL: Interleukin
IL1R1: Interleukin 1 Receptor 1 IP: Intraperitoneal
IRAK: Interleukin 1-receptor Associated Kinase
$: kappa
kDa: Kilo Dalton
LPS: Lipopolysaccharide LV: Left ventricle
LVD: Left ventricular systolic dimension LVEDP: Left ventricular end-diastolic pressure LVFS: Left ventricular fractional shortening LVPWV: Left ventricular posterior wall velocity LVSP: Left ventricular systolic pressure
MI: Myocardial infarction
mRNA: Messenger ribonucleic acid MCP-1: Monocyte chemotactic protein-1 MMP: Matrix Metalloproteinase
Mn-SOD: Manganese Superoxide dismutase
NF: Nuclear Factor
NILV: Non-infarcted left ventricle PBS: Phosphate buffered saline PCR: Polymerase chain reaction RNA: Ribonucleaic Acid
RV: Right ventricle
SAP: Stress Activated Protein SDS: Sodium dodecyl sulfate SBJ: Super blue juice
SERCA: Sarcoplasmic reticulum calcium-ATPase SMA-": Smooth muscle " –actin
TGF-!3: Transforming growth factor beta-3 TIMP: Tissue Inhibitor of Metalloproteinase TLR: Toll-like Receptor
TNF: Tumor necrosis factor
TRAF6: TNF receptor associated factor 6 VEGF: Vascular Endothelial Growth Factor !
Acknowledgments
Most importantly, I would like to thank Angelo for giving me the
fantastic opportunity to join his lab and learn as a member of his team. I truly
appreciate the time and effort you put in to teach me the foundations of
scientific research. I have without a doubt gained a vast amount of skills and
ideas, which will help guide me in my future endeavours. Academics aside, it
was also very stimulating discussing a wide variety of topics ranging from
history to politics and especially your opinions on minor hockey.
I would also like to thank Hugues for his unbreakable patience and good
company. It would also be impossible to forget Pauline, Natasha and Louis for
I would have been completely lost without their help and guidance.
1. Myocardial Infarction
A myocardial infarction (MI) is caused by an occlusion of one or more coronary arteries that supply oxygenated blood to the myocardium. The blockage caused by the rupture of atherosclerotic plaque blocks the flow of blood leading to ischemia. The resulting state of hypoxia experienced by the ischemic tissue leads to the damage and death of the affected cardiomyocyte population.
Figure1. Occlusion of coronary artery causing Myocardial infarction Source: http://www.medicinenet.com/heart_attack/article.htm
The resulting damage to affected tissue initiates a cascade of local physiological and cellular events that significantly compromise the function of the remaining viable myocardium. Decreased cardiac function characterized by a drop in mean arterial blood
pressure and LV dp/dt indices lead to hypertrophy of left ventricle. The inflammatory response initiated by the release of pro-inflammatory cytokines and chemokines contributes to would healing via scar formation.
2 Left Ventricular Remodeling Post-MI
2.1 Early Remodeling
Following myocardial infarction, the ventricle undergoes a plethora of physiological changes including dilation, hypertrophy and scar thinning. Globally, these changes are referred to as ventricular remodeling and are the primary factors associated with increased mortality and morbidity in patients having suffered from an ischemic insult.
In the early stages of ventricular remodeling, the cardiac myocytes of the ischemic tissue undergo necrosis and the surrounding collagen network begins to degrade due to changes in the balance of matrix metalloproteinase to tissue inhibitor of metalloproteinase (MMP/TIMP) (1). Three to four days following infarction, the infarct region is invaded by phagocytic cells including macrophages and neutrophils to remove the necrotic tissue. About 5 days after the ischemic insult, an expansion of the infarct region is observed. This expansion has been described as the acute dilation and thinning of the infarct area which leads to a dilation of the ventricular cavity. The preceding degradation of the collagen matrix decreases the structural support for cardiac myocytes. The side-to-side slippage of the cardiac myocytes is the primary reason for the expansion of the infarct area(2). The ensuing dilation of the ventricular cavity leads to decreased
contractile force, a decrease in the ejection fraction of the ventricle and an overall decrease in cardiac function(3).
"!
Figure 2. Dilation of the left ventricle following myocardial infarction. Source: http://stemcells.nih.gov/info/2006report/2006Chapter6.htm
Subsequently, the necrotic tissue is reabsorbed by the invading phagocytic cells and migrating myofibroblasts deposit large amounts of collagen fibers which stabilizes the infarct area(4).
2.2 Late Stage Remodeling : Cardiac Hypertrophy
Once a sufficient amount of collagen has accumulated, a scar forms and the infarct ceases to expand when the distending forces are balanced by the tensile strength of the scar(5). The resulting increase in wall stress caused by the expansion of the ventricular cavity provides the physiological stimulus to initiate a cascade of signaling events(6) leading to
cardiac hypertrophy. This event represents an adaptive response of the infarcted myocardium which serves to attenuate dilation and stabilize cardiac function(5). Indeed, microscopic observations have determined that myocyte volume can increase up to 70%(7). Myocyte hypertrophy is induced by mechanical stress and various other stimuli such the renin-angiotensin system and paracrine/autocrine signals(5) induced to compensate for the decrease in cardiac output.
2.3 The Apoptotic Response following Myocardial infarction
Following myocardial infarction, a substantial number of cardiomyocytes in and around the ischemic zone are lost. The oxygen deprivation resulting from the blockage in arterial blood flow directly causes the death of many cardiomyocytes via necrosis. However, a substancial number also succumb to apoptosis. Apoptosis is an evolutionary conserved process of programmed cell death crucial to the normal functioning of multicellular organisms. The pathways that mediate apoptosis are more than one billion years old and essential to many fundamental biological processes such as proliferation, differentiation, death, inflammation, and immunity(8). The apoptotic response can be triggered in cardiac myocytes by a variety of stimuli including hypoxia, especially after reperfusion, oxidative stress, acidosis and glucose deprivation(8). It is therefore not surprising that the dammage resulting from a coronary artery occlusion can trigger a large apoptotic response in the heart. Apoptosis seems to occur in cells both close and distant to the necrotic region. However, the response seems to be at its pinnacle in the peri-infarct region, with one study reporting apoptotic features in 12% of cardiac
myocyte nuclei(9). Compared to necrosis, the apoptotic response occurs in a planned and organized fashion, which makes it an attractive therapeutic target to attenuate damage to the myocardium and consequently cardiac function following an ischemic event.
The apoptotic pathway is in part regulated by the action of proteins belonging to the Bcl-2 family, initially isolated from a gene encoded in B-cell lymphoma. A plethora of proteins belonging to this family were identified and classified into three groups based on their general function(10). Group I members, which include Bcl-2 protein itself, all have anti-apoptotic properties. An increase in their expression should reduce the apoptotic response. Members of group II, which include Bax and Bak, are death agonists with pro-apoptotic properties. Their increased expression promotes cell death by facilitating the insertion of proteins which disrupt the integrity of the mitochondrial membrane(10). Group III contains proteins that bind and regulate the anti-apoptotic Bcl-2 proteins. In healthy cells, they are phosphorylated and sequestered in the cytoplasm by an adapter protein.
The apoptotic pathway can be separated into two distinct pathways: the extrinsic pathway and the intrinsic pathway. The former activates cell death via a specific set of death signals while the later does so via a plethora of extracellular (eg. radiation, trophic factors, drugs and physical stresses) and intracellular stresses (eg. DNA damage, improper protein folding). The intrinsic pathway, which involves proteins from the Bcl-2 gene family, most notably Bax, leads to cell death by the disruption of mitochondrial function caused by the permeabilization of the outer membrane which in turn release and activates a variety of apoptotic proteins(10). Under normal circumstances, the pro-apoptotic protein Bax is confined in an inactive state to the cytosol, anchored via its
C-terminus. Through a mechanism that still remains unclear, apoptotic stimuli cause a conformational change in the Bax C-terminus, liberating it from its anchor and leading to its insertion into the outer mitochondrial membrane. This leads to its permeablization either by compromising the integrity of the lipid bilayer or alternatively through the formation of Bax containing homooligomeric pores(11). Indeed, it has been reported that isolated fibroblasts from transgenic mice lacking both Bax and Bak are highly resistant to apoptosis via the activation of the intrinsic pathway(12). Once the outer mitochondrial membrane has been compromised, many soluble pro-apoptotic proteins are released from the intermembrane space. The most significant of these proteins is cytochrome C, which upon release from the mitochondria, initiates the assembly of the apoptosome and the activation of the caspase cascades which will ultimately lead to the death of the cell in question(13).
Contrary to Bax, the anti-apoptotic protein Bcl-2 is localized at the outer mitochondrial membrane. Once again, the exact mechanism describing how the anti-apoptotic Bcl-2 proteins prevent cytochrome c release and cell death remains a matter of much debate. It has been previously hypothesized that the ratio between pro and anti-apoptotic proteins ultimately decides the fate of the cell(14). However, more recent observations suggest that these proteins may excerpt their effect independently of each other(15).
Certain genetic approaches using transgenic mice which restrict the induction of the caspase-8 allele(16), a protein heavily involved in the apoptotic and necrotic
pathways, have shown that inhibition of myocyte apoptosis significantly reduces infarct size by up 70%(17). By contrast, pharmacological approaches have yielded much less consistent results. However, certain approaches utilising caspace inhibitors have shown a 21-52% decrease in infarct size(8). These data indicate the possibility of substantial therapeutic benefits by modulating the apoptotic response following myocardial infarction.
3. Nestin and Nestin(+) Cells in the Heart
Nestin is a 240 kDa type IV intermediate filament protein implicated in the plasticity, differentiation and proliferation of CNS-derived neural stem/progenitor cells. Nestin expression in the neonatal rat heart is significantly more pronounced than that of the adult rat heart. It would seem that postnatal growth of the rat heart is associated with a downregulation of the intermediate filament protein. A similar observation was reported in skeletal muscle and aortic vascular smooth muscle where nestin was expressed during embryogenesis but disappeared in the adult rat ((18), (19)). These observations support the notion that nestin expression is implicated in the proliferation of progenitor cells. By isolating ventricular cells from neonatal rat pups, it was shown that ventricular fibroblasts exhibit overexpression of the intermediate filament whereas ventricular myocytes showed little to no nestin expression(20). Furthermore, it was reported that although nestin expression is low or absent from adult cardiac myocytes, following an ischemic event, nestin (+) myocyte-like cells are observed in proximity to the injured tissue and high
nestin expression is observed in the endothelial lining of small caliber blood vessels(21),(22).
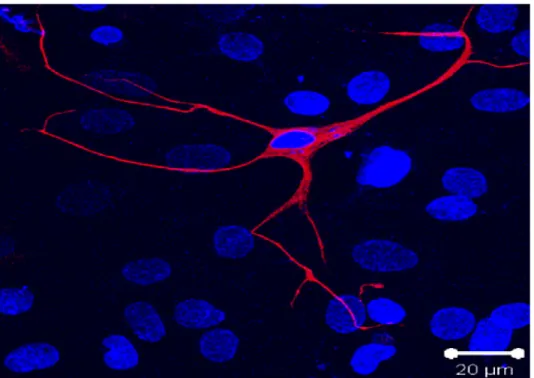
Recent work from Dr. Calderone and colleagues has unexpectedly identified a resident population of nestin (+) neural stem cells in the rodent and human heart(21) (figure 3).
Figure 3. Nestin Expressing Cell Nestin (red) expressing cell isolated from rat atria. The Nuclei were stained with the fluorescent marker to-pro3 (blue). El-Helou et al. 2008
These cells are intercaleted between cardiac myocytes in the normal rat heart. They are characterized by a small cell body and numerous processes making them morphologically different from nestin (+) scar myofibroblasts(22). They were found to express the RNA binding protein Musashi-1, which is implicated in maintaing the cell’s capacity for self renewal, form neurospheres in vitro in the presence of EGF and bFGF
and differentiate to a neural phenotype in vitro characterized by the de-novo synthesis of neurofilament M.
Further work by Dr. Calderone and colleagues(21),(23) showed that the viable myocardium of the infarcted human heart also contained a subpopulation of nestin (+) cells intercalated between cardiac myocytes. These cells were again detected in the peri-infarct/infarct region of the infarcted human heart. In addition, these cells displayed a small cell body with numerous processes bearing a strong morphological resemblence to the nestin (+) cells identified in the rodent heart. These observations were confirmed by the work of Mokry and colleagues (2008).
The gene expression of this novel cardiac neural stem cell population provides some indirect evidence for its neural crest origin. The expression of the neural crest stem cell-associated genes sox9, snail and slug were detected primary passage scar-derived cells isolated from infarcted rat heart and the left ventricle of the normal rat heart (24). To determine the neural crest origin of the cell population, a transgenic mouse was used with the neural crest specific promoter Wnt1 driving Cre recombinase expression to activate an EGFP reporter gene. In neonatal transgenic mice, an EGFP signal was observed in a plethora of nestin expressing cells in the heart giving strong support to the theory that the nestin (+) cell population identified in the rat and human hearts are of neural crest origin (21).
Work from our lab and others(25) has shown that following myocardial infarction, nestin (+) cardiac neural stem cells migrate to the infarct region and participate in wound healing. Indeed, nestin (+) cardiac neural stem cells were capable of differentiating to vascular cells leading to de novo blood vessel formation in the infarct region(26). The latter findings were obtained following the isolation and injection of scar-derived neurosphere forming nestin (+) neural stem cells into the peri-infarct/infarct region of the infarcted rat heart. These cells were individually labelled with the fluorescent cell tracker CM-DiI and injected into the heart of 3 day post MI rats. 7 days after injection, they were observed exclusively in the scar region. Interestingly, in addition to undifferentiated CM-DiI labelled nestin+ cells, a subpopulation of CM-CM-DiI labeled cells had differentiated to an endothelial and vascular smooth muscle phenotype, characterized by co-staining with eNOS and desmin respectively. This differentiation was followed by the de novo synthesis of CM-DiI blood vessels in the infarcted region. These observations would support the hypothesis that nestin(+) cardiac neural stem cells can participate in the angiogenic response following injury to the myocardium. Following an ischemic insult, the expression of the intermediate filament protein nestin is upregulated in both the non-infarcted left ventricle and the scar region. The former would suggest that the number of cardiac neural stem cells increases following damage to the myocardium.
Analogous results were reported by Tomita et. al (2005) showing a subpopulation of cardiac resident nestin(+) cells were capable of differentiating to neuronal, glial and vascular phenotypes. A subpopulation of these cardiac resident nestin(+) cells were plated in vitro and unexpectedly expressed markers associated with a cardiomyocyte-like phenotype. More specifically, after 7 days in culture, several cardiac specific genes were
detected, most notably ANP and Cav1.2. After 14 days, these cells began to beat spontaneously. Furthermore, using P0-Cre recombinase/Floxed-EGFP double transgenic mice, Tomita et al. (2005) were able to establish that neural crest-derived cells are able to migrate into the myocardium and remained there having the capacity to differentiate into various types of cells(27). It would seem that this subpopulation of cells remains dormant in the heart until a change is initiated by environmental stimuli. Consistent with the latter
findings, work from Dr. Calderone and colleagues identified nestin (+) myocyte-like cells
exclusively in the peri-infarct/infarct region of the ischemically damaged heart (figure 4). Nestin (+) myocyte-like cells were also detected in the infarcted human and mouse heart whereas these cells were absent in the normal myocardium(21).
=
Figure 4. Nestin staining in myocyte-like cell. In the peri-infarct region of a 1-week post-MI patient, nestin staining was observed in certain cells exhibiting a cardiac myocyte-like phenotype (highlighted in box) and not limited to cells with a small cell body and processes (indicated by arrow). Nuclei were labelled with the fluorescent marker to-pro3 (blue). El-Helou et al. 2008
Phenotypically, these immature cells were characterized by co-staining with the intermediate filament protein desmin, an association with an aberrant pattern of connexin-43 staining, as the gap junctional protein was absent and/or internalized. It
remains presently unknown if nestin (+) myocyte-like cells are derived from undifferentiated cardiac resident nestin(+) neural progenitor/stem cells
3.1 Myofibroblasts
Myofibroblasts are a entirely different class of nestin expressing cells. They differentiate from fibroblasts who have migrated to the infarct region following ischemic injury. These myofibroblasts, characterized by the expression of "-smooth muscle actin, play a crucial role in wound healing following myocardial injury(2). They primarily secrete the extracellular matrix proteins collagen I and III which form the basis of the structural support in the scar required to prevent cardiac myocyte slippage and left ventricular dilation. Consequently, one can determine the effect of a drug on scar formation by comparing the mRNA transcript levels of various collagen proteins. A decrease in collagen trancription in drug treated groups compared to control groups would be indicative of decreased collagen secretion by myofibroblasts and consequently impaired scar formation and wound healing. Interestingly, it has been observed that nestin is only transiently expressed in highly proliferating embryonic and neonatal fibroblast and is thereafter lost in adult fibroblasts(28). By contrast, following an ischemic insult, myofibroblasts re-express the intermediate filament protein nestin. This may prove to be an adaptive response to accelerate the healing process by augmenting cellular proliferation.
Understanding the mechanism implicated in the upregulation of nestin is crucial to unraveling the biological control of cardiac neural stem cells following myocardial
infarction and the first step to elucidating the environmental factors responsible for their differentiation to the described cellular phenotypes.
4. Immune Response to MI
4.1 Overview
Ischemia following myocardial infarction causes a decrease in the oxygen availability to cardiac myocytes. In the absence of oxygen, a decrease in oxidative phosphorylation is accompanied by a decrease in ATP, cell swelling, an accumulation of lactic acid and glycogen depletion(29). 20-40 minutes after coronary artery occlusion, irreversible damage occurs in the myocytes ultimately leading to cell death predominantly via coagulation necrosis and apoptosis(30). Factors released from necrotic tissue (ex: HMGB18, cardiac myosin 7), termed “danger signals” initiate an innate immune response which ultimately activates the NF-kB signalling pathway. NF-kB signalling then increases the expression of many key cytokines, chemokines and adhesion molecules responsible for the inflammatory response observed in the heart following myocardial infarction.
Our current understanding is that the primary receptor involved in the activation of the immune system is toll-like receptor 4 (TLR4). Indeed, TLR4 is expressed in the rodent heart and it was found to be significantly induced in myocardiopathy samples(31). Furthermore, TLR4-/- mice have decreased infarct size and inflammation and attenuated adverse remodelling following coronary artery ligation(32). This would seem to indicate that TLR4 is a key component of the innate immune response in the heart following myocardial infarction.
4.2 The Role of IL-1!
Following acute myocardial infarction, ischemic endothelial cells and cardiomyocytes release the pro-inflammatory cytokine IL-1!. Its release initiates the inflammatory cascade by stimulating and potentiating the release of other inflammatory cytokines such as IL-6, IL-8, MCP-1 and TNF-". In addition, IL-1! is subject to positive feedback as the initial release of IL-1! by the ischemic tissue promotes the recruitment of leukocytes into the damaged area, which in turn release IL-1! themselves(33). Though IL-1! is associated with the healing of the infarct area, it also contributes to cardiomyocyte apoptosis either directly or in conjunction with the action of TNF-" or INF-# via the activation of the Bak and Bcl-xL pathways(34).
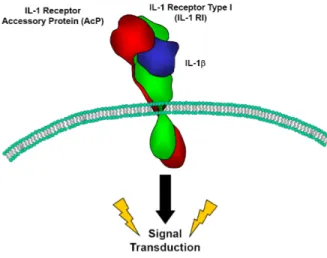
The IL-1! signalling mechanism is highly regulated and highly complex. The current understanding of the signalling mechanism suggests that in order to initiate a downstream signal, IL-1! must bind the type 1 cell surface IL-1 receptor which then forms a complex with its co-receptor: the IL-1 receptor associated protein. The IL-1 receptor associated protein must bind the signalling complex to couple ligand binding with downstream activation (figure 5).
.
Figure 5: Conceptual Diagram of
In addition, there exists several forms of negative regulation controlling IL-1! signalling. The binding of the IL-1R1 by an IL-1! homologue, the IL-1 receptor antagonist molecule inhibits IL-1! signalling. Secondly, there exists a decoy receptor which neutralizes circulating IL-1!, the type II IL-1 receptor(35). It has been shown that treatment with an anti-IL-1R2 antibody increases the response to IL-1!(36). And finally, contrary to the membrane bound form of the receptor, the soluble form of the IL-1R1 can serve as a trap to inhibit IL-1! signalling. Very little receptor occupancy is required in order to initiate a biological response to IL-1!. Studies have shown that as little as 4% receptor occupancy is required.
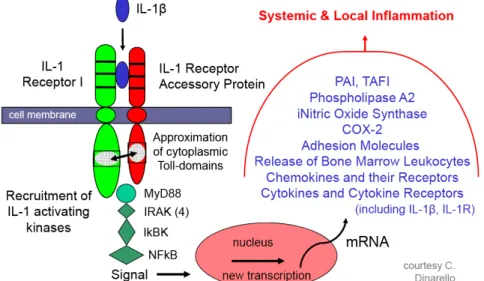
Figure 6: Intracellular signalling targets of IL-1R1 and downstream effects(37)
It has been suggested that the association of the two cytoplasmic domains for both the IL-1RacP and the IL-1R1 is a necessary event for the activation of IL-1 receptor associated kinases (IRAK), stress activated protein kinases (SAP kinases)(38) and a TNF receptor associated factor (TRAF6). IL-1R1 activates the adapter protein MyD88 via a homophilic protein-protein interaction between the cytoplasmic domain of the receptor and the TIR domain of MyD88(39). Using a negative construct, Medzhitov et al. showed
that MyD88 interacted with and activated the downstream targets IRAK and possibly TRAF6. Following the interaction between MyD88 and IRAK, the later becomes phosphorylated and interacts with TRAF6. Interacting with TRAF6, Interferon-gamma inducing factor (IGIF) would then induce the action of Nuclear factor kappa-beta, a transcription factor involved in the transcription of other pro-inflammatory genes.
5. Pharmacological Agents used in Study
5.1 Lipopolysaccharide (LPS)
LPS is a bacterial endotoxin found on the outer cell membrane of most gram negative bacterial pathogens such as Escherichia Coli (E. Coli). The binding of LPS to the toll like receptor 4 initiates an immune reaction and, with a large enough dose, initiates a massive inflammatory response.
Lipid A is a glycosamine-based phospholipid that makes up the hydrophobic anchor of the LPS molecule(36) (figure 7). The general structure for Lipid A synthesized by many different pathogens is generally conserved. This leads to their recognition by the ancient immune receptors Toll-like receptors (TLR). In 1998, Poltorak et al. identified the TLR4, a membrane spanning receptor, distantly related to the IL-1R, which recognizes the endotoxin. Being related to the IL-1R, it associates with many of the same signalling proteins including MyD88 and IRAK. This leads to the activation NF-kappa beta, p38 and AP-1 (adaptor protein 1) genes which will upregulate the transcription of
pro-inflammatory cytokines such as IL-1, IL-6 and TNF-". The pro-inflammatory response is extreme and can lead to septic shock and eventually death(40).
Figure 7: Structure of the LPS molecule (author: Mike Jones)
Lipid A in yellow at the bottom of the figure is sythesized by many different pathogens and is highly conserved.
5.2 Xoma 052 (Gevokizumab)
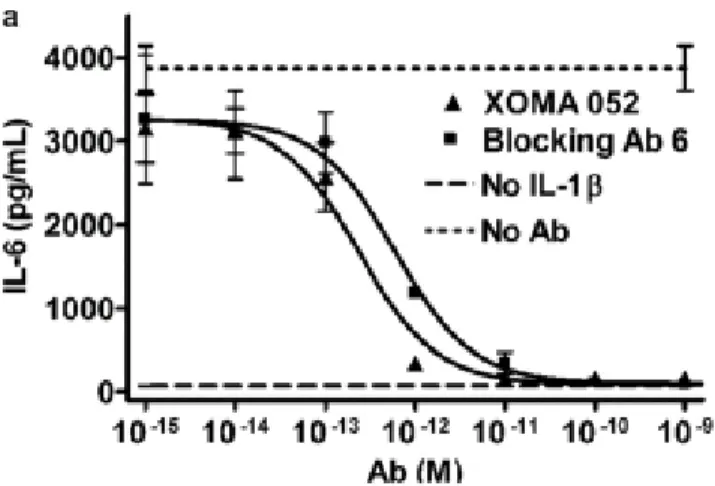
Xoma 052 is a novel regulator of IL-1! signalling. It is a IgG2-kappa humanized antibody with a strong affinity and specificity for IL-1 !. It blocks ligand binding with its receptor IL-1R1 thereby preventing IL-1 ! signalling(figure 8). The half maximal inhibitory concentration (IC50) of the antibody is under 10 picomolars indicating a high potency.
Fig 8 (24). Graph depicting variation in IL-1! signalling in the presence of the Xoma 052 antibody. The ability of Xoma 052 to inhibit IL-1! signalling was assessed by
measuring the levels of IL-6, an inflammatory cytokines that is released in response to IL-1!. In a study by Roell et al. (35), it was determined that treatment with the antibody completely blocked IL-6 release in a concentration dependant manner.
The drug offers many advantages compared to other IL-1! inhibitors. Firstly, it has a relatively long circulatory half life, around 23 days. This would translate to more convenient dosage administration for future patients. A monthly injection may be adequate. By comparison, Anakinra, a recombinant IL-1 Receptor antagonist currently used in the treatment of rheumatoid arthritis, has a half life of 4-6 hours. Rinolacept, an IL-1 trap used in the treatment of Cryopyrin-associated periodic syndromes (CAPS), has a circulatory half life of 8.6 days. Secondly, past studies have suggested that the mechanism of action of the antibody is more effective than other methods at inhibiting IL-1 signaling. Only 4% receptor occupancy is required for full signalling activity. Targeting the ligand is therefore a much more effective strategy than attempting to block the receptor.
In 2011, study by Bhaskar et al. (41) reported that Xoma 052 inhibited macrophage-induced secretion of several key atherogenic cytokines from endothelial
cells and smooth muscle cells. The cytokines which were reduced, IL-6, IL-8, MCP-1 and TNF-alpha, are all known to be regulated by IL-1! signalling. Furthermore, it was also shown that the expression of certain MMPs was reduced. This gives further evidence to the effectiveness of the drug because it has been shown that IL-1! increases the levels of MMP-9 and MMP-3. Xoma 052 is an exciting new molecule which fits the criteria required to test our objectives.
Past work from Dr. Calderone and colleagues has identified a resident population of nestin (+) neural stem cells in the heart. It has been shown that the expression of nestin is upregulated in the both the scar and non-infarcted left ventricle of the infarcted rodent heart. The primary objective of this study was to elucidate the stimuli (ex: signaling protein) implicated in the upregulation of nestin following MI.
Our data has shown that treatment with dexamethosone, a synthetic glucocorticoid with potent anti-inflammatory and immunosupressant properties, blocks the upregulation of nestin following MI. Though a direct effect of dexamethasone itself cannot be excluded, this data would suggest that the inflammatory response plays a role in the upregulation of nestin following myocardial infarction. Since IL-1! is a primary mediator of the inflammatory response, this provided an opportunity to examine the effect of the inflammatory response on the upregulation of nestin. To accomplish this goal, we administered the novel antibody Xoma 052 to block IL-1! signalling.
Furthermore, scar formation and healing is an essential process to repair the damaged tissue following myocardial infarction. It involves a highly coordinated physiological process intiated by inflammatory response, collagen deposition by myofibroblasts to replace necrotic tissue and ventricular remodelling to compensate for decreased cardiac function. Though necessary, these processes also have a negative impact on heart function which ultimately affects the survival and quality of life of infarct survivors. The secondary objective of this study was to assess the role of the inflammatory response, primarily the role of the pro-inflammatory cytokine IL-1! on cardiac function and scar formation following MI.
MI Rat Model and Hemodynamic Measurements
In this model, Male Sprague Dawley rats (Charles River) weighing about 300g were placed under anaesthesia using 2.5% isoflurane, 2L/min Oxygen followed by intubation to maintain respiration during surgery. An incision was made in the 4th intercostals space followed by the cutting of the pericardium. A myocardial infarction was created by ligating the left coronary artery. The ribs were brought together with sutures and the wound closed with clips. ECG measurements are taken to monitor the survival of the animal. To alleviate suffering in the animal, a dose of buprenorphine was administered following surgery.
At 1, 8 and 15 days post MI, a subcutaneous injection of the XOMA 052 drug at a dose of 0.1, 1 or 10mg/kg or an IgG vehicle was administered.
22 days after MI, the rats were anesthetised with a 1:1 mixture of ketamine (50mg/ml) and xylazine (10mg/ml). The intramuscular injection was administered at a dose of 0.01ml/kg. Lead electrodes were inserted into the upper right and both lower legs to measure and establish Einthoven`s triangle. This enabled the electrocardiogram to view the electrical activity of the heart. The EMKA 1.8.11..12 program also provided a measure of the heart rate by the addition of the QR or measure the systolic pressure curves.
Following an incision in the neck of the animal, the right carotid artery was located and and Millar catheter (2F) was inserted and threaded to the left ventricle to record carotid and ventricular pressures. The Millar catheter is removed and a fluid filled catheter was inserted into right juglar vein and threaded to the right ventricle to measure pressure. The method also calculated the rate of contraction (dp/dT), based on the steepest point of the descending pressure curve. The diastolic pressure is represented by the smallest pressure reading of the pressure curve. The end-diastolic pressure is the point when the slope begins to rise and the systolic pressure is the highest peak point of the curve.
Before sacrifice, approximately 6ml of blood was drawn from the inferior vena cava and stored on ice. This is followed by an incision in the lower abdomen, the cutting of the diaphragm and the excision of the animals heart. Following excision, the heart is weighed and stored in either 2-methylbutane for immunofluorescence or cut up and frozen in liquid nitrogen for use in molecular biology experiments. The use and care of laboratory
animals was according to the Canadian Council for Animal Care and all animal studies were approved by the Animal Care Ethics Committee of the Montreal Heart Institute.
LPS model
In this model, Male Sprague Dawley rats (Charles River) weighing about 300g were injected subcutaneously with the Xoma 052 antibody (1mg/kg, 10mg/kg). 8 hours following the administration of the drug, the animals were injected IP with 10mg/kg LPS from Escherichia Coli 055:B5 purified by phenol (Sigma L2880; dissolved in 0.8% Saline). Approximately 15 hours following LPS injection, the rats were anesthetised with a 1:1 mixture of ketamine (50mg/ml) and xylazine (10mg/ml). The intramuscular injection was administered at a dose of 0.01ml/kg. Hemodynamic measurements were taken as described above. The use and care of laboratory animals was according to the Canadian Council for Animal Care and all animal studies were approved by the Animal Care Ethics Committee of the Montreal Heart Institute.
Western Blot to measure protein expression
Protein Extraction
The cardiac tissue were lysed using a buffer containing 150mM NaCl, 10mM Tris (pH 7.5), 1mM EDTA (pH 7.0), 1mM EGTA (pH 9.0), 50mM NaF, 1% Triton-X, 0.5%
Igepal CA-360, 1mM ortho-vanadate, 1 µg/mL Leupetin (1mg/mL DMSO), 1 µg/mL Aprotinin (1mg/mL) and 500µM Phenyl methyl sulfonyl fluoride, with the final pH 7.4. The tissue sample was placed in a 50mL tube containing 3mL of the lysis buffer. The tissue was grinded using the Polytron at a speed of 20 500 rpm and the samples settled on ice for 1 hour. The samples were then centrifuged at 10 000 rpm for 10 minutes at 4˚C. The supernatant was transferred and stored at -80˚C. The protein concentration was assessed using the Bradford assay technique.
Mini-Western Blot
The results for the Bradford Protein Assay were used to calculate and load a 30 µg protein sample. The samples were directly mixed with SBJ 2X for a 15µL loading volume. The SBJ contained 1 M Tris (pH 6.8), 30% glycerol, 6% SDS, 15% !-mercaptoethanol and bromophenol blue. Prior to loading, the samples were heated at 70˚C for 5 minutes to denature the proteins. The denatured samples were loaded into the wells of a 8.75-12.5% SDS-polyacrylamide gel with a width of 1mM and subjected to electrophoresis at 200V for 45-60 minutes. The protein was subsequently transferred at 100V for 90-105 minutes to a PVDF membrane. Immunoblotting was performed using 5% skim milk dissolved in PBS-Tween followed by several washings with PBS-T. The primary antibody was added the 5% milk mixture and incubated overnight at 4˚C with the membrane in a bottle on a rotating rack. The antibodies used include mouse monoclonal anti-nestin (1:500; Millipore), rabbit monoclonal anti-iNOS (1:1000 Assay Design), rabbit anti-iNOS (1:1000; Enzo) mouse monoclonal anti-Bcl-2 (1:200; BD Transduction Laboratories), Mouse monoclonal anti-Bax (1:200; Santa Cruz Biotech), Rabbit
monoclonal anti-GAP43 (1:500; Millipore), rabbit monoclonal anti-eNOS ( 1:500; Assay Design). Following primary antibody incubation and washing with PBS-T, goat anti-mouse or goat anti-rabbit conjugated to horseradish peroxidase (1:20 000) was added and visualization of the bands were detected by autoradiography utilizing the ECL detection kit (0.125ml of substrate added/cm% of membrane area).
Molecular Biology Techniques
Real-Time Polymerase Chain Reaction (RT PCR)
Total RNA was isolated from the control and treated samples of Sham, LPS and/or Xoma 052 treated adult rat hearts by a modification of the guanidine isothiocyanate-phenol-chloroform method. A cDNA library was generated by incubating 10µl (0.2µg/µl) total RNA (each sample). M-MLV reverse transciptase (800 U, Applied BioSystems), RNaseOUT (40 U, Invitrogen), random-hexamer primers (0.04 U, Amersham Biosciences), dNTPs (0.5 mmol/L, MBI Fermentas), and supplied optimal buffers. The reaction protocol consisted of 3 successive incubation steps at (1) 25°C for 10 minutes, (2) 37°C for 120 minutes and (3) 85°C for 5 minutes.
Real-time polymerase chain reaction (PCR) was performed on 1 ng of cDNA template containing the appropriate primers (300 nmol/L) and SYBR Green PCR power master mix (Applied BioSystems). Primers for each gene were obtained from distinct exons that spanned an intron by using the Ensembl Genome Browser program
(http://www.ensembl.org) and the UCSC Genome Browser (http://genome.ucsc.edu). The sequence specificity of each primer was verified with the Blast program derived from the National Center for Biotechnology Information (http://www.ncbi.nlm.nih.gov). The
primers used were as follows: for rat Nestin, Sens 5’-TGCAGGCCACTGATAAGTTC- CA-3’ and anti-sense (AS) 5’-TTCTCCTGCTCCAGGGCTTCCA-3’; For rat Collagen "1-type III Sens 5’-GGACCTGGTTTCTTCTCACCC-3’ and AS 5’-AGGTAGTTGCA- TCCCAATTCA-3’; for rat GAPDH Sens 5’-GGGCTGGCATTGCTCTCA-3’ and AS 5’-GTCCACCACCCTGTTGCTGTA-3’; for rat TNF-" Sens 5’-GTGATCGGTCCCAA- CAAGGA-3’ and AS GATGAAGAGGGAGCCCATTTG-3’; for rat Il-1! Sens 5’-TTCAAGGATGAGGACCCAAG-3’ and AS 5’-CATCCCACGAGTCACAGAGGA-3’; for rat 18S Sens 5’-AACGGCTACCACATCCAAGG-3’ and AS 5’-GGGAGTGGGTA- ATTTGCGC-3’; for rat collagen "1-type I Sens- 5’CTGACGCATGGCCAAGAAGA- CA-3’ and AS 5’-CGTGCCATTGTGGCAGATACAGAT; for rat CTGF Sens 5’-AGG- CCCTGTGAAGCTGACCTAGA-3’ and AS 5’-TTTTAGGCGTCCGGATGCACT-3’; for rat TGF-!III Sens 5’-GCAAGAATCTGCCCCACGAGA-3’ and AS 5’-GACA- TGGACAGTGGATGCTGAT-3’; for rat ANF Sens 5’-AGAGCGGACTAGGCTGC- AACA-3’ and AS 5’-ATTTGGCTGTTATCTTCGGTA-3’; for rat Serca-2 Sens 5-AGT-CCCCGTATCCGATGACA-3’ and AS 5’-CATCCTCAGCAGGGACTGGT-3’; for rat MCP-1 Sens 5’-TCACCAGCAGCAGGTGTCC-3’ and AS 5’-CACAGATCTCTCTCT- TGAGCTTGG-3’. Appropriate negative controls were used for each experiment.
Statistics
Data were presented as means +/- S.E.M., where (n) represents the number of rats used in each experiment. Hemodynamic results, protein and mRNA expression were evaluated with a 1-way ANOVA and a significant difference was detected using the Tukey-Kramer post-hoc test. A value of P < 0.05 is considered statistically significant.
Nestin expression in infarcted rat hearts
treated with Dexamethasone
Work from our lab has reported that nestin expression in cardiac resident neural stem cells residing in the non-infarcted left ventricle was significantly increased during the acute phase of scar formation and healing following myocardial infarction in the rat(22). Despite these data, the biological stimuli implicated in the upregulation of nestin in cardiac resident neural stem cells in the infarcted heart remains undefined. Numerous studies have reported that inflammation plays an integral role in facilitating proper scar formation and healing following ischemic damage. Consistent with the latter statement, previous work from our lab reported that treatment of myocardial infarcted rats with the corticosteroid dexamethasone (0.1mg/kg) led to impaired scar healing and worsening of contractile function(42). Based on these data, we performed a preliminary study to assess whether dexamethasone treatment could likewise inhibit the upregulation of nestin in cardiac resident neural stem cells following myocardial infarction (MI). In 1-week myocardial infarcted (MI) rats, nestin protein expression (normalized to GAPDH) was increased in the non-infarcted left ventricle (sham=0.49±0.065 versus MI=1.1±0.065; n=4 for each group; p<0.01 versus sham) (Figure 1, Table 1). The administration of dexamethasone (DEX; 0.1mg/kg) 24 hrs after MI and continued for 6 days suppressed the increased nestin protein expression in the non-infarcted left ventricle (MI+DEX=0.46±0.057; n=4; p<0.01 versus MI) (Figure 1, Table 1). These findings suggest that globally attenuating the inflammatory response with dexamethasone during the acute phase of scar formation and healing suppressed the upregulation of nestin in
cardiac resident neural stem cells. However, because of the non-selective action of dexamethasone, the inflammatory cytokines implicated in the upregulation of nestin in cardiac resident neural stem cells following MI remains unknown. Therefore, we performed additional experiments and procured the drug XOMA52 that selectively targets the action of the inflammatory peptide IL-1! to assess the role of this specific cytokine on nestin expression in cardiac resident neural stem cells post-MI.
Figure 1:
Figure 1. Western Blot of Nestin Protein in the left ventricle of Sham rats and non-infarcted left ventricle of MI Rats treated with 0.1mg/kg of Dexamethasone. Selected
Sample of western blot (n = 4), 2 lanes are shown. Nestin protein levels were normalized to GAPDH protein content. In the MI rats, a significant increase in comparison to sham rats was observed. This increase was abolished by dexamethasone treatment (see table 1 below). Nestin protein levels were normalized to GAPDH protein content.
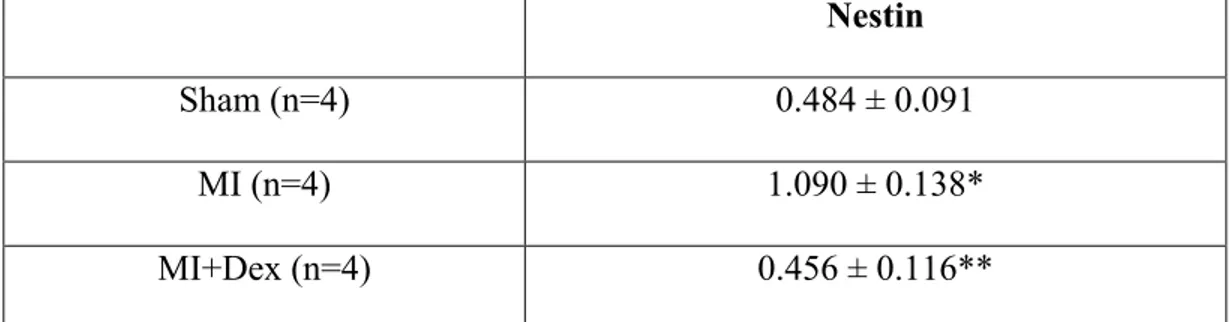
Table 1 . Non infarcted Left Ventricular Nestin Protein levels of
sham and MI rats treated with 0.1 mg/kg Dexamethasone
Nestin
Sham (n=4) 0.484 ± 0.091
MI (n=4) 1.090 ± 0.138*
MI+Dex (n=4) 0.456 ± 0.116**
MI indicates myocardial infarction. Data are presented as mean ± S.E.M normalized to GAPDH. Analyzed by an ANOVA followed by a Student-Newman-Keuls Multiple test, (*) represents p<0.01 vs Sham; (**) represents p<0.001 vs MI and (n) number of rats examined
Effect on Cardiovascular function of MI Rat
hearts treated with Xoma 052
Body and heart weights and ventricular function
of sham and MI rats treated with IgG or XOMA
052
To assess the effect of IL-1 on cardiovascular function, several key measurments were compared following Xoma 052 treatment. The body weights of IgG-treated sham and 3-week IgG-treated MI rats were not different and no significant difference was observed in ventricular weight (Tables 2 & 4). Complete coronary artery ligation of the heart of adult male Sprague-Dawley rats treated with 0.1 or 1 mg/kg of IgG led to scar formation and associated with a concomitant reduction of mean arterial pressure, left ventricular systolic pressure, left ventricular rate of contraction and relaxation and elevated left ventricular end-diastolic pressure, as compared to IgG-treated sham rats
(Tables 3 & 5). Echocardiographic measurements at 24 hrs post-MI and 2 weeks after coronary artery ligation likewise revealed left ventricular systolic (left ventricular systolic
dimension, LVDs; left ventricular fractional shortening, LVFS; fractional area
shortening, FAC; left ventricular posterior wall velocity, LVPWV) and diastolic
dysfunction (E Velocity, indirect measure of stiffness) of IgG-treated MI rats as compared to IgG-treated sham rats (Table 6).
The body and heart weights of sham rats treated with 0.1 or 1 mg/kg of Xoma 052 were similar to IgG-treated sham rats (Tables 2 & 4). Furthermore, left ventricular systolic and diastolic function measured by a Millar catheter or via echocardiography were similar in IgG- and XOMA52-treated sham rats, regardless of the dose injected (Table 6). The 0.1 and 1 mg/kg treated sham rats were associated with a modest decrease of mean arterial pressure and left ventricular systolic pressure compared to IgG-treated rats, but did not reach statistical significance inferior to p<0.05 (Table 3 & 5). Twenty-four hours after complete coronary artery ligation, 0.1 and 1mg/kg XOMA52 was administered to MI rats and 3 weeks later, infarct weight and surface area were similar to IgG-treated MI rats (Tables 2 & 4). These data were confirmed by echocardiography, as wall motion score index (WMSI), an indirect index of infarct size, was identical in IgG-treated and Xoma 052-IgG-treated MI rats (Table 6). Furthermore, left ventricular systolic and diastolic function measured by Millar were not different between Xoma 052- and IgG-treated MI rats, regardless of the dose (Tables 2 & 4). However, in the 1 mg/kg XOMA52 treated MI rats, a modest improvement of mean arterial pressure and left ventricular systolic pressure were observed as compared to IgG-treated MI rats, but did not reach statistical significance (Tables 2 & 4). Likewise, in the majority of
echocardiographic indices examined, left ventricular systolic and diastolic dysfunction reported in IgG-treated MI rats was not improved with XOMA 052 treatment, regardless of the dose (Table 6). However, a modest significant improvement of left ventricular posterior wall velocity, (LVPWV) was detected in 1mg/kg XOMA52-treated rats as compared to IgG-treated rats (Table 6).
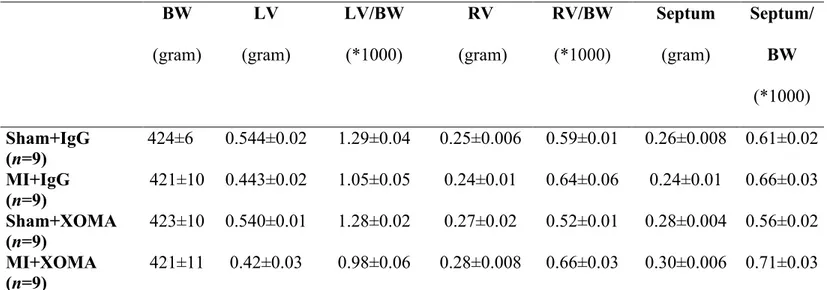
Table 2.
Body and heart weights of sham and MI rats treated with 0.1 mg/kg of IgG
or 0.1 mg/kg XOMA 052
MI indicates myocardial infarcted rats; BW, body weight; LV, left ventricle and RV, right ventricle. Data are presented as mean±S.E.M, analyzed by an ANOVA followed by a Student-Newman-Keuls Multiple test, and (n) number of rats examined. Note that both sham and MI control rats were treated with the IgG to account for any effect of the vector on experimental data.
BW (gram) LV (gram) LV/BW (*1000) RV (gram) RV/BW (*1000) Septum (gram) Septum/ BW (*1000) Sham+IgG (n=9) 424±6 0.544±0.02 1.29±0.04 0.25±0.006 0.59±0.01 0.26±0.008 0.61±0.02 MI+IgG (n=9) 421±10 0.443±0.02 1.05±0.05 0.24±0.01 0.64±0.06 0.24±0.01 0.66±0.03 Sham+XOMA (n=9) 423±10 0.540±0.01 1.28±0.02 0.27±0.02 0.52±0.01 0.28±0.004 0.56±0.02 MI+XOMA (n=9) 421±11 0.42±0.03 0.98±0.06 0.28±0.008 0.66±0.03 0.30±0.006 0.71±0.03
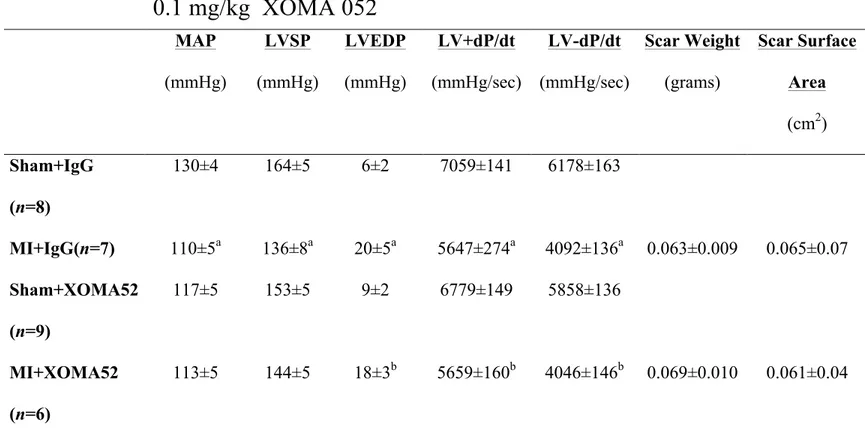
Table 3.
Hemodynamic Data of sham and MI rats treated with 0.1 mg/kg of IgG or
0.1 mg/kg XOMA 052
MAP (mmHg) LVSP (mmHg) LVEDP (mmHg) LV+dP/dt (mmHg/sec) LV-dP/dt (mmHg/sec) Scar Weight (grams) Scar Surface Area (cm2) Sham+IgG (n=8) 130±4 164±5 6±2 7059±141 6178±163 MI+IgG(n=7) 110±5a 136±8a 20±5a 5647±274a 4092±136a 0.063±0.009 0.065±0.07 Sham+XOMA52 (n=9) 117±5 153±5 9±2 6779±149 5858±136 MI+XOMA52 (n=6) 113±5 144±5 18±3b 5659±160b 4046±146b 0.069±0.010 0.061±0.04MI indicates myocardial infarcted rats; MAP, mean arterial pressure; LVSP, left ventricular systolic pressure; LVEDP, left ventricular end-diastolic pressure; +dP/dt, left ventricular rate of contraction; -dP/dt, left ventricular rate of
relaxation. Data are presented as mean±S.E.M, analyzed by an ANOVA followed by a Tukey-Kramer post-hoc test, (a) represents p<0.05 versus sham+IgG, (b) represents versus sham+IgG and sham+XOMA52, and (n) number of rats examined. Note that both sham and MI control rats were treated with the IgG to account for any effect of the vector on experimental data.
Table 4. Body and heart weights of sham and MI rats treated with 1mg/kg of control
IgG or 1 mg/kg Xoma 052
MI indicates myocardial infarcted rats; BW, body weight; LV, left ventricle and RV, right ventricle. Data are presented as mean ± S.E.M, analyzed by a ANOVA followed by a Student-Newman-Keuls Multiple test and (n) number of rats examined. Note that both sham and MI control rats were treated with the IgG to account for any effect of the vector on experimental data.
BW (gram) LV (gram) LV/BW (*1000) RV (gram) RV/BW (*1000) Septum (gram) Septum/BW (*1000) Sham+IgG (n=9) 447±8 0.592±0.06 1.32±0.04 0.24±0.03 0.53±0.02 0.24±0.007 0.53±0.02 MI+IgG (n=8) 444±14 0.539±0.04 1.21±0.07 0.24±0.01 0.60±0.02 0.24±0.01 0.60±0.02 Sham+XOMA (n=8) 438±14 0.596±0.05 1.36±0.05 0.27±0.02 0.60±0.05 0.27±0.01 0.61±0.02 MI+XOMA52 (n=11) 427±8 0.514±0.03 1.20±0.07 0.26±0.01 0.60±0.04 0.28±0.01 0.65±0.02
Table 5. Hemodynamic Data of sham and MI rats treated with 1 mg/kg of IgG or 1 mg/kg Xoma
052
MAP (mmHg) LVSP (mmHg) LVEDP (mmHg) LV+dP/dt (mmHg/sec) LV-dP/dt (mmHg/sec) Scar Weight (grams)Scar Surface Area
(cm2)
Sham+IgG (n=9) 122±4 159±6 9±1 7104±142 5959±146
MI+IgG(n=8) 100±5a 126±8a 13±4 5473±245a 3992±214a 0.066±0.008 0.62±0.09
Sham+XOMA52 (n=8) 110±5 136±6a 11±2 6379±146 5255±151
MI+XOMA52 (n=11) 109±4 137±5 15±3 5712±223b 4148±209b 0.063±0.009 0.57±0.07 MI indicates myocardial infarcted rats; MAP, mean arterial pressure; LVSP, left ventricular systolic pressure; LVEDP, left ventricular end-diastolic pressure; +dP/dt, left ventricular rate of contraction; -dP/dt, left ventricular rate of relaxation. Data are presented as mean±S.E.M, analyzed by a ANOVA followed by a Student-Newman-Keuls Multiple test, (a) represents p<0.05 versus sham+IgG, (b) represents versus sham+IgG and sham+XOMA52, and (n) number of rats examined. Note that both sham and MI control rats were treated with the IgG to account for any effect of the vector on experimental data
Table 6. Echocardiographic Measurements of sham and MI rats treated
with 1 mg/kg of IgG or 1 mg/kg Xoma 052
MI indicates myocardial infarction. , analyzed by a ANOVA followed by a Student-Newman Keuls Multiple test, represents p<0.05 vs Sham rats; †: vs 24H MI rats and ! MI+1 mg XOMA52 versus MI+IgG. Note that both sham and MI control rats were treated with the IgG to account for any effect of the vector on experimental data.
Sham
MI
1 mg
0.1 mg
1 mg
0.1 mg
IgG
(n=9) Xoma (n=8) (n=8) IgG Xoma (n=8) (n=8) IgG (n=11) Xoma (n=9) IgG Xoma (n=9)
LVDd (mm)
24 H 7.8±0.5 7.5±0.7 7.0±0.4 7.3±0.7 7.6±0.8 7.8±0.7 7.6±0.6 7.9±0.6 2-weeks 8.2±0.5 8.1±0.4 8.0±0.4 7.9±0.4 9.9±1.1* 9.8±0.8* 10.0±0.6* 9.8±0.5*LVDs (mm)
24 H 4.0±0.5 3.8±0.8 3.9±0.5 3.8±0.6 5.8±1.2* 6.0±1.0* 5.6±0.8* 5.8±1.1* 2-weeks 4.0±0.6 3.9±0.5 4.1±0.5 4.0±0.5 7.6±1.8*† 7.1±1.2*† 7.9±0.8*† 7.7±0.8*†LVFS (%)
24 H 49±7 49±11 44±7* 48±5* 24±7* 24±9* 27±8* 26±10* 2-weeks 51±5 52±5 49±6 49±6 24±11* 27±8* 21±5* 22±6*FAC (%)
24 H 63±9 66±6 57±5 57±5 37±13* 35±11* 34±8* 35±8* 2-weeks 64±5 65±8 63±5 60±4 36±12* 40±9* 33±4* 34±9*WMSI
24 H 1.0±0.1 1.0±0.1 1.0±0.0 1.0±0.0 1.9±0.4* 1.8±0.4* 1.9±0.3* 1.9±0.3* 2-weeks 1.0±0.0 1.0±0.0 1.0±0.0 1.0±0.0 1.8±0.3* 1.6±0.2* 1.9±0.2* 1.9±0.3*LVPWV
(cm/s)
24 H 3.8±1.0 3.9±0.9 3.8±0.6 3.9±0.4 2.0±0.6* 2.4±0.7* 2.7±0.6* 2.8±1.0* 2-weeks 4.5±1.0 4.3±0.6 4.5±0.8 4.2±0.9 2.1±0.9* 2.9±0.7*†! 3.1±0.5* 3.6±0.44* E Velocity (cm/s) 24 H 111±20 105±14 111±17 103±11 112±11 115±15 114±13 101±16 2-weeks 111±9 113±13 110±7 105±14 132±19*+ 124±19 134±24*+ 131±21*+Protein Expression and mRNA expression in MI
rat hearts treated with Xoma 052
In the non-infarcted left ventricle of IgG-treated MI rats, nestin protein expression was increased whereas SERCA2 mRNA levels were significantly reduced (Figure 3;
Table 7). ANP mRNA levels were also markedly elevated in the non-infarcted left
ventricle of IgG-treated MI rats, but was not statistically significant (Table 7). SERCA2 and ANP mRNA levels were measured to assess the effect of Xoma 052 on the
hypertrophic response. In 1mg/kg XOMA 052-treated MI rats, nestin protein expression, ANP and SERCA2 mRNA levels were similar to IgG-treated MI rats (Figure 3 & Table
7, 8). In the non-infarcted left ventricle of IgG-treated MI rats, Bax and Bcl-2 protein
levels were increased, MnSOD protein expression was reduced and eNOS protein content unchanged as compared to IgG-treated sham rats (Figure 2 & Table 8). In 1mg/kg XOMA 052-treated MI rats, elevated Bcl-2 protein expression persisted and MnSOD protein expression remained significantly reduced, as compared to IgG-treated MI rats (Figure 2 & Table 8). By contrast, a modest non-significant decrease of Bax protein levels was observed in XOMA 052-treated MI rats (Figure 2 & Table 8). Further
analysis of the latter data revealed that Bax protein expression was markedly reduced in 3 of 4 MI rats treated with XOMA 052 (Figure 2).
Bax
GAPDH
Sham+
IgG
Sham+
XOMA
MI+
IgG
MI+
XOMA
Sham+
IgG
MI+
IgG
MI+
XOMA
Sham+
XOMA
Bcl-2
MnSOD
eNOS
GAPDH
Figure 2. Remodelling of the non-infarcted left ventricle of
MI rats treated with 1 mg/kg of IgG or XOMA52
Figure 2. Sample of Western Blot Protein expression of Bax, Bcl-2, MnSOD, eNOS in
the non-infarcted left ventricle of MI rats treated with 1mg/kg of IgG or Xoma 052 (n=4-6). No changes were observed in the protein expression of the Bax, Bcl-2, MnSOD, eNOS proteins in Xoma-treated samples vs IgG-treated Samples. Overall a
non-signficiant decrease in Bax expression was observed in Xoma-treated MI vs IgG-treated MI though there was a strong variability in expression with different animals (see discussion below). Protein levels were normalized to GAPDH protein content.
Figure 3 : Nestin protein expression in NILV of 1 mg/kg
Xoma 052 treatedSham and MI rats
Figure 3. Sample of Western Blot Protein expression of Nestin Expression in the
non-infarcted left ventricle of MI rats treated with 1mg/kg of IgG or Xoma 052 (n=4-6). A significant increase in nestin expression was observed in the IgG-MI vs IgG-Sham animals. Xoma treatment failed to abolish this increase at a dose of 1mg/kg. Protein levels were normalized to GAPDH protein content.
Table 7. Left ventricular ANP and SERCA2 mRNA levels of sham
and MI rats treated with 1 mg/kg of IgG or XOMA 052
ANP SERCA2 Sham +IgG (n=4) 0.83±0.10 0.84±0.08
MI+ IgG (n=5) 10±6 0.49±0.04a
XOMA52+Sham (n=4-6) 0.72±0.30 0.77±0.09
XOMA52+MI (n=4-6) 9±4 0.54±0.06a
MI indicates myocardial infarcted rats; ANP, atrial natriuretic peptide and SERCA2, sarcoplasmic reticulum Ca2+-ATPase. Note that a strong variability in both IgG and Xoma052-treated samples prevents any changes to be statistically significant for ANP mRNA expression. Data are presented as mean±S.E.M, normalized to !-actin mRNA, analyzed by a ANOVA followed by a Student-Newman-Keuls Multiple test, (a) represents p<0.05 versus sham+IgG, and (n) number of rats examined. Nestin mRNA levels are not displayed because
changes in protein expression following infarct are regulated primarly through post-translational mechanisms.
Table 8. Western blot data of sham and MI rats treated with 1
mg/kg of IgG or XOMA 052
Bcl-2 Bax Mn-SOD eNOS Nestin Sham +IgG (n=4-6) 0.24±0.07 0.28±0.07 0.89±0.05 0.74±0.05 0.23±0.03 MI+ IgG (n=4-6) 0.51±0.06 b 0.75±0.09b 0.57±0.07a 0.81±0.04 0.56±0.05a XOMA52+Sham (n=4-6) 0.28±0.05 0.28±0.07 0.66±0.03a 0.75±0.05 0.37±0.04 XOMA52+MI (n=4-6) 0.58±0.11 b 0.59±0.17 0.60±0.05a 0.84±0.19 0.78±0.12b
MI indicates myocardial infarcted rats; Mn-SOD, Mn-superoxide dismutase and eNOS, endothelial nitric oxide synthase. Data are presented as mean±S.E.M, normalized to GAPDH protein expression, analyzed by a ANOVA followed by a Student-Newman-Keuls Multiple test, (a) represents p<0.05 versus sham+IgG, (b) represents versus sham+IgG and sham+XOMA52, (*) represents p<0.01 vs MI+IgG and (n) number of rats examined.
Infarct remodeling of MI rats treated with 1
mg/kg of XOMA 052
In order to investigate the effect of Il-1! inhibition on infarct remodelling, a variety of factors were investigated. As previously reported, infarct weight, infarct surface area and wall motion score index were similar between IgG-treated MI rats and XOMA 052-treated MI rats, regardless of the dose (Tables 2, 4, & 6). Consistent with these data, mRNA expression of collagen "1, collagen "3, CTGF, TGF-!1 and TGF-!3 in
the infarct region of XOMA 052-treated MI rats were identical to that observed in the infarct region of IgG-treated MI rats (Table 9).