www.the-cryosphere.net/8/2395/2014/ doi:10.5194/tc-8-2395-2014
© Author(s) 2014. CC Attribution 3.0 License.
Sea ice pCO
2
dynamics and air–ice CO
2
fluxes during the Sea Ice
Mass Balance in the Antarctic (SIMBA) experiment –
Bellingshausen Sea, Antarctica
N.-X. Geilfus1,2,3, J.-L. Tison2, S. F. Ackley4, R. J. Galley5, S. Rysgaard1,5,6, L. A. Miller7, and B. Delille3
1Arctic Research Centre, Aarhus University, Aarhus, Denmark
2Laboratoire de Glaciologie, Université Libre de Bruxelles, Brusells, Belgium 3Unité d’Océanographie Chimique, Université de Liège, Liège, Belgium
4Department of Geological Sciences, University of Texas at San Antonio, San Antonio, TX, USA 5Centre for Earth Observation Science, University of Manitoba, Winnipeg, Canada
6Greenland Climate Research Centre, Greenland Institute of Natural Resources, Nuuk, Greenland
7Centre for Ocean Climate Chemistry, Institute of Ocean Sciences, Fisheries and Oceans, Canada, Sidney, BC, Canada Correspondence to: N.-X. Geilfus (geilfus@bios.au.dk)
Received: 22 May 2014 – Published in The Cryosphere Discuss.: 23 June 2014
Revised: 5 November 2014 – Accepted: 24 November 2014 – Published: 20 December 2014
Abstract. Temporal evolution of pCO2profiles in sea ice in the Bellingshausen Sea, Antarctica, in October 2007 shows physical and thermodynamic processes controls the CO2 sys-tem in the ice. During the survey, cyclical warming and cool-ing strongly influenced the physical, chemical, and thermo-dynamic properties of the ice cover. Two sampling sites with contrasting characteristics of ice and snow thickness were sampled: one had little snow accumulation (from 8 to 25 cm) and larger temperature and salinity variations than the sec-ond site, where the snow cover was up to 38 cm thick and therefore better insulated the underlying sea ice. We show that each cooling/warming event was associated with an in-crease/decrease in the brine salinity, total alkalinity (TA), to-tal dissolved inorganic carbon (T CO2), and in situ brine and bulk ice CO2partial pressures (pCO2). Thicker snow covers reduced the amplitude of these changes: snow cover influ-ences the sea ice carbonate system by modulating the temper-ature and therefore the salinity of the sea ice cover. Results indicate that pCO2was undersaturated with respect to the at-mosphere both in the in situ bulk ice (from 10 to 193 µatm) and brine (from 65 to 293 µatm), causing the sea ice to act as a sink for atmospheric CO2 (up to 2.9 mmol m−2d−1), despite supersaturation of the underlying seawater (up to 462 µatm).
1 Introduction
Sea ice formation and melting may have a strong impact on the carbon cycle of polar oceans (e.g., Rysgaard et al., 2011; Delille et al., 2014). However, processes related to freez-ing and meltfreez-ing of sea ice, as well as their impact on CO2 exchanges with the atmosphere, are still poorly understood (Parmentier et al., 2013). Detailed studies have been con-ducted on sea ice inorganic carbon chemistry and the impact of sea ice on the carbon cycle and the CO2 exchanges be-tween atmosphere, sea ice, and the ocean over the last decade (Semiletov et al., 2004; Zemmelink et al., 2006; Rysgaard et al., 2007, 2011, 2012; Delille et al., 2007, 2014; Miller et al., 2011; Papakyriakou and Miller, 2011; Geilfus et al., 2012a, 2013; Nomura et al., 2010a, 2013). These studies have shown that, in both hemispheres, CO2–carbonate chemistry in sea ice and brine is heterogeneous and variable, resulting in com-plex CO2dynamics.
The CO2chemistry of sea ice seems to be highly depen-dent on brine salinity, which is controlled by ice temperature (Weeks, 2010). Both brine concentration during ice growth and brine dilution during ice melt play major roles in the car-bonate system dynamics within sea ice (Papadimitriou et al., 2004; Nomura et al., 2010a; Geilfus et al., 2012a). In parallel, temperature dependence of both the dissociation constants of the carbonate system and the Henry’s law constant for CO2
affect pCO2 in sea ice. Brine concentration/dilution can be associated with precipitation/dissolution of calcium carbon-ate within the sea ice, also promoting an increase/decrease in the in situ brine pCO2(Papadimitriou et al., 2004, 2007; Rysgaard et al., 2007, 2012, 2014; Geilfus et al., 2012a, 2013). Primary production and respiration can also affect the CO2–carbonate system within sea ice (Thomas and Dieck-mann, 2010; Dieckmann and Hellmer, 2010; Delille et al., 2007). Finally, brine and gas transport within sea ice and across the air–ice and ice–water interfaces affect TA, T CO2, and CO2distributions within the ice, together with the over-all amount of CO2 in the sea ice. The role of ice-covered oceans in the CO2balance has been largely ignored because continuous sea ice cover is assumed to impede gaseous ex-change with the atmosphere. However, recent studies show that sea ice may mediate the air-to-sea CO2transfer. Under-standing of the seasonal and geographical conditions of the inorganic carbon dynamics related to sea ice is limited. The main goal of this study is to add to the still limited database on inorganic carbon dynamic in ice-covered seas.
Although snow thickness and distribution are variable and primarily result from wind-induced redistribution dur-ing storms (Weeks, 2010), the impact of snow cover on the thermal evolution of sea ice can be significant (Massom et al., 2001). Snow, which has a low thermal conductivity com-pared to sea ice (Massom et al., 2001), provides thermal in-sulation between the cold air and the ice. The presence of a thick snow cover also affects the isostatic balance, poten-tially resulting in negative freeboard (i.e., the snow–ice in-terface is submerged below the seawater level). If the sea ice is permeable throughout the entire ice column, negative free-board causes vertical flooding to at least the snow–ice in-terface through open brine channels. The percolation thresh-old above which columnar sea ice is considered permeable to fluid transport corresponds to a brine volume (which is controlled by temperature and salinity) of 5 % (Golden et al., 1998, 2007).
Therefore, snow accumulation could impact the CO2– carbonate system within sea ice by regulating the ice tem-perature and the extent of flooding. The impact of snow on the CO2exchanges between sea ice and the atmosphere has previously been discussed by Nomura et al. (2010b); these authors suggested that a snow cover thicker than 9 cm could prevent any sea-ice–atmosphere exchanges of CO2and that melting snow can act as a physical barrier to CO2fluxes.
In this study, we examine the temporal evolution of in situ brine and bulk ice pCO2 profiles associated with physical and biogeochemical variables in the sea ice cover of two con-trasting study sites, named “Brussels” and “Liège” between 1 and 23 October 2007, during the Sea Ice Mass Balance in the Antarctic (SIMBA) cruise (Bellingshausen Sea, Antarc-tica) (Fig. 1) (Lewis et al., 2011). Further, we differentiate the dynamics of in situ brine and bulk ice pCO2. Sea ice temper-ature and bulk salinity differences at these two stations, in part due to substantial difference in snow cover, impact the
180° 150°W 120°W 90°W 60°W 30°W 0° 30°E 60°E 90°E 120°E 150°E 80°S 70°S 0 500 1000 km Bellingshausen Sea Weddell Sea Ross Sea Amundsen Sea
Figure 1. Location of the sampling area for the SIMBA cruise 2007 (blue patch), in the Bellingshausen Sea, Antarctica.
inorganic carbon dynamics within sea ice and its brine and the related air–ice CO2fluxes.
2 Study site, materials, and methods
2.1 Selection of study site
The SIMBA cruise investigated the physical and biolog-ical interactions between the ocean, sea ice, snow cover, and atmosphere in the Bellingshausen Sea, onboard the R/V Nathaniel B. Palmer (NBP) in October 2007. During this
∼1-month experiment, the vessel was moored to a first-year sea-ice floe, the Ice Station Belgica (ISB), south of Peter I Island, at approximately 69–71◦S and 90–95◦W (Fig. 1). The station was chosen for its wide variety of ice types and snow cover (Lewis et al., 2011), characteristic of the greater region, and the size of the ice floe (∼ 5 km2) was deemed large enough to survive the duration of the field experiment. Sampling was conducted at two distinct sites based on (i) ho-mogeneity of the surface properties within each site, to re-duce within-site spatial variability; (ii) the contrast in ice and snow properties between the two chosen sites; and (iii) max-imum distance from the ship (0.8 and 1.1 km), to prevent sample contamination. Each site was 100 m × 60 m and sub-divided into small work sub-areas approximately 5 m × 5 m. The 25 m2sub-areas were located adjacent to each other to minimize spatial variability (Lewis et al., 2011). Each station was sampled at 5-day intervals: the Brussels site (low snow cover, at 0.8 km) was sampled on 1, 6, 11, 16, and 21
Octo-1 6 11 16 21 -120 -100 -80 -60 -40 -20 0 20 40 October Th ic k n es s (c m ) a. Brussels 3 1 0.7 1.5 1.5 3 8 13 18 23 -120 -100 -80 -60 -40 -20 0 20 40 October Th ic k n es s (c m ) b. Liège Ice Snow Freeboard 2.5 1 0 -1 -0.5
Figure 2. Ice (including range of observed values), snow thickness, and freeboard at the Brussels and Liège sites.
ber; the Liège site (high snow cover, at 1.1 km) was sampled on 3, 8, 13, 18, and 23 October (Fig. 2).
2.2 Sampling procedures
Ice cores were collected using an electro-polished stainless-steel corer (14 cm diameter) using an electric drill head, con-nected by a long cord to a power supply generator located downwind. Cores were immediately wrapped in polyethy-lene bags and placed in an insulated box filled with gel packs pre-cooled to −30◦C in order to limit brine drainage from samples (Tison et al., 2008) and brought back to the ship lab-oratory. Sackholes (Gleitz et al., 1995) for collecting brine were drilled to four depths: 15, 30, 40, and 50 cm at the Brus-sels site; and 15, 30, 60 and 90 cm at the Liège site. Each sackhole was covered with a plastic lid to prevent contami-nation by falling snow. Brine seeped into the sackholes for 10 to 60 min before collection using a peristaltic pump (Cole Palmer, Masterflex-Environmental Sampler). Under-ice sea-water was collected using the same peristaltic pump, with the inlet positioned at the ice–water interface, and at 1 and 30 m depths. On each sampling date, ice cores, brine, and seawa-ter were collected and analyzed for a full range of physical and biogeochemical variables: temperature (T ), salinity (S), water stable isotopes of δ18O, chlorophyll a (Chl a), total al-kalinity (TA), pHT, and in situ CO2partial pressure (pCO2). Brine samples for pHTand TA analyses were only collected from the shallowest sackhole depth (at 0 to 15 cm) and at 0 to 40 cm depth at the Brussels site and 0 to 60 cm depth at the Liège site sackholes.
2.3 Materials and methods
The ice temperature was measured immediately after extrac-tion of the ice core using a calibrated temperature probe (TESTO 720, ±0.1◦C precision) inserted into pre-drilled holes (∼ 5 cm intervals) perpendicular to the core sides. In the field, the ice core dedicated to bulk ice salinity measure-ments was cut into 5 cm thick slices which were stored in
separate, closed containers. These ice samples were melted at room temperature onboard, and bulk ice salinity on the practical salinity scale was determined from conductivity and temperature using a portable calibrated Orion 3-Star conduc-tivity meter (precision of ±0.1). Samples with salinity higher than 42 were diluted with ultrapure water using an analytical balance. Brine volumes profiles were calculated for each core using these bulk ice salinities and ice temperatures according to Cox and Weeks (1983) for ice temperatures below −2◦C and according to Leppäranta and Manninen (1988) for ice temperatures within the range −2 to 0◦C. Calculated brine salinity profiles were determined from the in situ ice temper-atures (after Cox and Weeks, 1983).
Aliquots (10 mL) of the bulk melted sea ice samples were transferred to gastight vials for δ18O measurements at the Australian Antarctic Cooperative Research Centre (CRC). Isotope ratios were measured with a dual-inlet VG SIRA mass spectrometer using the conventional water– CO2 equilibration method (accuracy with respect to VS-MOW = ±0.12 ‰).
The pH of the sea-ice brine and seawater was mea-sured using a Metrohm combined electrode calibrated on the total hydrogen ion scale (pHT) using TRIS amino-2-hydroxymethyl-1.3-propanediol) and AMP (2-aminopyridine) buffers prepared at salinities of 35 and 75 ac-cording to the formulations proposed by DOE (1994). Sam-ples were maintained as close as possible to their in situ tem-perature (typically below 3◦C), and measurements of pHT were carried out as soon as possible upon return to the ship laboratory (typically less than 2 h after sampling). The pH electrode was calibrated at temperatures ranging from 0 to 4◦C and at salinities ranging from 35 to 75. The accuracy of the pHTmeasurements was ±0.01 pH unit (Frankignoulle and Borges, 2001).
Total alkalinity in the brine and underlying seawater was measured by open-cell titration with HCl 0.1M, and the endpoints were determined according to Gran (1952). Rou-tine analyses of Certified Reference Materials provided by
A. G. Dickson, Scripps Institution of Oceanography, veri-fied that the error in these TA data was smaller than ±4 µmol kg−1. Total inorganic carbon (T CO
2) and pCO2 (de-noted as pCO2calc) were calculated from TA and pHTusing the CO2acidity constants of Mehrbach et al. (1973) refit by Dickson and Millero (1987) and other constants advocated by DOE (1994). We assumed that the CO2dissociation con-stants were applicable at subzero temperatures as suggested by Marion (2001) and Delille et al. (2007).
Brine and underlying seawater pCO2 were measured in situ using a custom-made equilibration system (Geilfus et al., 2012a). The system consisted of a membrane contac-tor equilibracontac-tor (Membrana, Liqui-cell) connected to a non-dispersive infrared gas analyzer (IRGA, Li-Cor 6262) via a closed air loop. Brine and airflow rates from the equili-brator and IRGA were approximately 2 and 3 L min−1, re-spectively. Temperature was measured within the sackholes or under-ice water and at the equilibrator outlet simultane-ously using Li-Cor temperature sensors. The pCO2 values were temperature-corrected assuming that the Copin Mon-tégut (1988) relation is valid at low temperatures and high salinities. The IRGA was calibrated immediately upon re-turning to the ship while the analyzer was still cold. All de-vices, except the peristaltic pump, were enclosed in an in-sulated box that contained a 12 V power source providing enough heat to keep the inside temperature just above 0◦C.
Ice cores were kept frozen during storage and shipping for subsequent analysis of bulk ice pCO2at the Laboratoire de Glaciologie, Université Libre de Bruxelles, Belgium. The general principle of the method was to equilibrate the sea ice samples at the in situ temperature with a mixture of N2 and CO2 at known concentrations (so-called standard gas, 396 µatm) and rapidly extract the gas into a Varian 3300 gas chromatograph under vacuum (Geilfus et al., 2012b). Each ice sample was cut into a 4 cm × 4 cm × 4.5 cm cube to tightly fit the equilibration container, thereby both minimiz-ing the headspace and keepminimiz-ing it consistent. The standard gas was injected at 1013 mbar into the equilibration container containing the ice sample. Then the container with the ice sample was placed in a thermostatic bath setup at the field in situ temperature for 24 h. This timing was chosen to en-sure that the sample is re-equilibrated to the brine volume and chemical conditions at the in situ temperature. A quick injection into the gas chromatograph then allowed the recon-struction of the equilibrium brine pCO2at the in situ temper-ature. This method is only valid if the ice is permeable at the in situ conditions (Geilfus et al., 2012b) and microstructure changes resulting from cooling during storage and warming prior to analysis are assumed to have a minor impact on the bulk ice pCO2.
Air–ice CO2fluxes were measured using an accumulation chamber (West System) placed on top of the ice. The cham-ber was a metal cylinder closed at the top, with an internal diameter of 20 cm and an internal height of 9.7 cm. A rubber seal surrounded by a serrated steel edge ensured an airtight
1 5 10 15 20 25 30 -25 -20 -15 -10 -5 0 5 October Te m per at ure (° C)
Ice surface - Liège Ice surface - Brussels Atmosphere
Figure 3. Daily time series of air temperature (◦C) recorded on the ship and the surface ice temperature of the different sampling sta-tions at the Brussels (red dots) and Liège (blue dots) sites.
connection between the ice and the chamber. Over snow, a steel tube was mounted at the base of the chamber to enclose the snowpack to the ice surface and prevent lateral infiltration of air into the chambered volume of snow. The chamber was connected in a closed loop to the IRGA with an air pump rate of 3 L min−1. The pCO2 in the chamber was recorded every 30 s for a minimum of 5 min. The flux was computed from the slope of the linear regression of pCO2versus time (r2>0.99) according to Frankignoulle (1988), taking into account the volume of ice or snow enclosed within the cham-ber. The average uncertainty of the flux computation due to the standard error of the regression slope was ±3 %.
3 Results
3.1 Atmospheric conditions
During the 2007 winter–spring transition in the Belling-shausen Sea, several low-pressure systems of varying in-tensity and length occurred at the sampling location. Fluc-tuations in the air temperature are shown in Fig. 3, along with the surface ice temperature measured at each station. At least three successive cycles of warming and cooling were recorded with air temperatures ranging from 0.5 to −20◦C. These cycles consisted of warm atmospheric fronts from the north, generally accompanied by high-velocity winds and precipitation, followed by cold air temperatures and little pre-cipitation (Lewis et al., 2011; Vancoppenolle et al., 2011).
3.2 Sea ice and snow conditions
The Brussels and Liège sites had contrasting conditions in snow, ice thickness (Fig. 2), and ice texture, which are pre-sented in detail by Lewis et al. (2011).
-7 -6 -5 -4 -3 -2 -1 0 0.0 0.2 0.4 0.6 0.8 Temperature (°C) Se a ic e thi ckne ss ( m ) Oct. 21 Oct. 16 Oct. 11 Oct. 6 Oct. 1 -7 -6 -5 -4 -3 -2 -1 0 0.0 0.2 0.4 0.6 0.8 1.0 1.2 Se a ic e thi ckne ss ( m ) Oct. 23 Oct. 18 Oct. 13 Oct. 8 Oct. 3 0 2 4 6 8 10 12 14 0.0 0.2 0.4 0.6 0.8
Bulk ice salinity
0 2 4 6 8 10 12 14 0.0 0.2 0.4 0.6 0.8 1.0 1.2 0 20 40 60 80 100 120 0.0 0.2 0.4 0.6 0.8
Calculated brine salinity
0 20 40 60 80 100 120 0.0 0.2 0.4 0.6 0.8 1.0 1.2 0.0 0.1 0.2 0.3 0.4 0.0 0.2 0.4 0.6 0.8
Brine volume fraction
0.0 0.1 0.2 0.3 0.4 0.0 0.2 0.4 0.6 0.8 1.0 1.2 -6 -5 -4 -3 -2 -1 0 1 2 3 0.0 0.2 0.4 0.6 0.8 δ18O (‰) -6 -5 -4 -3 -2 -1 0 1 2 3 0.0 0.2 0.4 0.6 0.8 1.0 1.2
a. Brussels
b. Liège
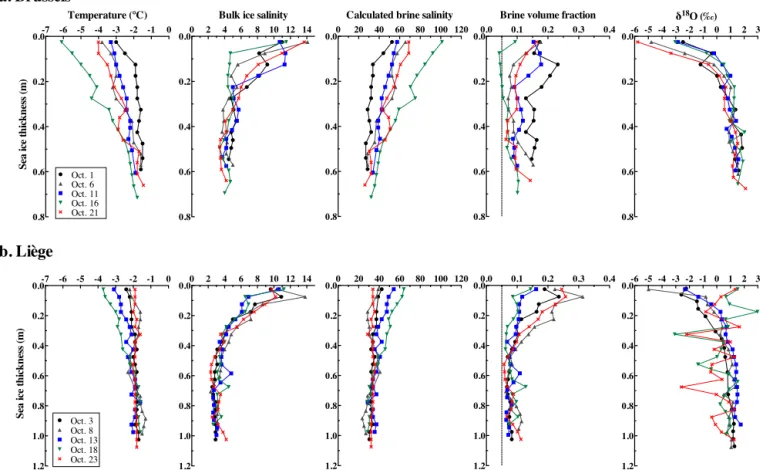
Figure 4. Profiles of temperature (◦C), bulk ice salinity, calculated brine salinity, brine volume fraction, and18O isotopic ratio from the Brussels (top panels) and Liège (bottom panels) sites.
At the Brussels site, the ice thickness, as determined by coring, ranged from 55 to 67 cm, while the snow cover ranged from 8 to 25 cm (Fig. 2a). The ice freeboard was pos-itive and ranged from 0.7 to 3 cm. The ice cover was mainly composed of columnar crystals (Lewis et al., 2011). The ice temperatures ranged from −1.5 to −6.1◦C (Fig. 4). The main changes in temperatures were observed in the top 40 cm of the ice cover, oscillating between cooling and warm-ing events within a 1◦C temperature window (from −3 to −4◦C), except on 16 October, when the near-surface ice
tem-perature decreased to −6.1◦C and the top 40 cm reached its
minimum observed temperature. The bulk ice salinity ranged from 3.4 to 14.1. The profiles were typically S-shaped, as de-scribed by Eicken (1992), with higher salinities (from 11.5 to 14.1) in the top layer, dropping to minimum values (on average, S = 4.1) at the bottom. Between 1 and 16 October, the brine salinities increased from the bottom to the top of the ice cover, with values close to seawater (S = 34) at the bottom to a maximum of 101 at the top on 16 October. The brine volume was always greater than 5 %, except in the top 20 cm of the ice cover on 16 October. The δ18O isotopic ratio ranged from −5.8 to 2.1 ‰. The top 15 cm showed negative
δ18O values at each sample interval, while the rest of the
pro-file was increasing steadily towards a value of +2 ‰ at the bottom.
At the Liège site, the ice and snow cover were thicker than at the Brussels site and ranged from 99 to 106 cm and from 28 to 38 cm, respectively (Fig. 2b). The ice freeboard was negative on 18 and 23 October, flooding the snow–ice inter-face. The ice cover at the Liège site was mainly composed of granular sea ice with inclusions of columnar and snow ice layers at different levels in the ice profile (see Lewis et al., 2011, for a detailed description of the ice texture profile at the Liège site). These inclusions, associated with sharp excur-sions in the δ18O ratios (Fig. 4), indicate a history of dynamic conditions and repeated subsequent rafting events (Lewis et al., 2011). The observed variations of the bulk ice tempera-ture and salinity, as well as the calculated brine salinity, were smaller than those observed at Brussels (Fig. 4). The ice tem-perature ranged from −1.3 to −3.7◦C. The ice cover showed similar warm and isothermal profiles on 3, 8, and 23 Octo-ber, with brine salinities close to seawater values throughout the ice column. The ice cover cooled from 8 to 18 October, when the minimum temperature and maximum brine salin-ity were observed, as we also observed at the Brussels site. The bulk ice salinity ranged from 2.3 to 13.8, and the salinity profiles were also typically S-shaped, with the top layer
rang-0 5 10 15 20 25 0 20 40 60 80 October Sa lini ty 0 5 10 15 20 25 7.5 8.0 8.5 9.0 9.5 October pH T 0 5 10 15 20 25 0 100 200 300 400 500 600 700 October pCO 2 (µ atm) - me as u re d 0 5 10 15 20 25 0 1000 2000 3000 4000 5000 October TA ( µ m ol k g -1) 0 5 10 15 20 25 0 1000 2000 3000 4000 5000 October n TA ( µ m ol k g -1) 0 5 10 15 20 25 0 100 200 300 400 500 600 700 October pCO 2 ( µ at m ) c al cu lat ed Lg - Brdeep Lg - Brsurf Bxl - Brdeep Bxl - Brsurf 0 5 10 15 20 25 0 1000 2000 3000 4000 5000 October T CO 2 ( µ m ol k g -1) 0 5 10 15 20 25 0 1000 2000 3000 4000 5000 October nT CO 2 ( µ m ol k g -1)
Figure 5. Evolution of salinity, pHT, TA (in µmol kg−1), nTA (TA normalized to a salinity of 34, in µmol kg−1), calculated T CO2(in
µmol kg−1) and nT CO2(T CO2normalized to a salinity of 34, in µmol kg−1), and measured and calculated pCO2(in µatm) in surface and
deep brine sackholes from the Brussels (Bxl) and Liège (Lg) sites. The dotted line represents the atmospheric pCO2in October 2007.
ing from 6.5 to 13.8, while the average salinity of the bottom layer was 3. The calculated brine volume fraction was always above 5 %. The δ18O ratios ranged from −4.9 to 2.9 ‰. At the top of the ice, δ18O was negative from 3 to 13 October and positive on our last 2 sampling days. In the lower half of the profiles, δ18O values were generally around 1 ‰, al-though the cores sampled on 18 and 23 October had negative
δ18O intervals, further indicative of ice rafting.
3.3 Carbonate system
At the Brussels site, TA in brine sampled from sackholes ranged from 2406 to 4855 µmol kg−1, while T CO
2 ranged from 2288 to 4110 µmol kg−1 (Fig. 5). Changes in TA and
TCO2 closely mimicked the salinity changes. Normalizing TA and T CO2 to a salinity of 34 (denoted as nTA and
nTCO2) indicate the sensitivity of these parameters to salin-ity changes; both nTA and nT CO2 remain relatively stable (2350 and 2010 µmol kg−1, respectively). The pHT ranged from 7.9 to 8.8 and increased continuously during the sur-vey, except for a significant decrease in the deeper brine on 16 October (Fig. 5) associated with decreased brine salinity
and TA. The in situ brine pCO2ranged from 82 to 392 µatm. Brine was undersaturated in CO2relative to the atmosphere (383.8 µatm in 2007), except on 16 October (Figs. 5 and 6). The brine pCO2calcwas similar to brine pCO2measured in situ (±50 µatm), except on 1 October when brine pCO2calc was extremely high (620 µatm, Fig. 5). From 1 to 6 October, the in situ brine pCO2 values were from 210 to 271 µatm (Fig. 6). Then, the in situ brine pCO2decreased on 11 Oc-tober and increased again on 16 OcOc-tober to concentrations ranging from 248 to 392 µatm. On 21 October, the in situ brine pCO2decreased down to concentrations ranging from 82 to 115 µatm. The bulk ice pCO2 ranged from 15 to 150 µatm (Fig. 6), generally increasing with depth and lower or equal to the brine pCO2.
At the Liège site, the brine salinity ranged from 38.1 to 58.3. TA ranged from 2806 to 4074 µmol kg−1, while
TCO2ranged from 1826 to 3590 µmol kg−1(Fig. 5). As for the Brussels site, TA and T CO2changes seem closely related to salinity changes, except on 3 October. The pHT ranged from 8.5 to 8.7 with a significant increase on 13 October to a maximum of 9.2 (Fig. 5). The in situ brine pCO2was
un-0 100 200 300 400 0.0 0.2 0.4 0.6 0.8 pCO2 (µatm) Se a ic e thi ckne ss ( m ) October 1 Brine Bulk ice 0 100 200 300 400 0.0 0.2 0.4 0.6 0.8 1.0 1.2 pCO2 (µatm) Se a ic e thi ckne ss ( m ) October 3 Brine Bulk ice 0 100 200 300 400 0.0 0.2 0.4 0.6 0.8 pCO2 (µatm) October 6 Brine Bulk ice 0 100 200 300 400 0.0 0.2 0.4 0.6 0.8 1.0 1.2 pCO2 (µatm) October 8 Brine Bulk ice 0 100 200 300 400 0.0 0.2 0.4 0.6 0.8 pCO2 (µatm) October 11 Brine Bulk ice 0 100 200 300 400 0.0 0.2 0.4 0.6 0.8 1.0 1.2 pCO2 (µatm) October 13 Brine Bulk ice 0 100 200 300 400 0.0 0.2 0.4 0.6 0.8 pCO2 (µatm) October 16 Brine Bulk ice 0 100 200 300 400 0.0 0.2 0.4 0.6 0.8 pCO2 (µatm) October 21 Brine Bulk ice 0 100 200 300 400 0.0 0.2 0.4 0.6 0.8 1.0 1.2 pCO2 (µatm) October 18 Brine Bulk ice 0 100 200 300 400 0.0 0.2 0.4 0.6 0.8 1.0 1.2 pCO2 (µatm) October 23 Brine Bulk ice a. Brussels b. Liège
Figure 6. Vertical profiles of the in situ brine pCO2(in µatm) and bulk ice pCO2(in µatm) from the Brussels (top panels) and Liège (bottom
panels) sites. Data at 0.075–0.125 and 0.175 m depth of the station on 16 October were measured while the brine volume was 4.1–4.4 and 4.6 %, respectively.
dersaturated compared to the atmosphere, with values rang-ing from 65 to 183 µatm. These values were consistent with the brine pCO2calc(±80 µatm). Changes of the in situ brine
pCO2were smaller than the variations at the Brussels site. The most significant change occurred on 18 October where the in situ brine pCO2increased to concentrations ranging from 147 to 183 µatm. The bulk ice pCO2ranged from 9 to 193 µatm (Fig. 6). Bulk ice pCO2were here generally more consistent with brine pCO2, except in the colder stations on 8 and 18 October. The minimum concentrations were ob-served in the top 20 cm of the ice cover, while the maximum concentrations were observed at the sea ice interface with the underlying seawater. The mean bulk ice pCO2ranged from 70 to 79 µatm from 3 to 18 October and increased to 97 µatm on 23 October.
The salinity and CO2system parameters were relatively constant in the underlying seawater during our survey (Fig. 7). We observed a slight decrease in the salinity on 13 October, while pHT decreased and T CO2 increased on 11 and 13 October. The seawater pCO2 measured in situ
was supersaturated relative to the atmosphere, ranging from 401 to 462 µatm.
3.4 Air–ice CO2fluxes
The CO2fluxes measured at the sea ice and snow interfaces with the atmosphere suggest that, except for a small efflux of 0.3 mmol m−2d−1measured over the ice at the Brussels site on 16 October, both the sea ice and the snow acted as sinks for atmospheric CO2 during our study (Fig. 8). In general, Brussels sea ice showed a small uptake of atmospheric CO2 that was not significantly different from zero (Fig. 8a). At Liège, the uptake of atmospheric CO2was more substantial, ranging up to −2.9 mmol m−2d−1over sea ice, with smaller values over snow-covered ice (Fig. 8b).
0 5 10 15 20 25 33.5 34.0 34.5 October Sa lini ty 0 5 10 15 20 25 7.5 8.0 8.5 October pH T 0 5 10 15 20 25 350 400 450 500 October pCO 2 ( µ at m ) 0m 1m 27m 0 5 10 15 20 25 2100 2200 2300 2400 October TA ( µ m ol k g -1) 0 5 10 15 20 25 2100 2200 2300 2400 October n TA ( µ m ol k g -1) 0 5 10 15 20 25 2100 2200 2300 2400 October T CO 2 ( µ m ol k g -1) 0 5 10 15 20 25 2100 2200 2300 2400 October nT CO 2 ( µ m ol k g -1)
Figure 7. Evolution of salinity, pHT, TA (in µmol kg−1), nTA (TA normalized to a salinity of 34, in µmol kg−1), calculated T CO2(in
µmol kg−1) and nT CO2(T CO2normalized to a salinity of 34, in µmol kg−1), and in situ pCO2(in µatm) in the underlying seawater at the ice-water interface and 1 and 27 m below the ice-water interface. The dotted line represents the atmospheric pCO2in 2007.
0 5 10 15 20 25 -8 -6 -4 -2 0 2 October CO 2 fl u xe s ( m m ol m -2 d -1) a. Brussels 0 5 10 15 20 25 -8 -6 -4 -2 0 2 October CO 2 fl u xe s ( m m ol m -2 d -1) b. Liège Sea ice Snow
Figure 8. CO2fluxes (in mmol m−2d−1) measured over sea ice and snow for the Brussels and Liège sites.
4 Discussion
4.1 Impact of atmospheric forcing and snow thickness
on the physical properties of the ice cover
At the beginning of the sampling period the ice cover at stations Brussels and Liège were nearly isothermal. Subse-quently, successive warm and cold events associated with passing atmospheric fronts (Fig. 3) affected the temperature gradient within the ice cover significantly. At both sites, the fluctuations in ice temperature occurred mainly in the top 40 cm (Fig. 4). The high brine salinities associated with the cold ice temperature at the top of the ice resulted in an
un-stable salinity gradient within the ice cover (Fig. 4). This may have initiated overturning of brine and the mixing with underlying seawater, with brine moving downward through the ice cover to be replaced by underlying seawater mov-ing upward (Lewis et al., 2011). To confirm this hypothe-sis, Lewis et al. (2011) reported presence of dissolution fea-tures observed on freshly extracted ice cores and thick sec-tions as well as under-ice photographs clearly showing brine drainage at the ice bottom. Brine convection is driven by the density difference between high-salinity brine in the ice and the seawater underneath. Its onset and strength can be de-scribed by the mushy-layer Rayleigh numbers (Ra) (Wett-laufer et al., 1997). Ra numbers provided by Brabant (2012)
suggest that brine drainage occurred at the Brussels site be-tween 1 and 6 October (Ra > 10) and bebe-tween 11 and 16 Oc-tober (6 < Ra < 7), which is also confirmed by vertical nu-trient distribution in the sea ice (Brabant, 2012). At the Liège site, thicker snow muted thermal fluctuations within the sea ice, reducing the magnitude of changes in brine vol-ume and salinity. Hence, the variations in brine salinity and in the resulting density gradient were more moderate at Liège (Fig. 4), resulting in a lower Ra (Brabant, 2012). It is also possible that some natural intra-site variability within the sea ice existed at the two sampling locations. Given the textu-ral evidence of dynamic processes at Liège (Lewis et al., 2011), one might intuit that variation within salinity espe-cially would be greater at that location, but this was not ob-served. Lewis et al. (2011) suggested that snow thickness was a key component in regulating the heat fluxes and morpho-logical changes in the sea ice during our study. The ice at the Brussels site had little snow accumulation (Fig. 2) and larger temperature changes than the Liège site (Fig. 4), where the snow cover was thicker and insulated the underlying sea ice cover. Indeed, snow has a low thermal conductivity, about an order of magnitude lower than that of sea ice, and therefore acts as a thermal insulator (Massom et al., 2001).
The presence of a thick snow cover also provided over-burden that resulted in negative freeboard (Fig. 2). The neg-ative freeboard observed at the Liège site toward the end of our study, associated with a permeable sea ice cover with an interconnected brine network, caused flooding of the ice surface and formed a saline slush layer (Lewis et al., 2011). Nutrient distribution data in the sea ice further confirmed that flooding occurred (Brabant, 2012).
4.2 Physical controls on inorganic carbon in sea ice
Larger sea ice temperatures changes observed at the Brus-sels site were associated with generally higher brine salini-ties (Figs. 4 and 5); higher TA, T CO2, and in situ pCO2; and lower pHT(Fig. 5) compared to the Liège site. These differ-ences were expected because most solute concentrations in-crease with brine salinity, which also dein-creases CO2 solubil-ity (Papadimitriou et al., 2004). As the temperature changes were mainly observed in the upper layer of the ice cover, the differences in salinity, TA, pHT, T CO2, and pCO2between the upper and lower brine samples were greater at Brussels than at Liège (Fig. 5). However, it is surmised that vertical re-distribution of brine between 1 and 6 October homogenized brine salinity, TA, pHT, T CO2, and pCO2between the two sackhole depths sampled on 6 October. Sea ice temperature decreased between 11 and 16 October, increasing the upper brine salinity and TA (Fig. 5), while the brine volume shrank below the 5 % level (Fig. 4), which in theory should indi-cate impermeability of the sea ice (Golden et al., 2007) at that thickness, isolating the upper brine layer from those be-low. Therefore, large differences were observed in salinity, TA, T CO2, and pHTbetween the upper layer and lower brine
samples. At Liège, thermal fluctuations in the ice cover were limited by thicker snow cover, resulting in small differences in salinity, TA, pHT, T CO2, and in situ pCO2between the upper and lower brine sample depths (Fig. 5).
Brine pCO2 and, to a lesser extent, bulk ice pCO2 both seem to follow the observed cyclical variations in the ice tem-peratures (Fig. 6), indicating that the dilution–concentration effect in large part controls the pCO2. As the ice cover cooled, the pCO2increased slightly (e.g., on 6 and 16 Oc-tober at the Brussels site and on 18 OcOc-tober at the Liège site; Figs. 4 and 5). Conversely, pCO2 dropped as temper-atures rose (e.g., on 11 and 21 October at Brussels and on 23 October at Liège). Because pCO2is highly dependent on temperature, the changes in both brine and bulk ice pCO2 were larger at the Brussels site than at the Liège site (due to the increased insulation provided by the snow cover at the latter). In addition, greater changes in brine volume con-tent throughout the ice column at the Brussels site (Fig. 4) led to more variability in brine pCO2 than in the bulk ice due to the effects of brine dilution–concentration (Fig. 6). At the Liège site, the pCO2 variations were limited by small variations in ice temperature under the thicker snow cover (Fig. 4). Surface flooding on 18 and 23 October might have hydrostatically forced high-pCO2seawater laterally or up-ward through the ice matrix. An increase of the in situ brine
pCO2 and TA was observed on 18 October, but these pa-rameters decreased on 23 October (Figs. 5–6). Therefore, the TA and pCO2fluctuations observed between 18 and 23 Oc-tober could also be solely explained by the changes in the thermal regime (cooling and then warming). Brine salinity seems to be the main control on the brine carbonate system; both nTA and nT CO2from both stations were relatively con-stant through most of the sampling period. The small scatter in the nT CO2concentrations could simply be due to errors in calculating nT CO2 from TA and pHT. Further, the gen-eral agreement between the measured and calculated brine
pCO2values (Fig. 5) seems to support the assumption that the equilibrium constants are valid at subzero temperatures and high salinities (Marion, 2001; Delille et al., 2007). Only on 1 October did the measured and calculated brine pCO2 values differ substantially, possibly because of errors in any of the measured parameters on that first day of sampling.
The in situ brine pCO2values are more variable than those in bulk ice (Fig. 6). Sampling brine using the sackhole tech-nique provides the advantage of a direct in situ measurement, but the origin of the brine that collects in the sackhole is un-known, and only brine that can move easily within the ice matrix is sampled. In addition, sackholes are subject to air– sea exchange during sampling, so the low-pCO2brine could well have absorbed at least some CO2from the air above it before we completed our measurements. Brine collected us-ing the sackhole technique represents interconnected liquid brine inclusions, in the form of relatively large brine chan-nels susceptible to mixing with the underlying, high-pCO2 seawater due to the flooding or other types of vertical
re-distribution. In comparison, our bulk ice pCO2analyses ad-dress brine at a well-defined location within the sea ice and include both brines and gas bubbles trapped within the ice matrix. It should be stressed that small isolated brine pockets trapped and isolated in the ice matrix are not sampled us-ing the sackhole technique but are nevertheless included in the bulk ice pCO2 measurement. In addition, the sackhole technique has a poor resolution as it integrates brine through the all sackhole depth, while the resolution of the bulk ice
pCO2is significantly better as the measurement is performed on a ice sample size of (4 cm × 4 cm × 4.5 cm). On the other hand, the relatively small size of the bulk ice pCO2 sam-ple might result in not including a (fast-responding) brine channel, the latter typically being several centimeters apart. Therefore, changes in bulk ice pCO2values are less variable, reflecting mostly internal melting due to temperature and re-sultant salinity changes in the ice cover. However, we as-sumed that microstructure changes due to cooling–warming processes during storage do not have any significant impact to our measurements. Sackhole brine samples highlight rapid changes in the brine network such as cooling/warming events in the ice, input of high-pCO2seawater or from brine con-vection, and possible contamination from contact with the at-mosphere during the 10–60-minute collection time window.
4.3 Biological controls on carbon dynamics within sea
ice
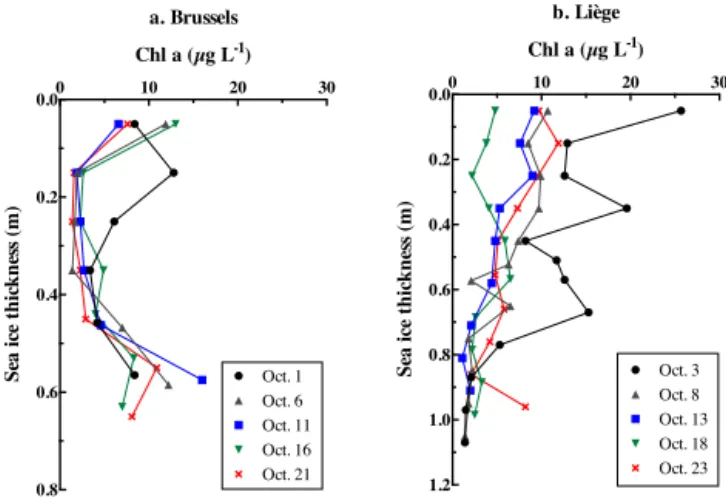
Dumont (2009) and Brabant (2012) presented a complete description of the distribution and concentration of organic matter, including chlorophyll a (e.g., Fig. 9) in sea ice at both the Brussels and Liège sites. The vertical Chl a distributions were more variable at the Liège site than at Brussels, but nei-ther site showed clear variations in Chl a associated with the changes in pCO2, save for during the flooding event at Liège from 18 to 23 October, which increased Chl a and pCO2. However, the presence of biology may overall contribute to the low pCO2measured on both sea ice and brine samples. The persistent opposite trends of the Chl a and pCO2profiles at Liège might reflect this contribution.
4.4 Antarctic sea ice as a springtime sink of
atmospheric CO2– comparison with the Arctic
The bulk ice pCO2values observed during the present study in the Antarctic are within the same range as those few records existing in the Arctic at Barrow, Alaska (Geilfus et al., 2012b), and Resolute Bay, Canada (Geilfus et al., 2014) (Fig. 10a and b), where sampling also included melting, nearly isothermal first-year landfast sea ice in late spring. Higher pCO2values were reported from early spring sea ice at Barrow (Geilfus et al., 2012b) and from SW Greenland (Crabeck et al., 2014). Albeit based on limited data, Antarc-tic sea ice may have lower pCO2values than Arctic sea ice at the same ice temperature (Fig. 10b and c, one-way ANOVA;
0 10 20 30 0.0 0.2 0.4 0.6 0.8 Chl a (µg L-1) Se a ic e thi ckne ss ( m ) a. Brussels Oct. 21 Oct. 16 Oct. 11 Oct. 6 Oct. 1 0 10 20 30 0.0 0.2 0.4 0.6 0.8 1.0 1.2 Chl a (µg L-1) Se a ic e thi ckne ss ( m ) b. Liège Oct. 23 Oct. 18 Oct. 13 Oct. 8 Oct. 3
Figure 9. Profiles of Chl a concentration within bulk sea ice at the Brussels and Liège sites, adapted from Dumont (2009).
F1,210=30.73, p < 0.001); however, differences in the sea ice texture and dynamical forcing between the two poles are important and may have substantial effects on permeability (and therefore fluxes) and should be further investigated. It is noteworthy that the observed range of concentrations sug-gests that Antarctic sea ice becomes undersaturated in CO2 relative to the atmosphere early in the winter–spring transi-tion and reaches levels not observed in Arctic sea ice un-til much later in the spring decay process (Geilfus et al., 2012a, b, 2014; Crabeck et al., 2014).
The bulk ice pCO2data were collected at different times of the year in the Arctic and in the Antarctic (early to late spring) under different temperature and salinity conditions. Therefore we looked at the relationship between the bulk ice
pCO2 and the brine volume (Fig. 10d). At low brine vol-umes (due to low T and/or high S) the bulk ice pCO2is high, while at high brine volumes (due to high T and/or low S) the bulk ice pCO2is low (Fig. 10d). It should also be noted that, both in the Arctic and in the Antarctic, spring sea ice can become undersaturated in CO2while the underlying seawa-ter is supersaturated with respect to the atmosphere (Fig. 7) (Papakyriakou and Miller, 2011).
During this study, we observed a net uptake of atmospheric CO2by the snow and sea ice at both sites. This uptake was on the same order of magnitude as previous fluxes reported over Antarctic sea ice during the austral summer by Delille (2006) and Nomura et al. (2013) and over Arctic sea ice by Semile-tov et al. (2004), Nomura et al. (2010a, b), and Geilfus et al. (2012a, 2013, 2014), using similar chamber techniques. At the Brussels site, fluxes measured over snow were simi-lar to those measured over bare ice, suggesting the thin snow cover had a limited impact on CO2exchange between the at-mosphere and sea ice. At the Liège site, thicker snow cover reduced the magnitude of the fluxes. The snow cover could have acted as a buffer between the ice and the atmosphere, as suggested by Miller et al. (2011). However, in contrast to
-10 -8 -6 -4 -2 0 0 500 1000 1500 2000 Temperature (°C) Bu lk ic e p CO 2 (µ atm ) 0 20 40 60 0 100 200 300 400 500
Brine volume fraction (%)
Bu lk ic e p CO 2 (µ atm ) -10 -8 -6 -4 -2 0 0 500 1000 1500 2000 Temperature (°C) in sit u br ine p CO 2 (µ atm ) -10 -8 -6 -4 -2 0 0 100 200 300 400 500 Temperature (°C) Bu lk ic e p CO 2 (µ atm )
Arctic - Crabeck et al., (2014) Arctic - Geilfus et al., (2014) Antarctic - this study
Antarctic - Delille (2006); Delille et al., (2007) Arctic - Geilfus et al., (2012a) Arctic - Geilfus et al., (2012b)
a. b.
c. d.
Figure 10. (a) The relationships between bulk ice pCO2(in µatm) and temperature measured in Antarctic (this study) and Arctic (Geilfus et
al., 2012b, 2014; Crabeck et al., 2014) sea ice; (b) zoom-in on the data from (a); (c) the relationships between in situ brine pCO2(in µatm)
and brine temperature in the Antarctic (this study; Delille, 2006; Delille et al., 2007) and Arctic sea ice (Geilfus et al., 2012a); (d) relationship between the bulk ice pCO2(in µatm) and the brine volume fraction (in %) measured in Antarctic (this study) and Arctic (Geilfus et al., 2012b,
2014; Crabeck et al., 2014) sea ice.
Nomura et al. (2010b), a snow cover thicker than 9 cm did not seem to completely prevent the CO2exchanges between the ice and the atmosphere.
5 Conclusions
The inorganic carbon dynamic within sea ice responded swiftly to short-term meteorological events during the SIMA expedition. The succession of warm and cold events im-pacted the physical properties of the sea ice and its inorganic carbon dynamics. Snow thickness modulated the heat flux to the sea ice, which impacted its salinity and therefore the sea ice carbonate system. Less snow and larger temperature vari-ations created larger varivari-ations in brine salinity, TA, T CO2, and brine and bulk ice pCO2. In addition, the combination of unstable salinity gradients within the ice cover and episodic warming events initiated vertical brine redistribution at the low-snow site on two occasions, homogenizing brine prop-erties vertically. At the end of the survey, flooding occurred
due to snow loading at the Liège site, bringing high-pCO2 seawater into the brine system.
During the early spring, sea ice was undersaturated and largely controlled by the brine dilution, although a potential impact of biology could contribute to the overall undersat-uration. We highlighted contrasted pCO2dynamics in bulk ice measurements as compared to sackhole measurements. The bulk ice pCO2values were much less variable, reflect-ing mostly internal temperature and salinity-driven thermo-dynamic changes, while pCO2variations in sackhole brine reflected rapid transport within an interconnected brine chan-nel network as well as potential exchange with the atmo-sphere and underlying surface waters.
At both sampling sites, the ice cover acted as a sink for atmospheric CO2, even despite episodic flooding by super-saturated seawater. Thus, during early spring the inorganic carbonate system in the sea ice of the Bellingshausen Sea behaved as a transition layer between the ocean and the at-mosphere, reacting to atmospheric forcing and from episodic interactions with the seawater.
Acknowledgements. The authors are grateful to the officers and
crew of the RVIB Nathaniel B. Palmer for their logistical assistance during the SIMBA cruise. We thank Kristel De Potter for helping measure the bulk ice pCO2and Keith Johnson for his help during
sample collection. The SIMBA project was supported by the Na-tional Science Foundation under NSF Grant ANT 0703682 – Sea Ice Mass Balance in the Antarctic to UTSA (S. F. Ackley, PI). This work was carried out within the framework of the Belgian research program Action de Recherche Concertée “Sea Ice Biogeochemistry in a CLIMate change perspective” (ARC-SIBCLIM) financed by the Belgian French Community under contract no. ARC-02/7-318287, the BELCANTO project (contracts SD/CA/03A&B) financed by the Belgian Federal Science Policy Office, and the Fonds de la Recherche Scientifique – FNRS (FRFC 2.4649.07). N.-X. Geilfus was supported by a FRIA (Fonds pour la Recherche en Industrie Agronomiques) grant and a grant from the Arctic Research Centre, Aarhus University. S. Rysgaard acknowledges the Canada Excellence Research Chairs Program. B. Delille is a research associate of the Fonds de la Recherche Scientifique – FNRS. This is a Mare contribution and a contribution to the Arctic Science Partnership (ASP), www.asp-net.org.
Edited by: M. Schneebeli
References
Brabant, F.: Physical and biogeochemical controls on the DMS/P/O cycle in Antarctic sea ice, Universite Libre de Bruxelles, Brux-elles, 300 pp., 2012.
Copin Montégut, C.: A new formula for the effect of temperature on the partial pressure of carbon dioxide in seawater, Mar. Chem., 25, 29-37, 1988.
Cox, G. F. N. and Weeks, W. F.: Equations for determining the gas and brine volumes in sea-ice samples, J. Glaciol., 29, 306–316, 1983.
Crabeck, O., Delille, B., Thomas, D., Geilfus, N.-X., Rysgaard, S., and Tison, J.-L.: CO2 and CH4 in sea ice from a
subarc-tic fjord under influence of riverine input, Biogeosciences, 11, 6525–6538, doi:10.5194/bg-11-6525-2014, 2014.
Delille, B.: Inorganic carbon dynamics and air-ice-sea CO2fluxes in the open and coastal waters of the Southern Ocean, Université de Liège, Liège, 296 pp., 2006.
Delille, B., Jourdain, B., Borges, A. V., Tison, J. L., and Delille, D.: Biogas (CO2, O2, dimethylsulfide) dynamics in spring Antarctic
fast ice, Limnol. Oceanogr., 52, 1367–1379, 2007.
Delille, B., Vancoppenolle, M., Geilfus, N. X., Tilbrook, B., Lannuzel, D., Schoemann, V., Becquevort, S., Carnat, G., Delille, D., Lancelot, C., Chou, L., Dieckmann, G. S., and Tison, J.-L.: Southern Ocean CO2 sink: the contribution of the sea ice, J. Geophys. Res.-Oceans, 119, 6340–6355, doi:10.1002/2014JC009941, 2014.
Dickson, A. G. and Millero, F. J.: A comparison of the equilibrium constants for the dissociation of carbonic acid in seawater media, Deep-Sea Res. Pt. II, 34, 1733–1743, 1987.
Dieckmann, G. S. and Hellmer, H. H.: The importance of Sea Ice: An Overview, in: Sea Ice, second edition, edited by: Thomas, D. N. and Dieckmann, G. S., Wiley-Blackwell, Oxford, 1–22, 2010.
DOE: Handbook of methods for the analysis of the various pa-rameters of the carbon dioxide system in sea water, version 2, edited by: Dickson, A. G. and Goyet, C., ORNL/CDIAC-74, http://cdiac.ornl.gov/oceans/DOE_94.pdf (last access: 19 De-cember 2014), 1994.
Dumont, I.: Interactions between the microbial network and the or-ganic matter in the Southern Ocean: impacts on the biological carbon pump, Université Libre de Bruxelles, Bruxelles, 202 pp., 2009.
Eicken, H.: Salinity Profiles of Antarctic Sea Ice - Field Data and Model Results, J. Geophys. Res.-Oceans, 97, 15545–15557, 1992.
Frankignoulle, M.: Field-Measurements of Air Sea CO2Exchange,
Limnol. Oceanogr., 33, 313–322, 1988.
Frankignoulle, M. and Borges, A. V.: Direct and indirect pCO2
measurements in a wide range of pCO2and salinity values (the
Scheldt estuary), Aquat. Geochem., 7, 267–273, 2001.
Geilfus, N. X., Carnat, G., Papakyriakou, T., Tison, J. L., Else, B., Thomas, H., Shadwick, E., and Delille, B.: Dynamics of pCO2 and related air-ice CO2fluxes in the Arctic coastal zone
(Amund-sen Gulf, Beaufort Sea), J. Geophys. Res.-Oceans, 117, C00G10, doi:10.1029/2011JC007118, 2012a.
Geilfus, N. X., Delille, B., Verbeke, V., and Tison, J. L.: Towards a method for high vertical resolution measurements of the partial pressure of CO2within bulk sea ice, J. Glaciol., 58, 287–300,
2012b.
Geilfus, N. X., Carnat, G., Dieckmann, G. S., Halden, N., Nehrke, G., Papakyriakou, T., Tison, J. L., and Delille, B.: First estimates of the contribution of CaCO3precipitation to the release of CO2
to the atmosphere during young sea ice growth, J. Geophys. Res., 118, 224–255, doi:10.1029/2012JC007980, 2013.
Geilfus, N.-X., Galley, R. J., Crabeck, O., Papakyriakou, T., Landy, J., Tison, J.-L., and Rysgaard, S.: Inorganic carbon dynamics of melt pond-covered first year sea ice in the Canadian Arctic, Bio-geosciences Discuss., 11, 7485–7519, doi:10.5194/bgd-11-7485-2014, 2014.
Gleitz, M., vd Loeff, M. R. D., Thomas, N., Dieckmann, G. S., and Millero, F. J.: Comparison of summer and winter inorganic carbon, oxygen and nutrient concentrations in Antarctic sea ice brine, Mar. Chem., 51, 81–91, 1995.
Golden, K. M., Ackley, S. F., and Lytle, V. I.: The percolation phase transition in sea ice, Science, 282, 2238–2241, 1998.
Golden, K. M., Eicken, H., Heaton, A. L., Miner, J., Pringle, D. J., and Zhu, J.: Thermal evolution of permeability and microstructure in sea ice, Geophys. Res. Lett., 34, L16501, doi:10.1029/2007GL030447, 2007.
Gran, G.: Determination of the equivalence point in potentiometric titration, Analyst, 77, 661–671, 1952.
Leppäranta, M. and Manninen, T.: The brine and gas content of sea ice with attention to low salinities and high temperatures, Rep., Finnish Institute of Marine Research, Helsinki, 15 pp., 1988. Lewis, M. J., Tison, J. L., Weissling, B., Delille, B., Ackley, S. F.,
Brabant, F., and Xie, H.: Sea ice and snow cover characteristics during the winter-spring transition in the Bellingshausen Sea: An overview of SIMBA 2007, Deep-Sea Res. Pt. II, 58, 1019–1038, 2011.
Marion, G. M.: Carbonate mineral solubility at low temperatures in the Na-K-Mg-Ca-H-Cl-SO4-OH-HCO3-CO3-CO2-H2O sys-tem, Geochim. Cosmochim. Acta, 65, 1883–1896, 2001.
Massom, R. A., Eicken, H., Haas, C., Jeffries, M. O., Drinkwater, M. R., Sturm, M., Worby, A. P., Wu, X., Lytle, V. I., Ushio, S., Morris, K., Reid, P. A., Warren, S. G., and Allison, I.: Snow on Antarctic Sea ice, Rev. Geophys., 39, 413–445, 2001.
Mehrbach, C., Culberson, C. H., Hawley, J. E., and Pytkowicz, R. M.: Measurements of the apparent dissociation constants of carbonic acid in seawater at atmospheric pressure, Limnol. Oceanogr., 18, 897–907, 1973.
Miller, L. A., Chierici, M., Johannessen, T., Noji, T. T., Rey, F., and Skjelvan, I.: Seasonal dissolved inorganic carbon variations in the Greenland Sea and implications for atmospheric CO2
ex-change, Deep-Sea Res. Pt. II, 46, 1473–1496, 1999.
Miller, L. A., Papakyriakou, T., Collins, R. E., Deming, J., Ehn, J., Macdonald, R. W., Mucci, A., Owens, O., Raudsepp, M., and Sutherland, N.: Carbon Dynamics in Sea Ice: A Win-ter Flux Time Series, J. Geophys. Res.-Oceans, 116, C02028, doi:10.1029/2009JC006058, 2011.
Nomura, D., Eicken, H., Gradinger, R., and Shirasawa, K.: Rapid physically driven inversion of the air-sea ice CO2flux in the sea-sonal landfast ice off Barrow, Alaska after onset surface melt, Cont. Shelf Res., 30, 1998–2004, 2010a.
Nomura, D., Yoshikawa-Inoue, H., Toyota, T., and Shirasawa, K.: Effects of snow, snow-melting and re-freezing processes on air-sea ice CO2flux, J. Glaciol., 56, 262–270, 2010b.
Nomura, D., Granskog, M. A., Assmy, P., Simizu, D., and Hashida, G.: Arctic and Antarctic sea ice acts as a sink for atmospheric CO2 during periods of snowmelt and
sur-face flooding, J. Geophys. Res.-Oceans, 118, 6511–6524, doi:10.1002/2013JC009048, 2013.
Papadimitriou, S., Kennedy, H., Kattner, G., Dieckmann, G. S., and Thomas, D. N.: Experimental evidence for carbonate precipita-tion and CO2degassing during sea ice formation, Geochim.
Cos-mochim. Acta, 68, 1749–1761, 2004.
Papadimitriou, S., Thomas, D. N., Kennedy, H., Haas, C., Kuosa, H., Krell, A., and Dieckmann, G. S.: Biogeochemical composi-tion of natural sea ice brines from the Weddell Sea during early austral summer, Limnol. Oceanogr., 52, 1809–1823, 2007. Papakyriakou, T. and Miller, L.: Springtime CO2 exchange over
seasonal sea ice in the Canadian Arctic Archipelago, Ann. Glaciol., 52, 215–224, 2011.
Parmentier, F.-J. W., Christensen, T. R., Sørensen, L. L., Rysgaard, S., McGuire, A. D., Miller, P. A., and Walker, D. A.: The impact of lower sea-ice extent on Arctic greenhouse-gas exchange, Nat. Clim. Change, 3, 195–202, doi:10.1038/nclimate1784, 2013. Rysgaard, S., Glud, R. N., Sejr, M. K., Bendtsen, J., and
Chris-tensen, P. B.: Inorganic carbon transport during sea ice growth and decay: A carbon pump in polar seas, J. Geophys. Res.-Oceans, 112, C03016, doi:10.1029/2006JC003572, 2007.
Rysgaard, S., Bendtsen, J., Delille, B., Dieckmann, G. S., Glud, R. N., Kennedy, H., Mortensen, J., Papadimitriou, S., Thomas, D. N., and Tison, J. L.: Sea ice contribution to the air-sea CO(2) exchange in the Arctic and Southern Oceans, Tellus B, 63, 823– 830, 2011.
Rysgaard, S., Glud, R. N., Lennert, K., Cooper, M., Halden, N., Leakey, R. J. G., Hawthorne, F. C., and Barber, D.: Ikaite crystals in melting sea ice – implications for pCO2and pH levels in
Arc-tic surface waters, The Cryosphere, 6, 901–908, doi:10.5194/tc-6-901-2012, 2012.
Rysgaard, S., Wang, F., Galley, R. J., Grimm, R., Notz, D., Lemes, M., Geilfus, N.-X., Chaulk, A., Hare, A. A., Crabeck, O., Else, B. G. T., Campbell, K., Sørensen, L. L., Sievers, J., and Pa-pakyriakou, T.: Temporal dynamics of ikaite in experimental sea ice, The Cryosphere, 8, 1469–1478, doi:10.5194/tc-8-1469-2014, 2014.
Semiletov, I. P., Makshtas, A., Akasofu, S. I., and Andreas, E. L.: Atmospheric CO2balance: The role of Arctic sea ice, Geophys.
Res. Lett., 31, L05121, doi:10.1029/2003GL017996, 2004. Thomas, D. N. and Dieckmann, G. S.: Sea Ice – An introduction to
its physics, biology, chemistry and geology, in: Sea Ice, edited by: Thomas, D. N. and Dieckmann, G. S., 2nd Edn., Science, Oxford, UK, Wiley, Blackwell, London, p. 621, 2010.
Tison, J. L., Worby, A., Delille, B., Brabant, F., Papadimitriou, S., Thomas, D., de Jong, J., Lannuzel, D., and Haas, C.: Tempo-ral evolution of decaying summer first-year sea ice in the West-ern Weddell Sea, Antarctica, Deep-Sea Res. Pt. II, 55, 975–987, 2008.
Vancoppenolle, M., Timmermann, R., Ackley, S. F., Fichefet, T., Goosse, H., Leonard, K. C., Lieser, J., Nicolaus, M., Papakyri-akou, T., and Tison, J.-L.: Assessment of radiation forcing data sets for large-scale sea ice models in the Southern Ocean, Deep-Sea Res. Pt. II, 58, 1237–1249, 2011.
Weeks, W. F. (Ed.): On Sea Ice, Fairbanks, University of Alaska Press, Alaska, 664 pp., 2010.
Wettlaufer, J. S., Worster, M. G., and Huppert, H. E.: Natural con-vection during solidification of an alloy from above with appli-cation to the evolution of sea ice, J. Fluid Mech., 344, 291–316, 1997.
Zemmelink, H. J., Delille, B., Tison, J. L., Hintsa, E. J., Houghton, L., and Dacey, J. W. H.: CO2deposition over the multi-year ice
of the western Weddell Sea, Geophys. Res. Lett., 33, L13606, doi:10.1029/2006GL026320, 2006.